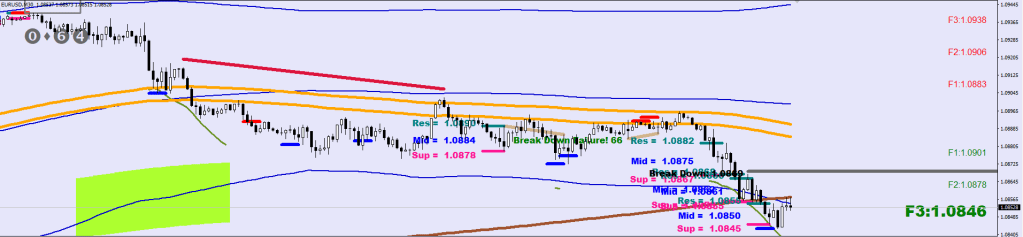
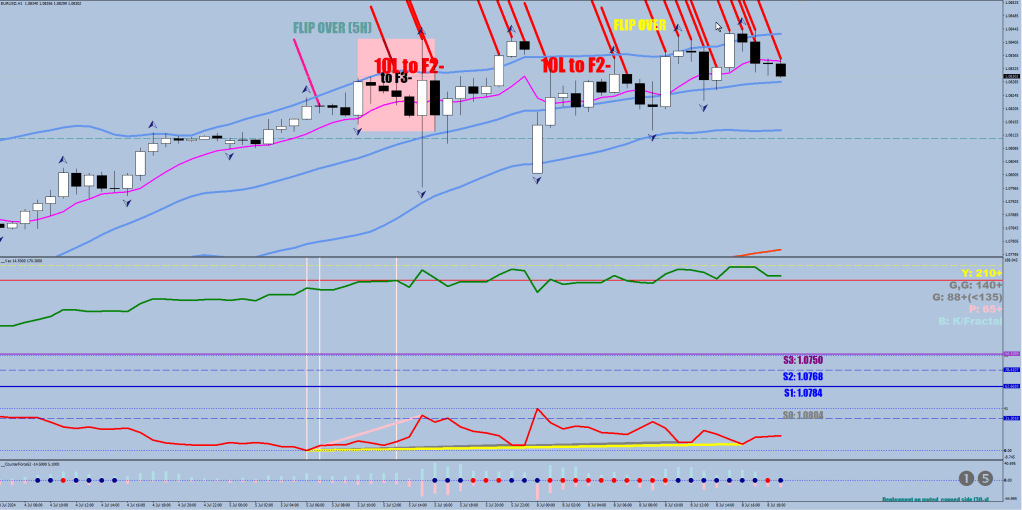
The trade-off is that when the market flips, the brakes won’t work either.
The flip? If you use my MFI plot that has red shading below the original 50 reading, you would see that the top fractal had a negative (upside down print).
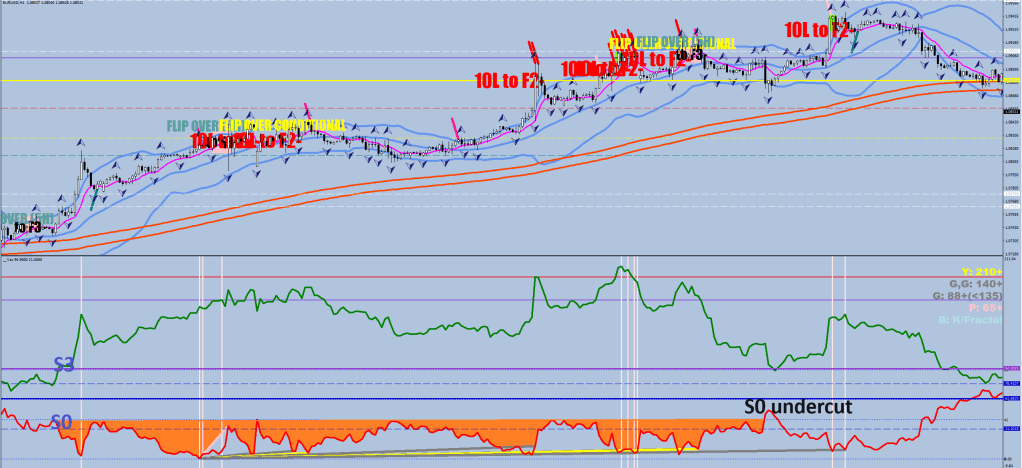
The brakes, S1 and S2 did not hold, S3 was just undercut.
This is the first Full Discharge, and the guidance is a bounce back to the hourly E-44 first.
Since the S-356 band is ascending, this should be a fake-out.
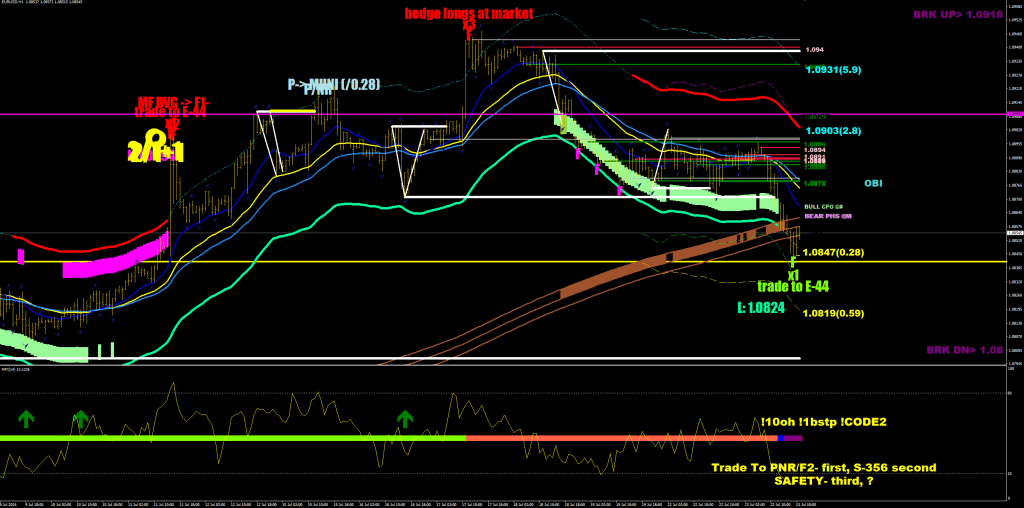
The P/NR print is at 1.0921. F2 minus is 1.0901. There is a possibility of a serial unraveling thanks to the column of Spinners left on the way down.
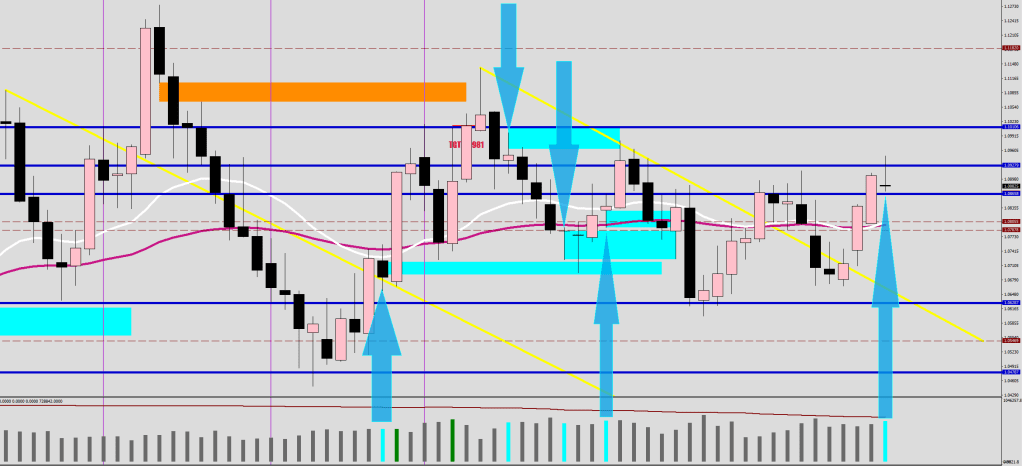
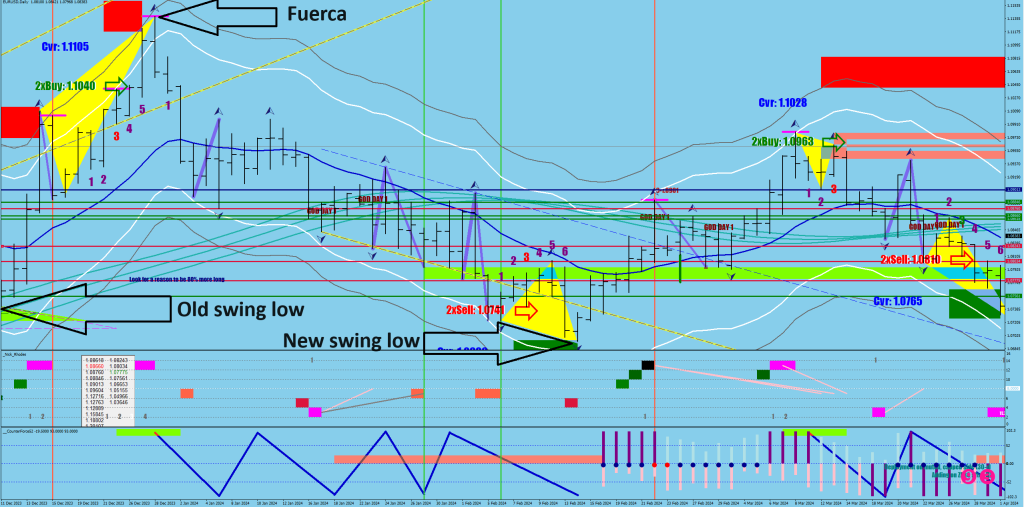
The first thing to say is that this is a converging, sideways market.
The largest dilation between the 21 EMA and the 59 EMA was 60 pips in the last 40 weeks, so the swing highs and lows made within the year are likely safe.
The second thing to notice is the U-turn with a gap down and a gap up around the slanted line.
Classic trap, like an abandoned baby is. The space between the interrupted brown lines is the mean zone.
The third thing is that a good swing high has 90+pips to the first weekly black close from the high.
Well, the market just violated the last one which may mean a change of direction.
Now, the volume part.
Look at what happens when the weekly volume shows professional activity.
Yes, you get a doji-looking thing as all the available volume gets absorbed/hijacked.
The color of the candle does not matter. What does matter is the previous body. You are going to see a continuation in its direction the next week. Out of the previous 4 arrows, these were either setting a trap (50%) or reinvigorated the trending move (50%). Since we are not coming off of a major swing low, my money would be on the trap. The arrow pointing down managed 28 pips, the one pointing up added another 120 pips.
I’m thinking of seeing 90-110 pips at the peak next week from 1.0949. That’s 1.1039-1.1059.
This, what you just went through was a technical analysis.
I’m saying this because this guy does something else.
“But if I draw the trendline like this” – nobody gives a hoot about how you are drawing lines.
“90% off lifetime membership” – to what exactly?
“If you want my help…” – you cannot help yourself, and export your ill bias to everyone else.
“I was wrong…” – no shit. Please avoid this kind of “streetsmart” crap.
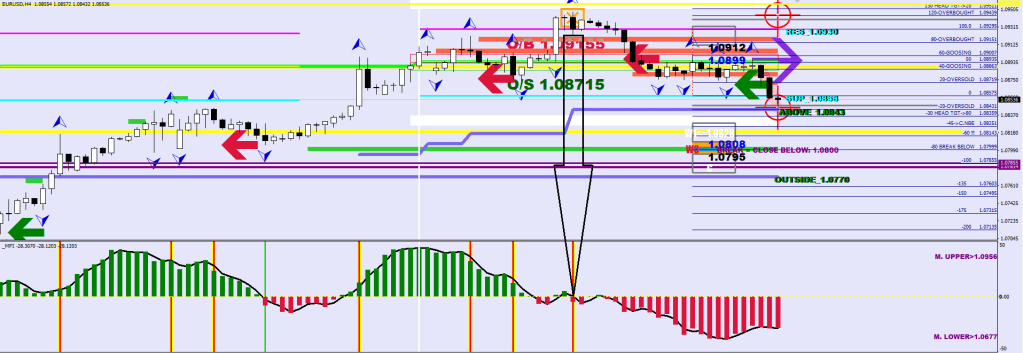
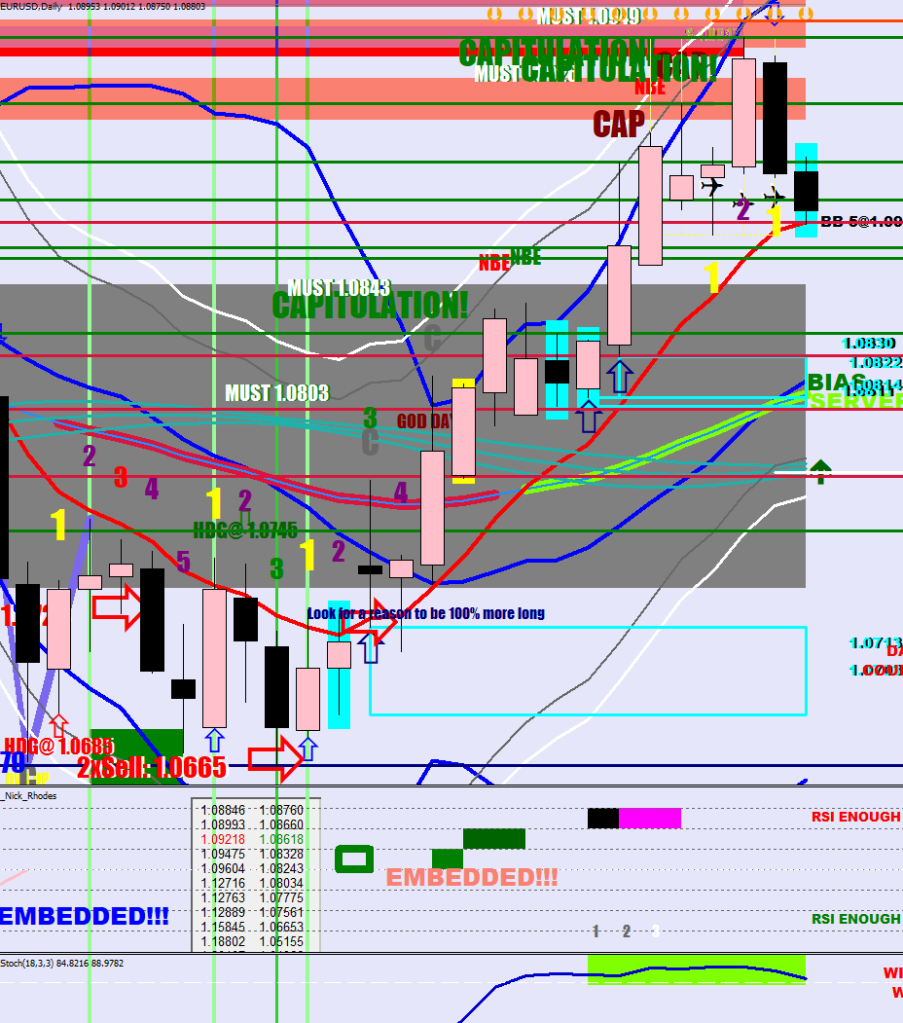
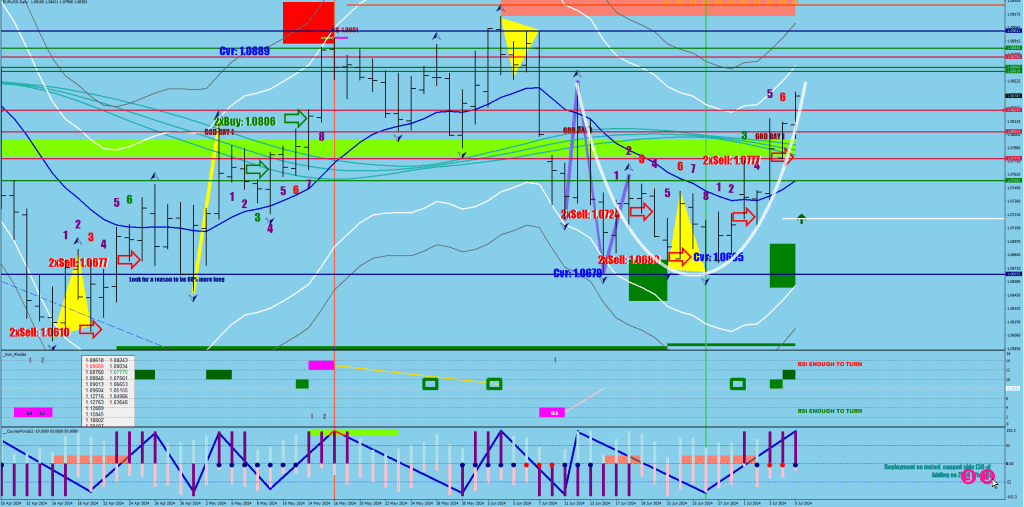
First of all, the cover level of the longs, 1.0947 was plotted 30+ trading days ago.
Secondly, this market has both embedded stochastic to the upside (daily) and to the downside (hourly).
The money flow seems to not get more oversold anymore.
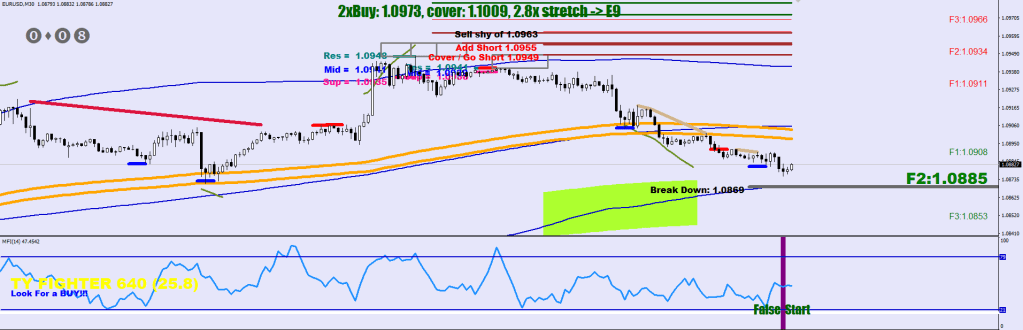
This is a sideways market, where we are working on the extension beyond an A leg up (which plotted the cover level).
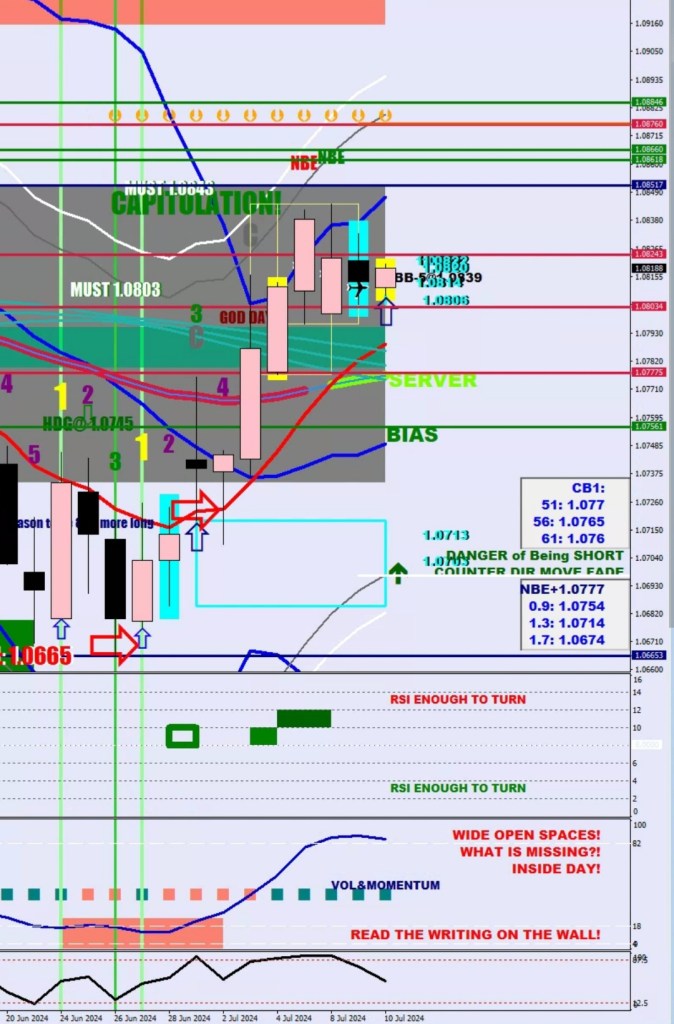
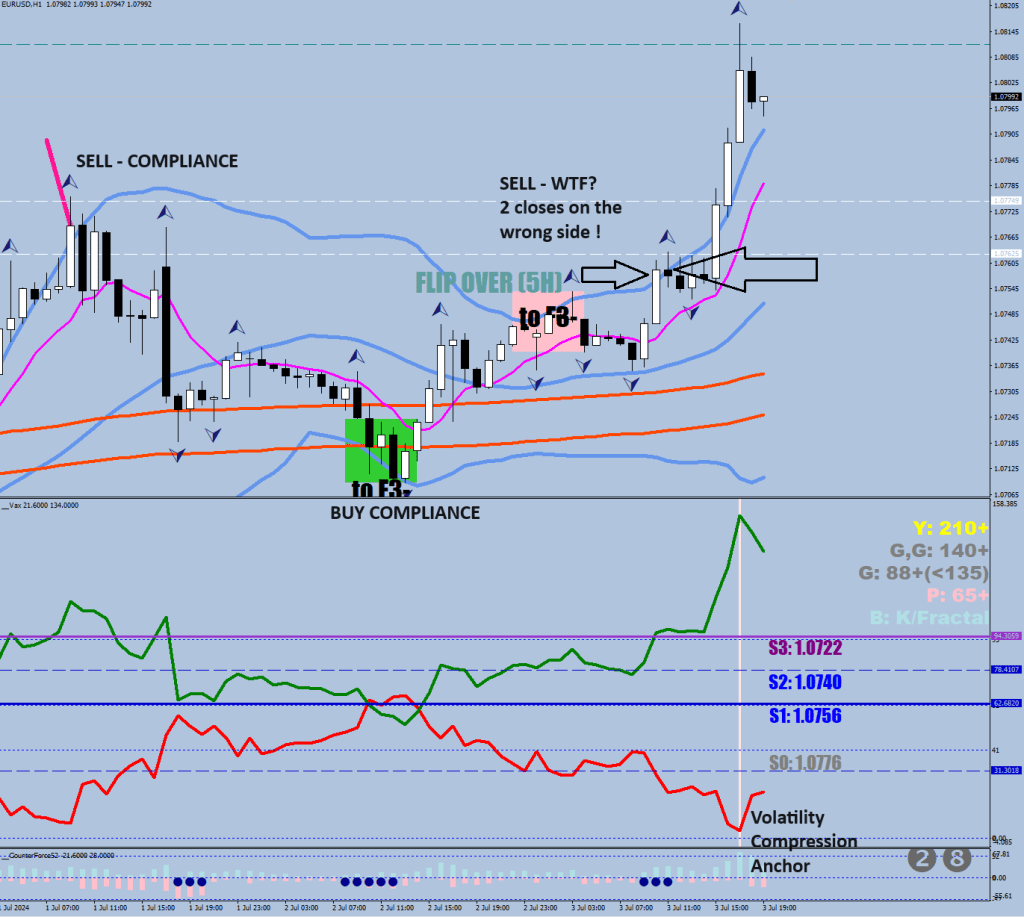
After the S0 inferno, we have closed up on the S2. I do not fancy the gray divergence for an end.
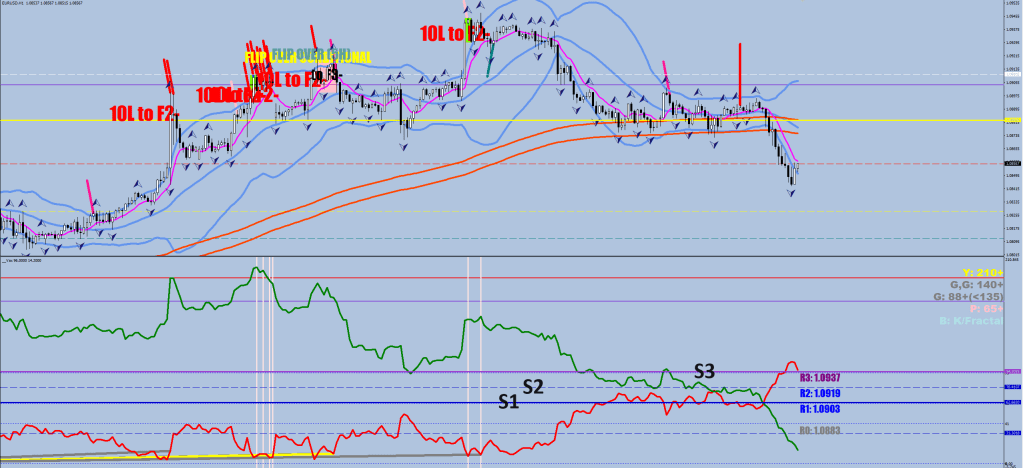
A classic mean reversion to the E-9. There should be another yellow divergence later on with the Green volatility line staying below 166. Call this move back down a Wave 4.
I believe that there would be at least one, but very likely 2 more bow-backs up, and an ultimate high beyond 1.10, perhaps 1.1006-1.1030
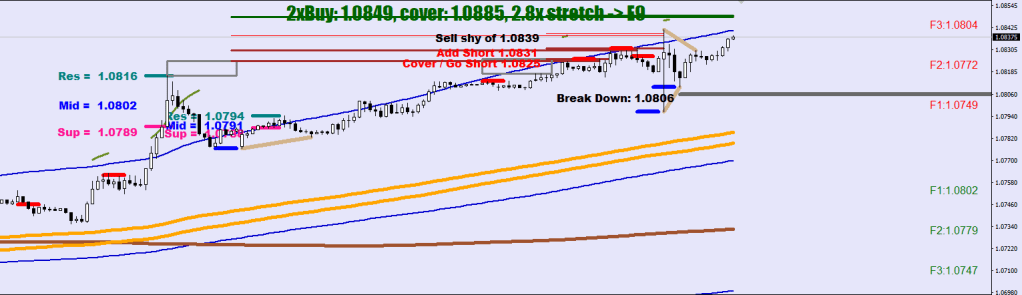
Flat top/drop. I just reminded myself of Omni Oscar Mahoney and the time when I commented on one of his videos: Coke?
So yeah, I do not like this top for a swing high due to the lack of volatility (here meaning less than 2.5x fluctuation maximum stretch from the E-9 band). The bow back counter requires the tag of at least the gray line. Gladys & Gentlemen, the moment we’ve all been debating for…
…is still not happening – or is it?
The gray, flexi line is at 2.5, whilst the white is going with the 2.8 standard.
It feels like 3 participants are holding maximum longs and no new money coming in.
It reminds me of a Pif gag, where they are trying to get into a pyramid, and the riddle they find is this:
“You hold each other’s chin, and whoever laughs first, gets slapped”.
The CTAs are not about to blink that’s for sure. Either the small or the large speculators have to start selling.
There is a major squeeze going on right now.
Finally, there’s a yellow line. With divergences, the steeper does not mean better. I changed the value cut off to 31, so the first divergence shows up in pink, which is an “early” divergence, not a final one.
A yellow should mean 210+ pips down from the high ( 1.0845->1.0630- )
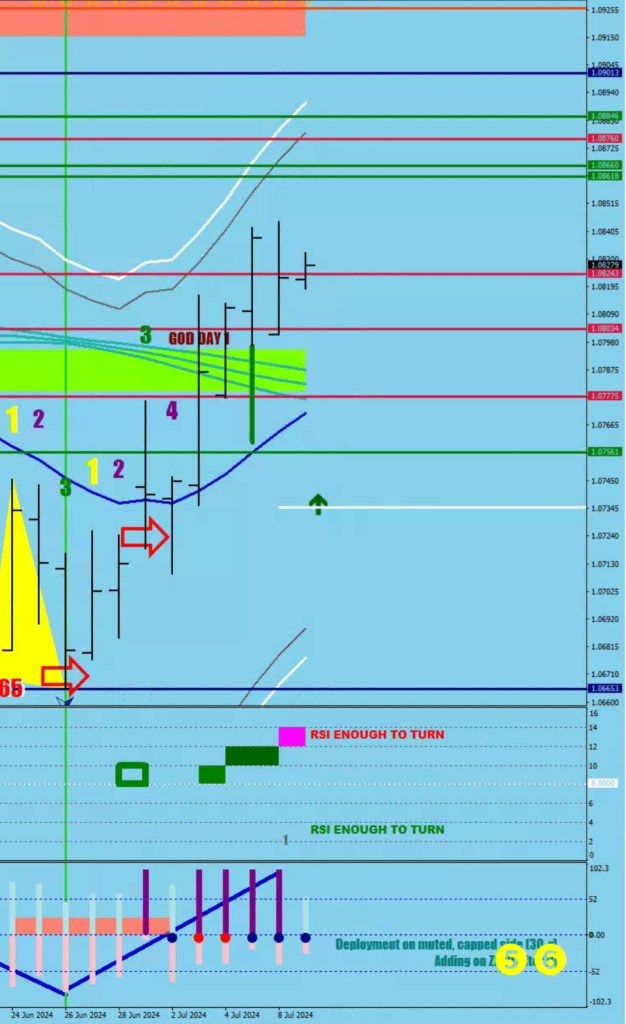
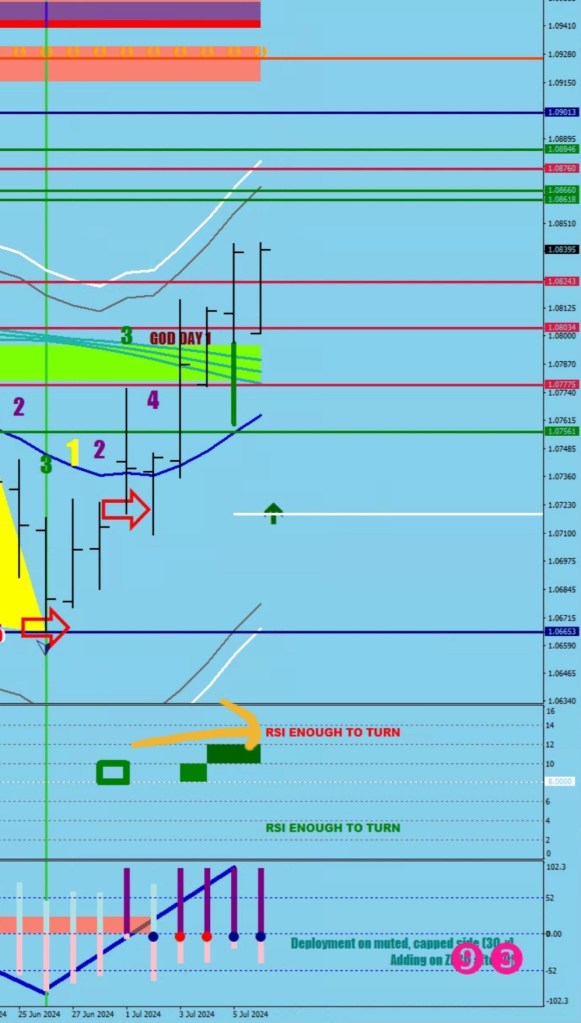
Let’s say that a Bow Back is a move that takes place in a 3-9 day stretch (3 or 7 are the most common).
Yellow triangles for visuals.
If the ending point exceeds the starting point, the new leg has extra force behind it, thus the swing low/high would get taken out.
Of course, in the above picture, the bottom triangle showed force, and it should have made a new higher swing high – it can be overruled down the line by a no-strength unassuming turn (the embedding gets put off and the sequence goes as magenta RSI2, embedding, a new fractal with a strong RSI2 divergence).
If the ending does not exceed the starting point, the new leg has no extra force behind it, thus the swing low/high would not be reached before turning back.
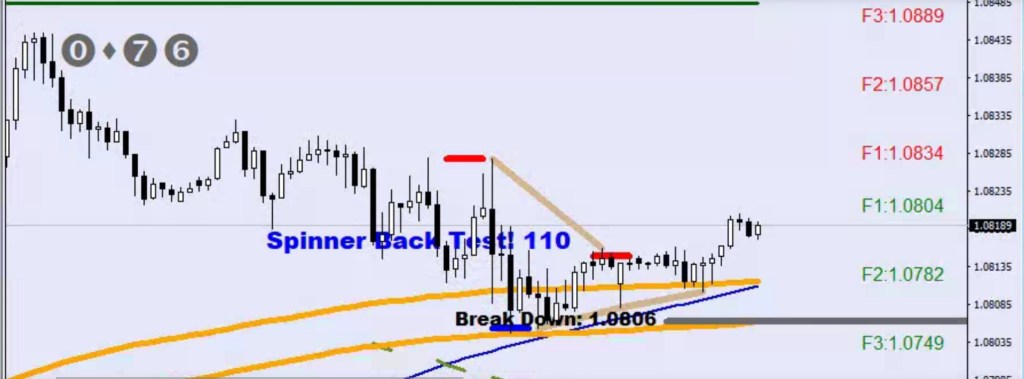
The following example is a bow-back that gets immediately choked by a liquidity break leg.
What does this leave us with?
Since the move up has some extra force behind it (lower low on the bow back), it probably is aimed at a new high. There seems to be a cup & handle forming. For the handle, I think you should see a 90+ pips drop, and the move back up may as well print a new bow back. A magenta print is basically a given with Monday, and there may be a limbo with 1 or 2 slightly higher highs with a bow back soon after as an alternate route.
This was a very clean full reversal inside the money flow reversal zone.
The hairy zone would have started from 1.0849. It fell 7 pips shy.
Next 210+ pips are on the downside.
Oops, here comes gravity.
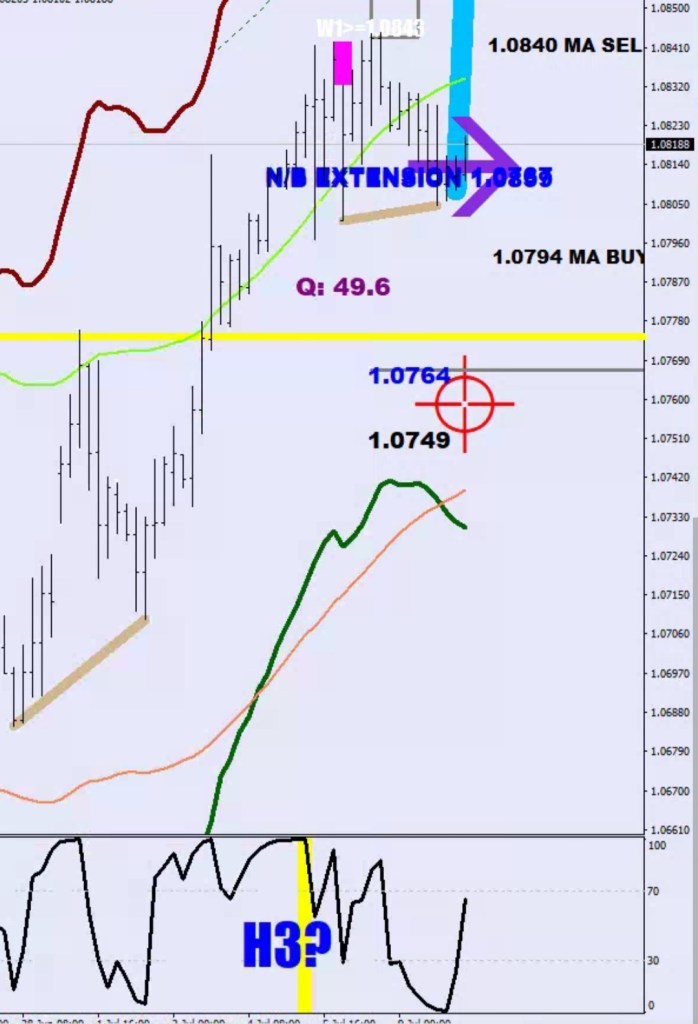
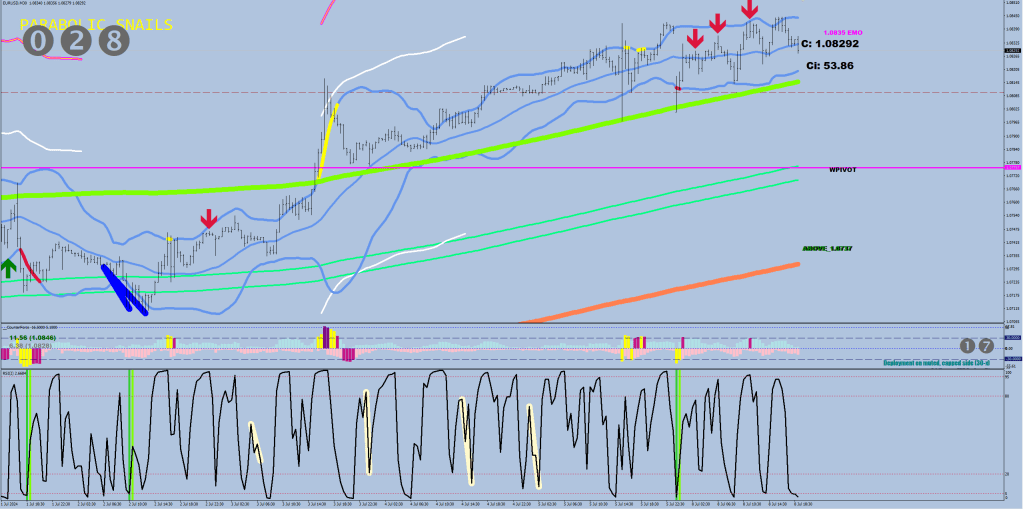
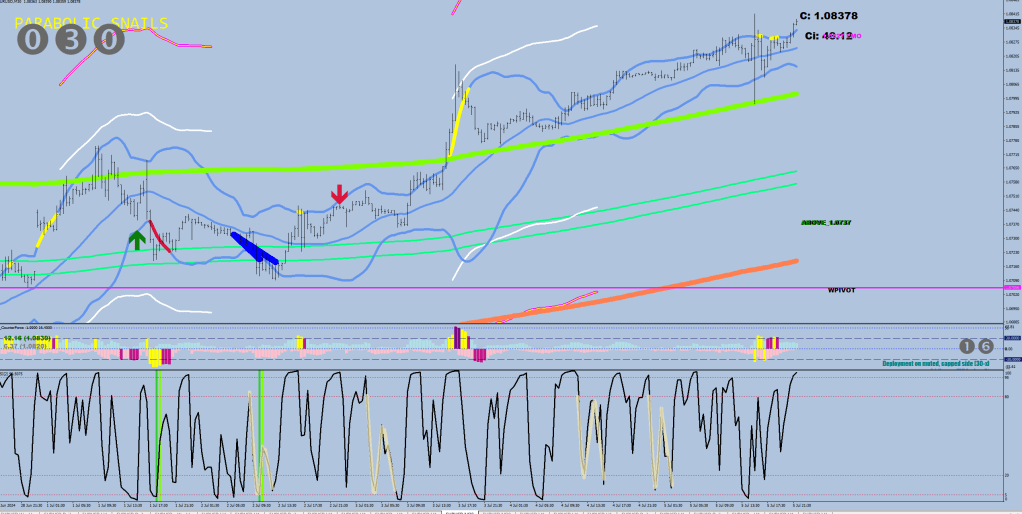
The title refers to the RSI2 ABC move’s C leg arriving below the 20 read – end of correction, stair-stepping higher – see the highlights. Yeah, that’s what I use instead of Japanese candle sticks, no printouts, no journaling, no nothing.
What you can get out of these squeeze releases normally is the price going outside the band 3x (unless it is going parabolic – 7hr plus without touching the 8 EMO).
Let’s suffer together. (Complimentary phonk music at the end.)
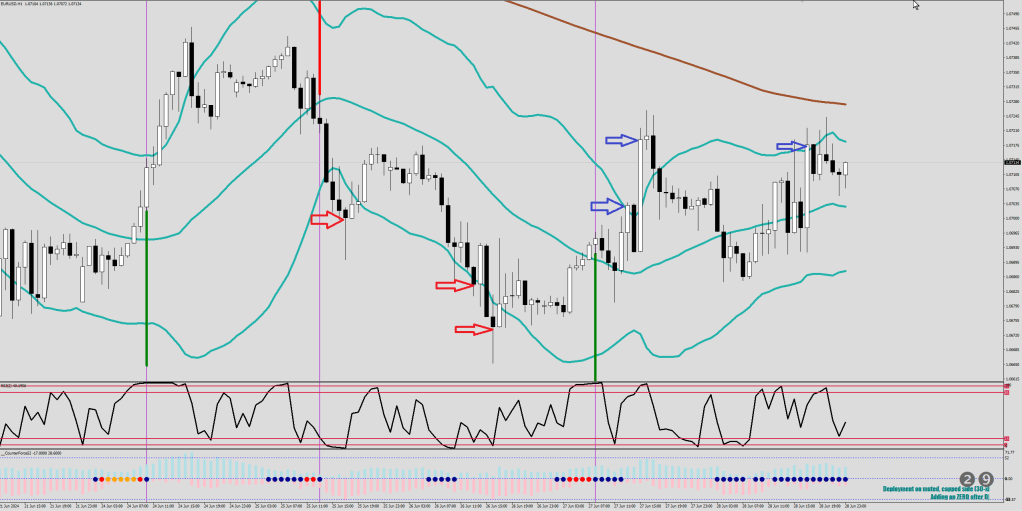
Can a squeeze have predicting power about the direction of an impending break?
We are working with 3 different colors, Blue, Red, and Orange to express the strength of a squeeze.
The green arrows are Downgrades, meaning a squeeze is starting to unravel. The period arriving at the arrow is where the shape of the 30 sample BB comes into the picture. There are two vectors (rate of change), the upper and the lower, and there is always one that is the preferred side based on how narrowly it is closing up on the price. The yellow ones are the steeper vectors highlighting the path of the preferred route. There are examples when the price goes after the wrong vector first, but then no break out would occur, just a more pronounced high / low gets made.
The RSI2 is there to deal with the momentum part and can help with figuring out the possible length / terminal nature (one or more legs to follow) of the break.
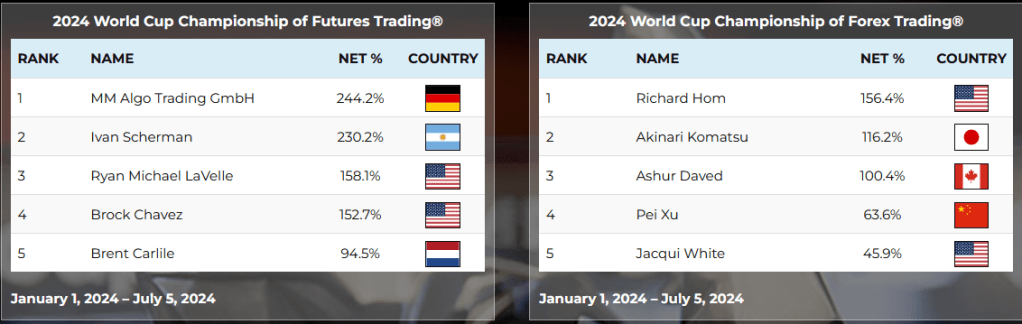
This was a starter. French Elections on Sunday.
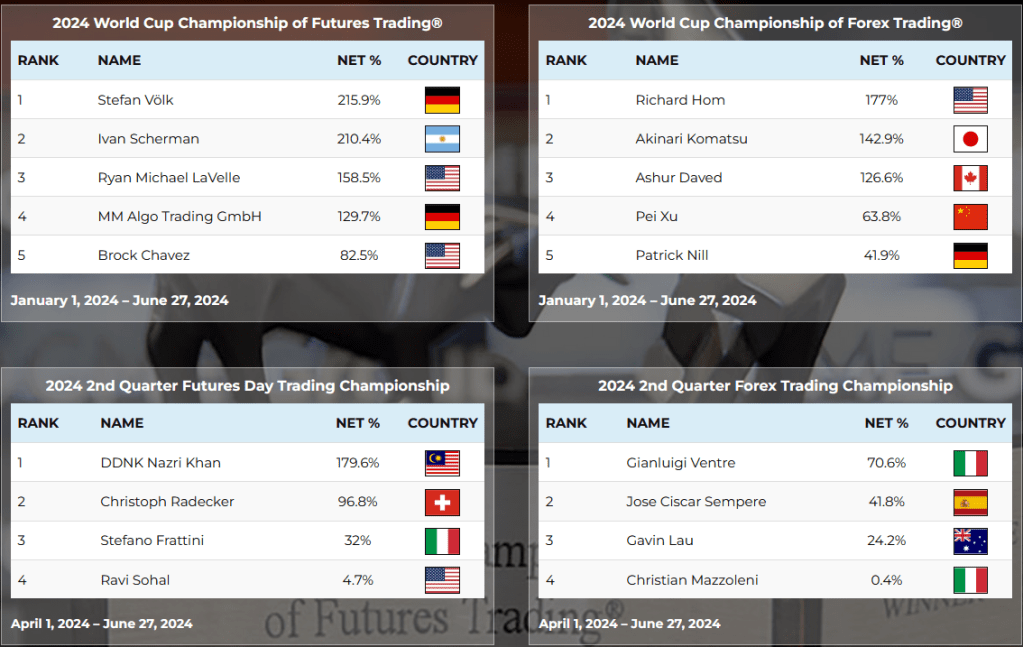
After a 60% month, I am so close to taking the lead that I can almost feel the detest of it.