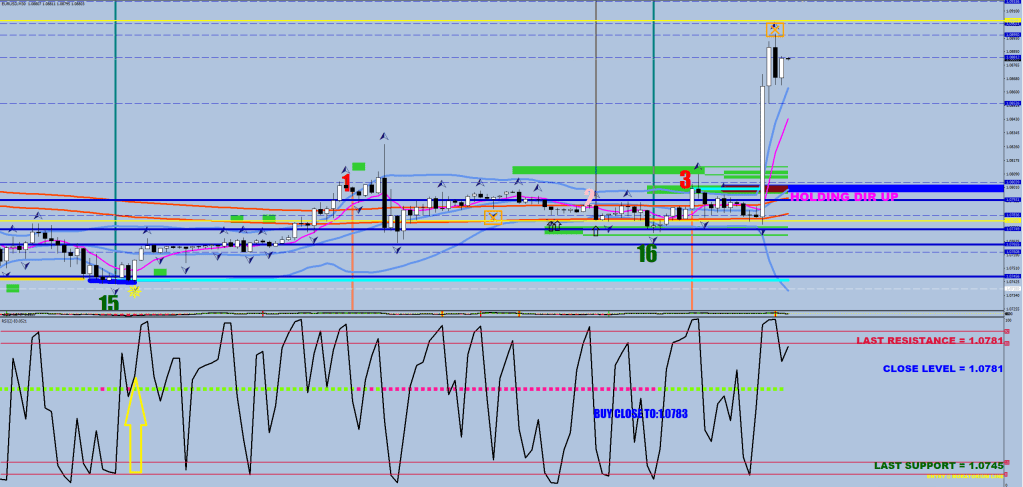
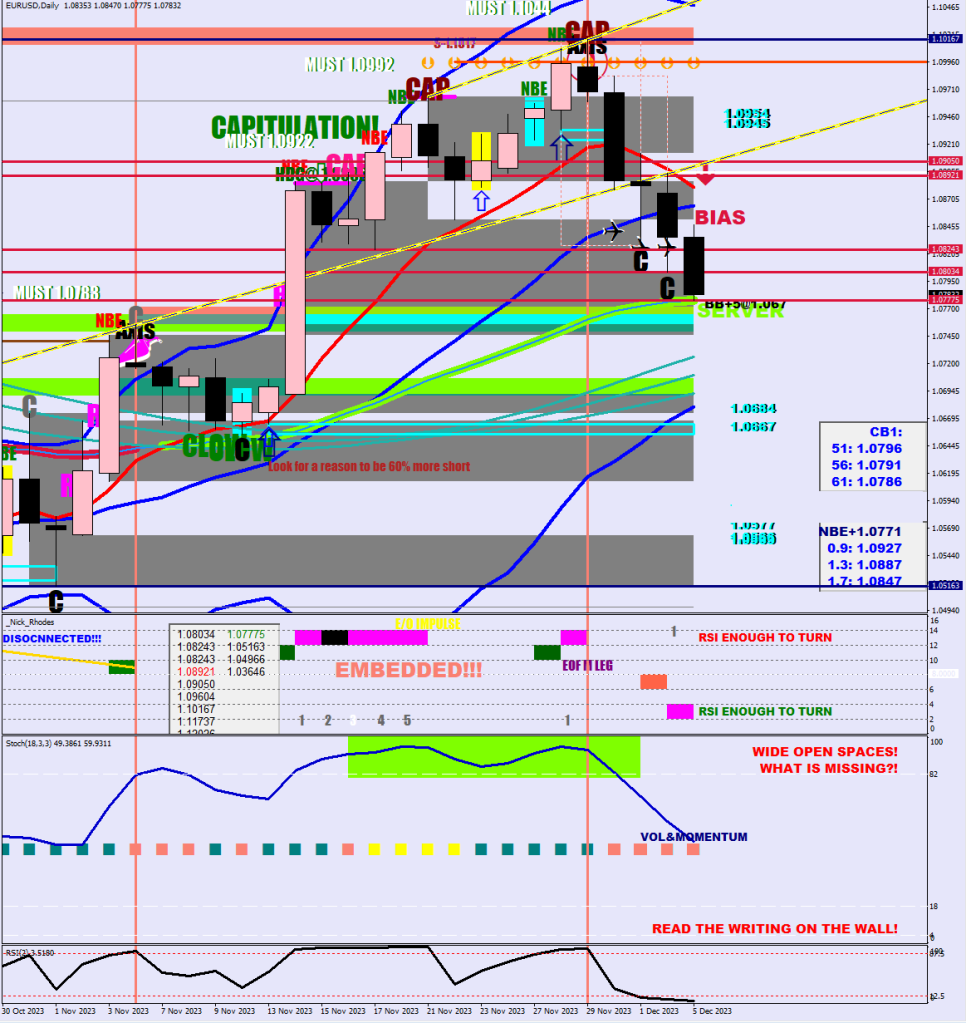
I was gonna talk about the 12-sample daily CI. Before the new, 5-wave move would start, the energy level would have to reach an XX condition, which is 59 or more.
The market had 2 more days after today to get to this level. Imagine that 2 candles drop off the sample, and you are around the close marked by the blue arrow. You just managed the necessary extra high read.
Where do we go from here then? I would think that price would be back here by the expiration. A down move and back up. 2x 24 hours.
The move was a “200”. It is a break out beyond 180. Currently does not look like it is going to manage the close this time around.
F2 is now at 1.0833. I would buy that for the opex. Could we swing out in the opposite direction 70 pips first, then come back from there? Yes.
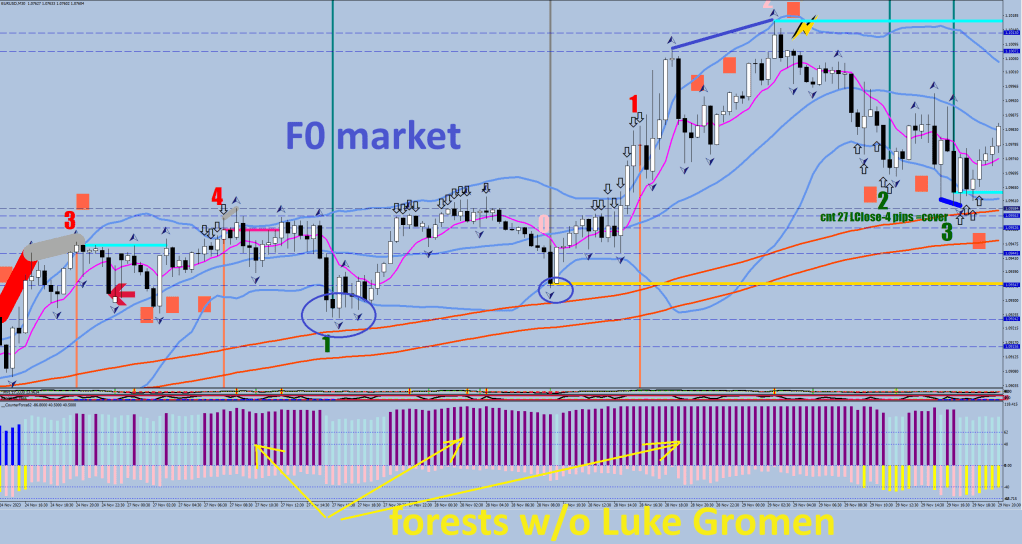
Somebody has been fixated on not letting the counter directional volatility beyond 62.5 pips since the 29th of November.
That last swing high was Red F2 on the red nose and so was 1.0817 one day earlier. Maybe somebody had a lot of capital and wanted to write their own CTA and also had a Dell Laptop.
Maybe their mind slipped a bit and blended in Bios with Bias.
Did I just figure out how the gamma negative options pegging works?
To show you how important that 62.5 pips number is, I could make an on screen plot for 200 sample low/high displacement, but I have already made a histogram routine, the Counterforce, all I need to do is to change the highlight level.
Something to think about for an auto trading edge. Also, why was the aswer to this 90?
Why is 30 the answer to the following:
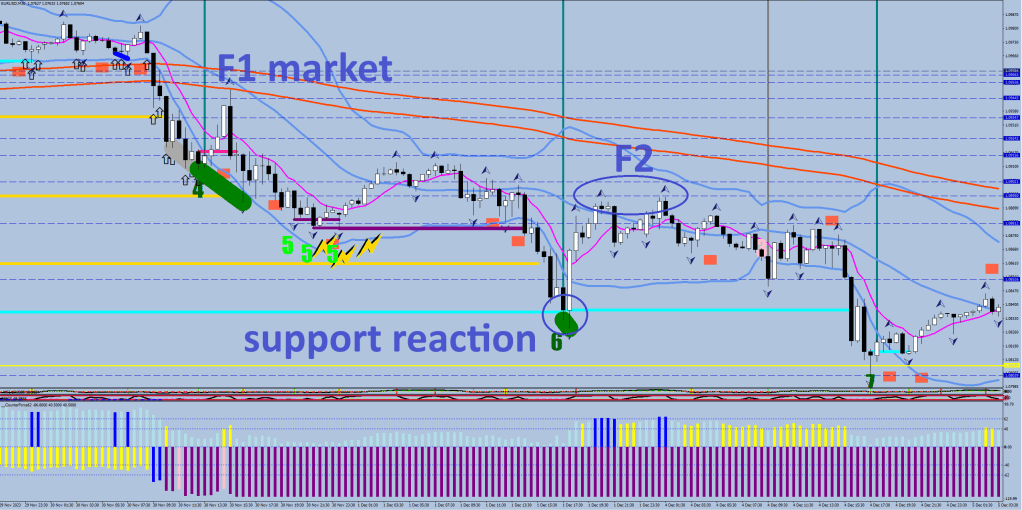
Are we in a volatility whip then? There is a one sided volatility cap, but the legs normally don’t last this many days. 2-4 days would sound normal, but 8 for the V’s single leg would be strange. The whips occur after the end of a 5-wave structure and they attack the last daily swing low / high.
This move down is a corrective wave. To print an “M” or measuring leg, a daily candle has to get outside the 30-sample BB. P stands for Push (eof Wave 3) and E means Echo (eof Wave 5).
Quickly about intelligence. It is mostly God given logical circuits, problem solving skills, you can round up your score during your first few years when you learn to communicate engage socially up to perhaps the age of 7. At least that seems to be the cut off for being able to learn all 14 Hungarian vowels. After that no amount of schooling or memorization would change your score.
With all that said, there is no guarantee that your high IQ does not go to waste. You can take my example or you can listen in on the example presented by Thoughty2.
One example that I have for different paths leading to the same conclusion is the 95-pips displacement.
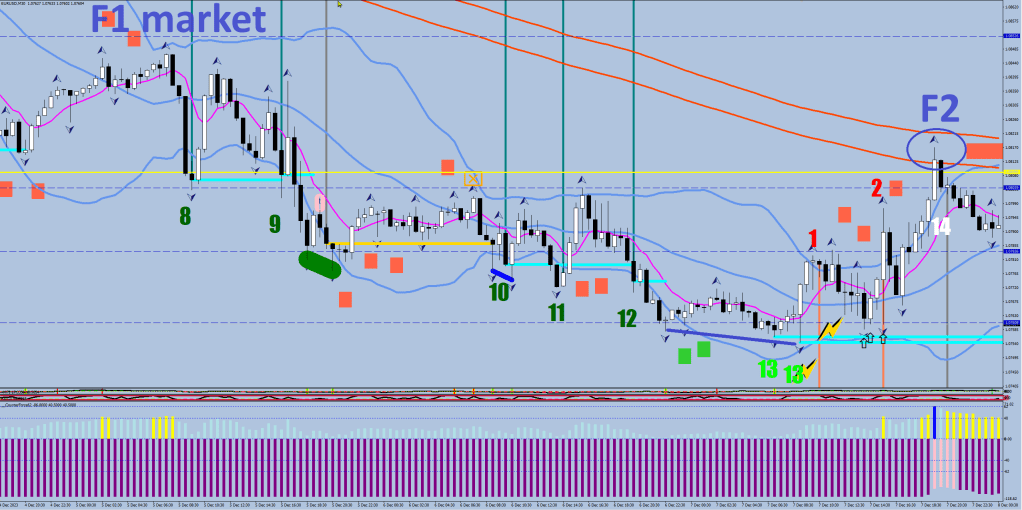
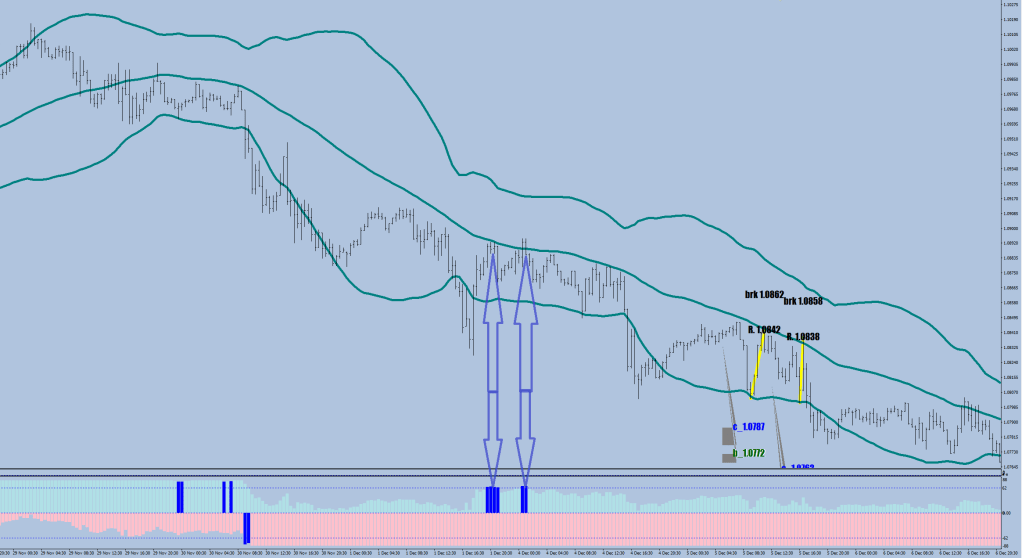
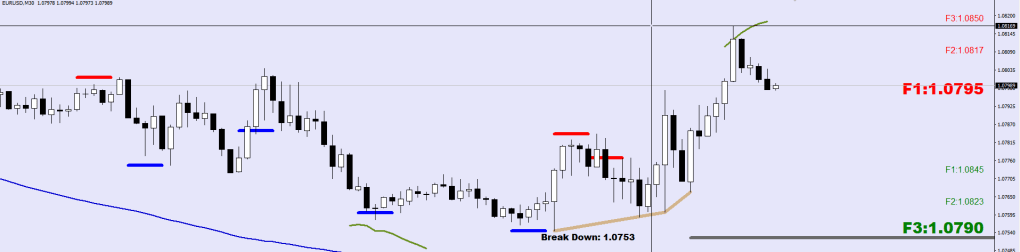
It is 95, because out of the 3 possible corrections, a liquidity break (usually a quick move) would be able to tag this before resuming in the actual market direction. The emphasis here is that I want the level to be hit. I use 180 samples (arbitrary) on the 30-minute to measure from ( see F3 – F for fade).
The 105-pips displacement I used for the puple brackets (dermia lines) have the thinking of a level I don’t want to be hit. Quasi 1.0860 may be beyond reach.
The dermia lines get adjusted relative to the consolidation mean. A new low sets the limit high and vice versa.
   dermia[i]=dermia[i+1];

   if (iFractals(symbol,0,MODE_LOWER,i) && Low[i]<taxi[i] && Low[i]<iLow(symbol,0,iLowest(symbol,0,MODE_LOW,90,i+1)))
      dermia[i]=Low[i]+1050*Point;

   if (iFractals(symbol,0,MODE_UPPER,i) && High[i]>taxi[i] && High[i]>iHigh(symbol,0,iHighest(symbol,0,MODE_HIGH,90,i+1)))
      dermia2[i]=High[i]-1050*Point;
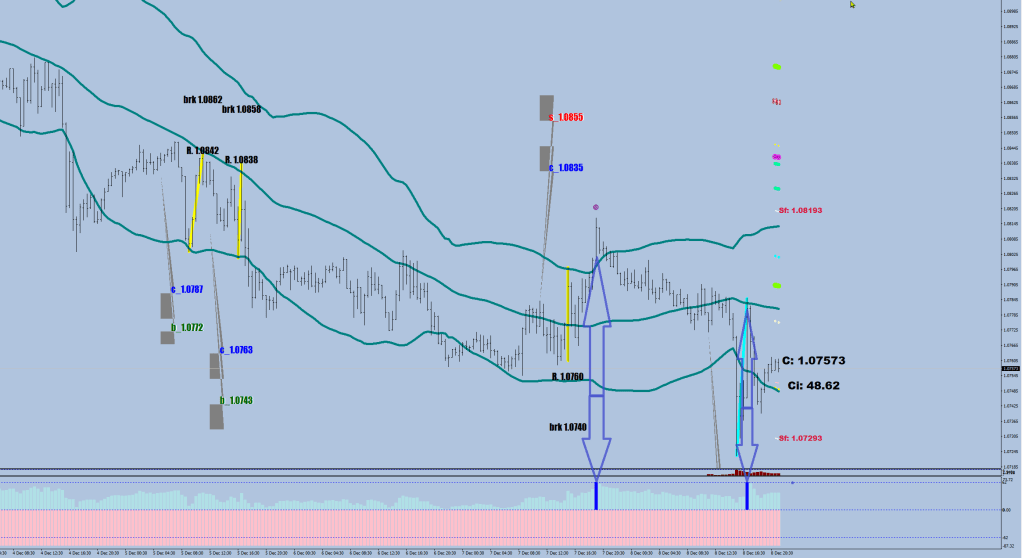
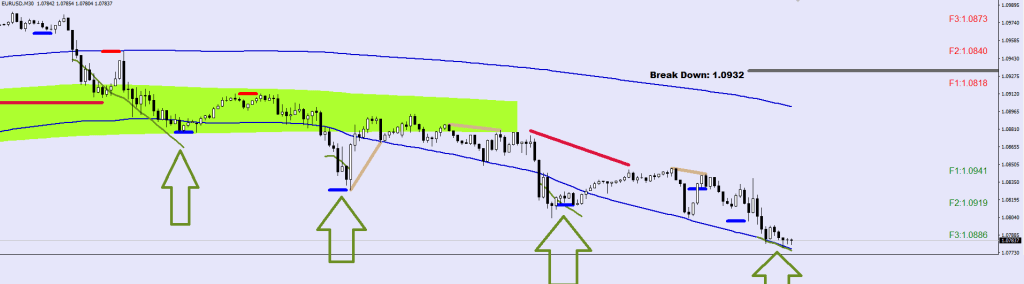
Since on the way down F1 and F2 served as regrouping levels, F3 would logically be the next one in line, so I set most of the longs to target (+5 pips for pushing my luck).
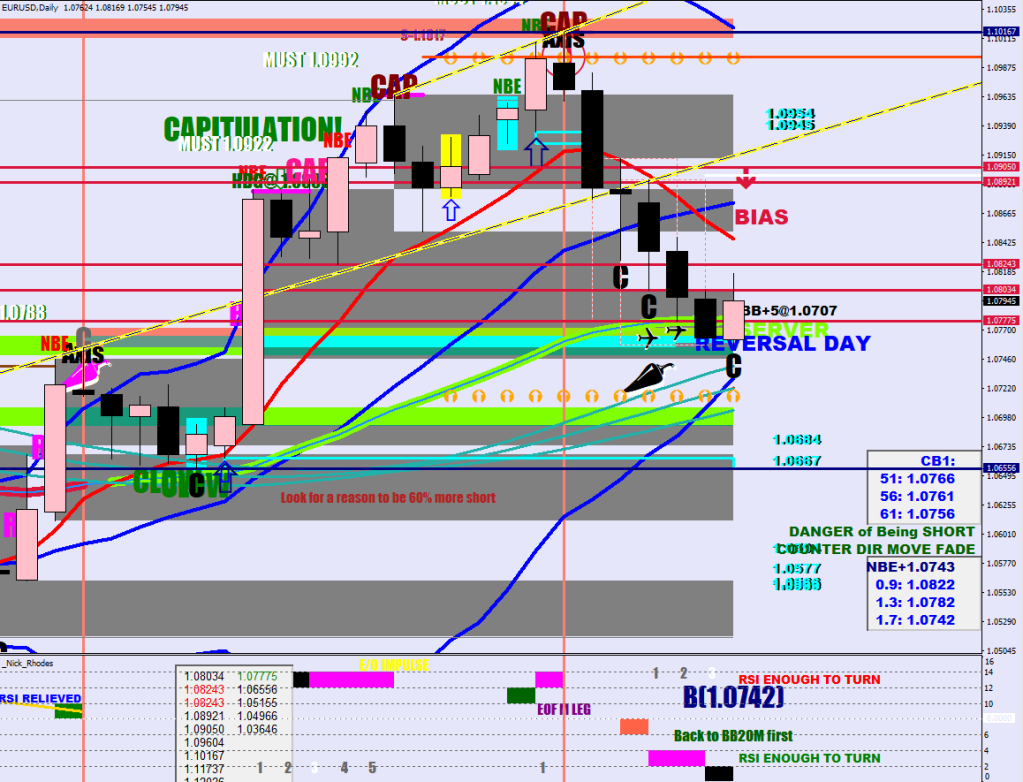
The Black Peter suggests a move up to the S20 first (currently at 1.0876), before a double bottom around 1.0742. Do you know anyone who can tell you the next 2 moves the market would make?
Learn to work with Money Flow Beat Reversals and Divergences, Final, Reversal, Continuation, Flash Gordon & Faith Healer.
Appreciate moving aveages. Remember that the market revolves around the 9-Day EMA or E-414 band on 30-minutes, a 3X plus stretch (of a divergent leg) is likely to trigger a mean reversion and also that 1X stretch (fluctuation maximum) is where they could stop and reverse a mean reversion progress.
Follow professional volume prints on Daily and Weekly charts. Pay attention to high volume churns on the Weekly, many of these would see their counter part come next Week.
Plot 30-sample HL2 BB.
Plot 15-pips outside the 60-sample HL2 BB to call a measuring / divergent leg.
Monitor your on balance holdings, be coscious of keeping not just the naked, but the total holdings low.
This much should get you to start trading in a sustainable manner until you figure out proper weighting and scaling.
Picture: 2 Flash Gordon divergences (a new 200-sample high / low fractal falling shy of the BB with a progression count above 1).
The train is starting, the engine’s humming, so get on board…
People, you are letting me down…
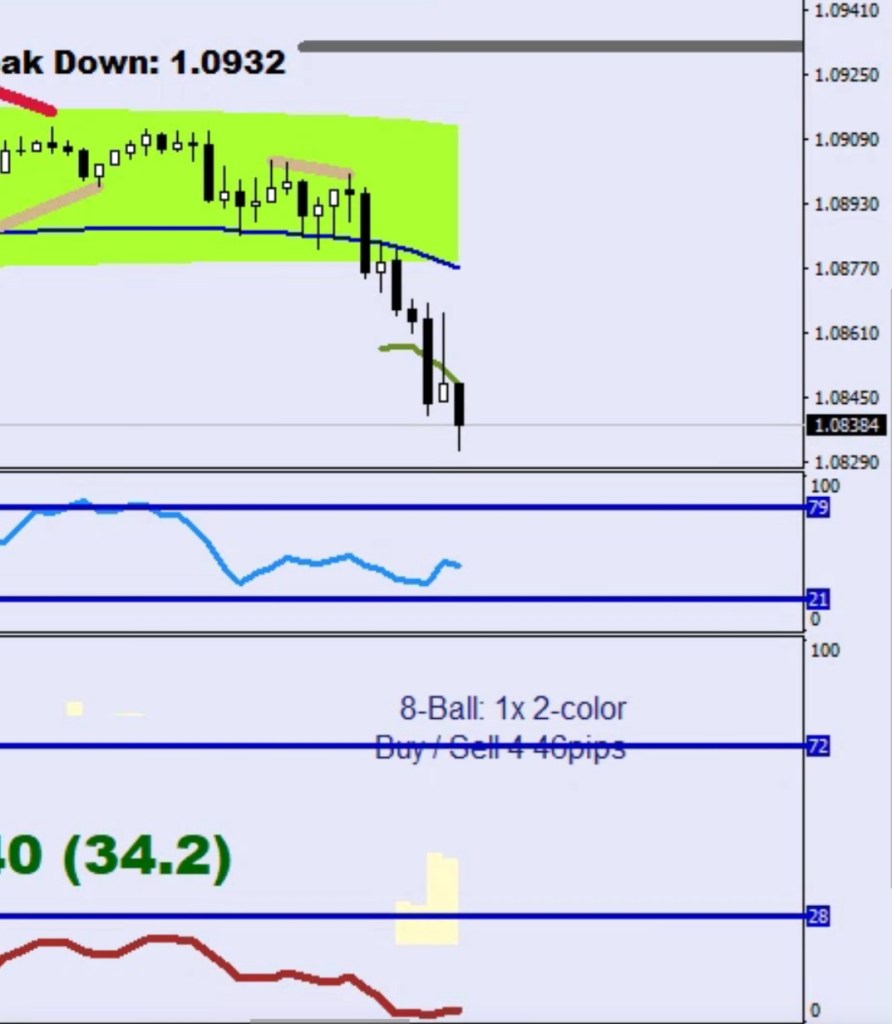
There was a pending final divergence until the second candle on the right took out the low.
There is a regression that’s just printed, and there is the Olive Drab.
The 4th in the row to be exact. Does the 4th score as well as a 2nd? I don’t know yet.
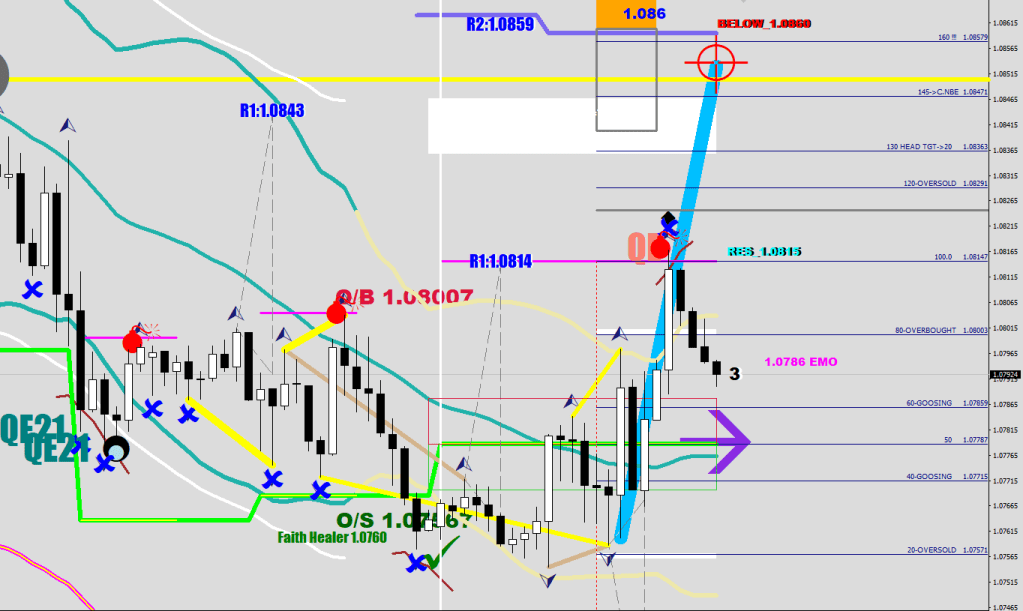
One thing is certain, the stochastic is in the middle of the range and the RSI2 is oversold enough for a bigger move up. Just hit Murena Williams (E-44 aka the Server) that is the defender of God, i.e. the 50 EMA, or the 20-sample smoothing of the E-44.
At some point even a ICT clown with their biggest fear of non-static levels must acknowledge that moving averages are there for a reason, even if they are doing the one thing a sea sick person is most afraid of: they are moving.
I figured out what MareWick was keep on showing with his ABC projections forward. It was baffling at first why think in a corrective structure when you are fishing for an impulse move.
Yes, I have been using the Measuring Leg – Divergent leg (also Push / Echo) as a cornerstone for a long time as you may know.
Of course, I have more answers yet again, more intimate with the works thanks to all I do.
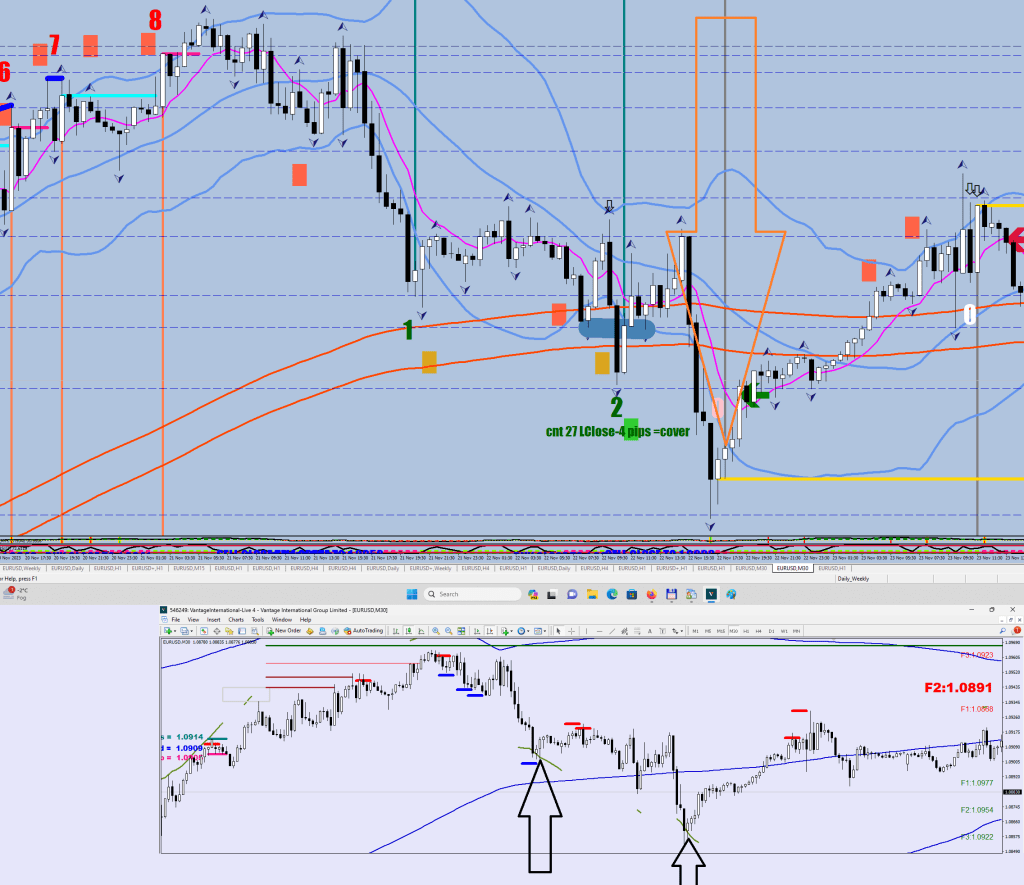
Olive Drab Encounter 1 & 2 example (added arrows, the routine is the Bouncer, see blog entry):
I said two things could turn price direction, the money flow droop and the final divergence. I know now that there’s a third thing, the title.
In this example the Olive Drab Regression sort of coincided with a money flow droop.
But the following one walked alone:
I knew I was keeping track of regressions for a reason.
Currently there is no regression print, a money flow droop or a final divergence to call a change of direction.
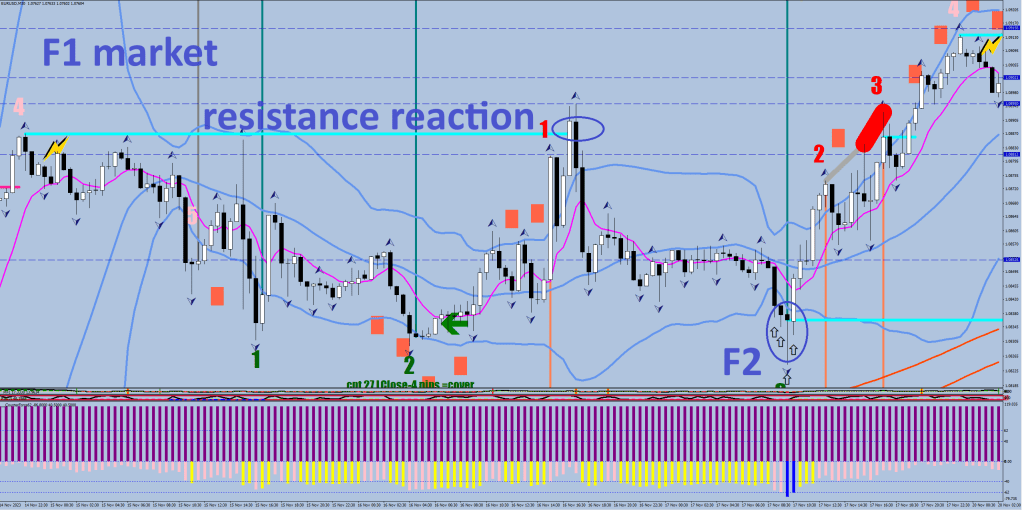
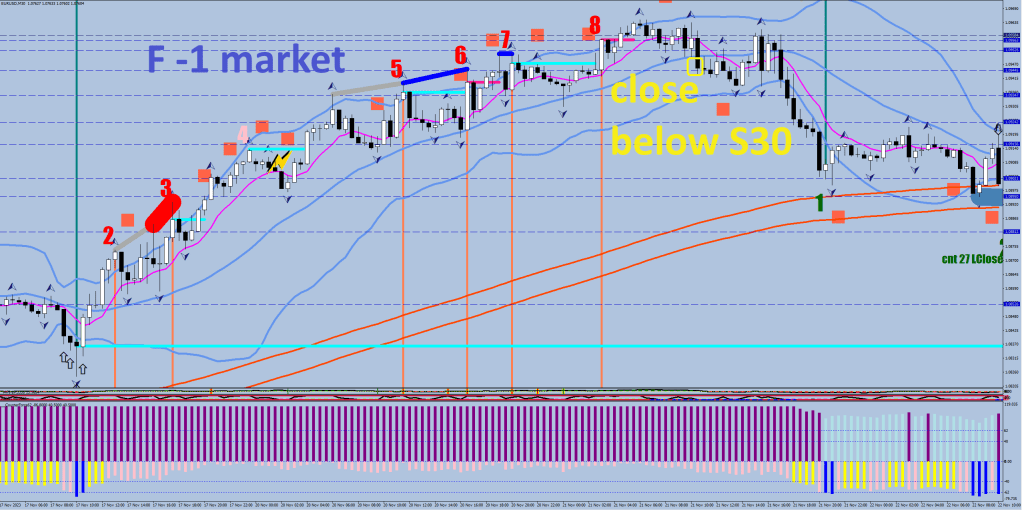
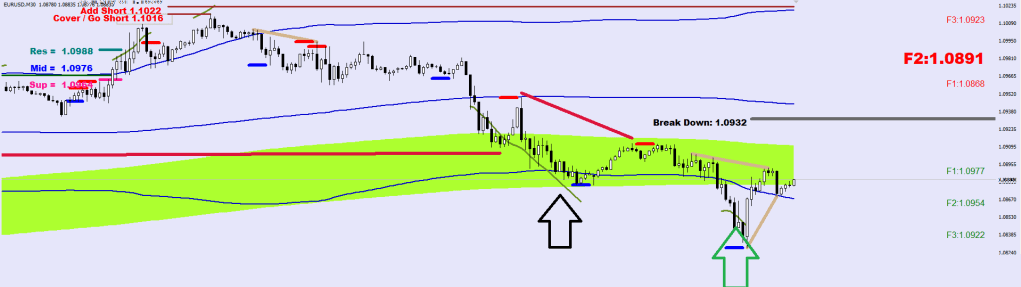
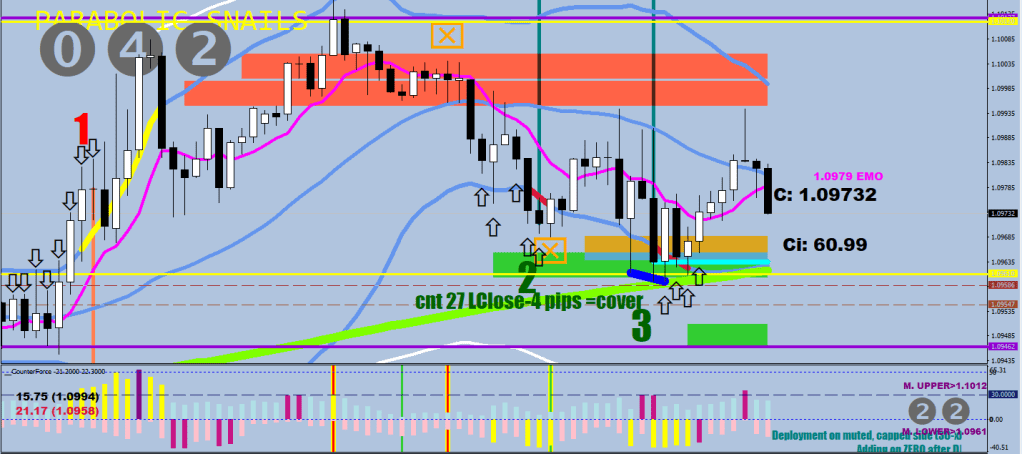
Image: the first 3 market defining candles gave us a level that was faked out later. The second 3 market defining candles gave us a level that was faked out later. Currently this is a range bound market.
I expect price to come back down to the pro volume candle, it could exceed it by a handful of pips to 50 pips to set up that higher low.
There are only 2 things that can cause the reversal of the market direction.
The first and main cause is the droop, the money flow extreme’s beat weakness – I have been discussing this thoroughly.
The second thing is the final divergence with good likelihood of making price reverse. This momentary lapse of reason if broken, gets called off.
All other conditions can only cause a temporary reaction. You are welcome to try to disprove me.
The winner candle is my idea for monitoring the divergence setting in in real time, albeit not every winner candle would lead to a final divergence: the measuring leg needs to have been made with a volatility breach. The final divergence is a volatility upgraded winner candle.
My new visual is a short, horizontal blue line.
I wanted the plot not to hinder the view, but point out the swing level.
What is my conclusion before Geromino Powell comes storming out on his tatanka?
Hey now,
You’ll need to have a second go at the Olive Lines’ breadsticks.
No final divergence, no money flow extreme yet. Flash Gordon reacting.
The daily candle is about to close back down by 25+ pips, the stochastic is to settle below 95.4% – optimal range for the turn, the RSI2 is strong enough to make the turn happen.
It should not be much longer before we see a 1.0875 print.
A final divergence was printed? All the better, once broken, the brakes would be out of service for a while.
3rd touch on the Guard Rail as well.
Target 2 would be the bottom of the pro volume week, 1.0654.