The first thing to understsnd about money low is the ssmple size incompatibility.
30 minute w/ 14 sample is a match made in Devon. 4H w/14 also a very good combo. 1H w/14 is a terrible idea.
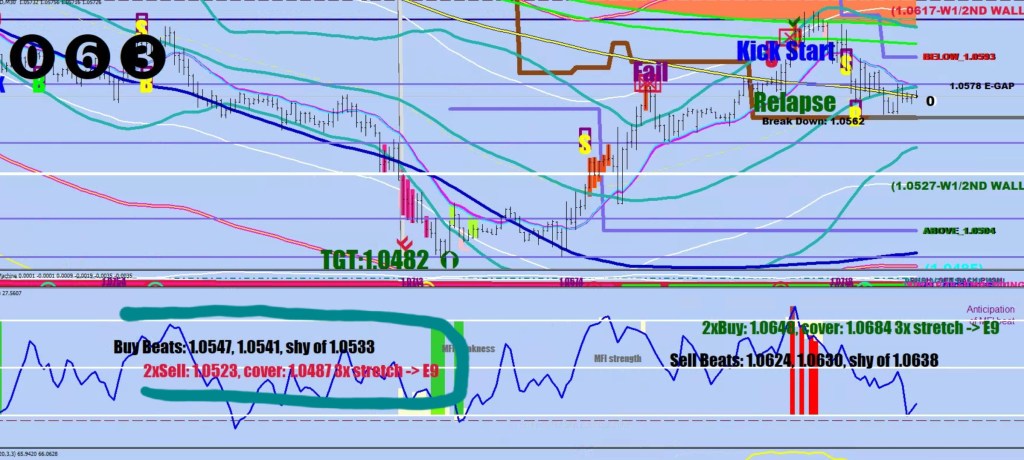
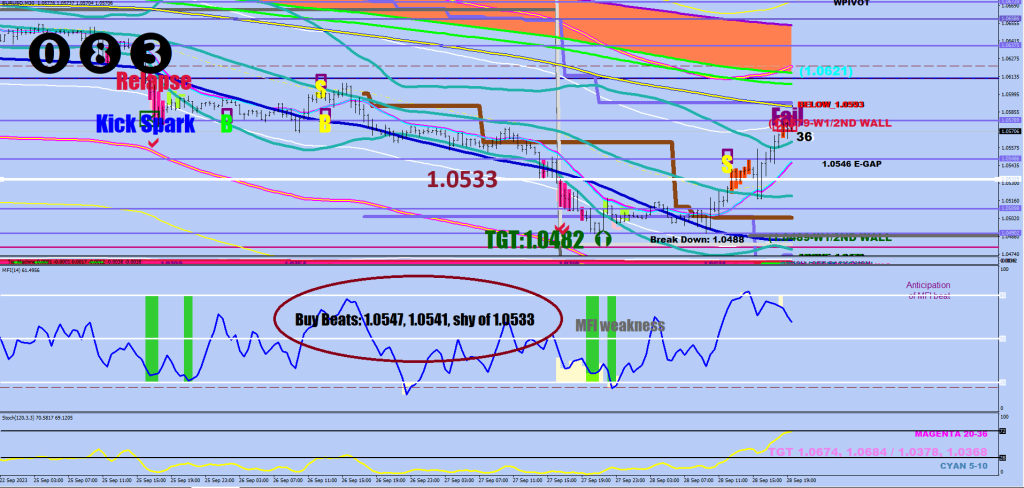
My 3rd, actively used signal The 8-ball is Money Flow pedal to metal. Kate, this one would be the easiest to replicate on other platforms, I promise.
mfi[i]<9 or mfi[i]>91
There is that insignificant remark on the right.
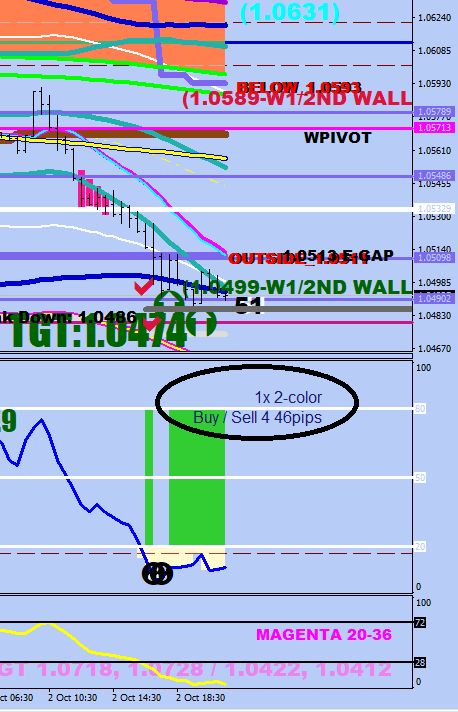
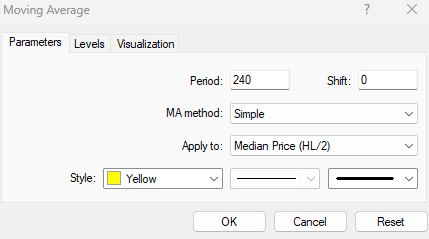
The meaning of the 2-color is mostly the S-240 HL2 on the 30-minute or it’s 2-SD displacement, the ground daddy E-712 HL2 (Purple) by itself, but at times the yellow component is the E-64 in combination with another MA.
As soon as they let go off the pedal that was extended fully, the vehicle slips back to one of the moving average combos, from where there should be at least 46 pips statistically to capture.
Examples:
The next one would clarify the 1x prefix.
The next one was good for 110 pips:
& this one did 97 in one breath:
I just realized that I managed to crop the 8-balls on the last images, but you get the point.
The whole thing was about peppering the S-240 with orders and aiming for 46-100 pips – currently at 1.05557.
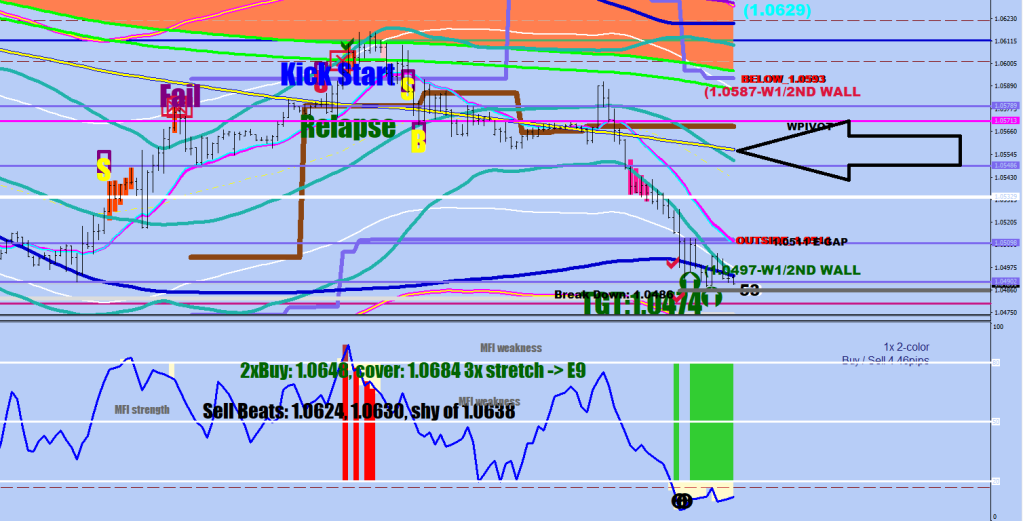
How did I come up with the 3 numbers? They are statistics based on the initial move. Since I wait 4 hours for the “initial move” to print, and the money flow itself runs with a delay, there is a good chance that the push already occurred by then and the echo can be predicted. Sort of. Barring no new money coming in during the move towards the echo.
So, where are you wrong? That’s a tricky one and is tied to your broker’s behaviour. You already should stop buying in our example by 1.0533, but you cannot just put a pending order out at that number. There’s usually a 3-pip slippage on top of the increased spread play for the broker to put you in a trade you will regret.
To be extra safe, go 10 more pips and only then double down in the opposite direction.
Blue lining.
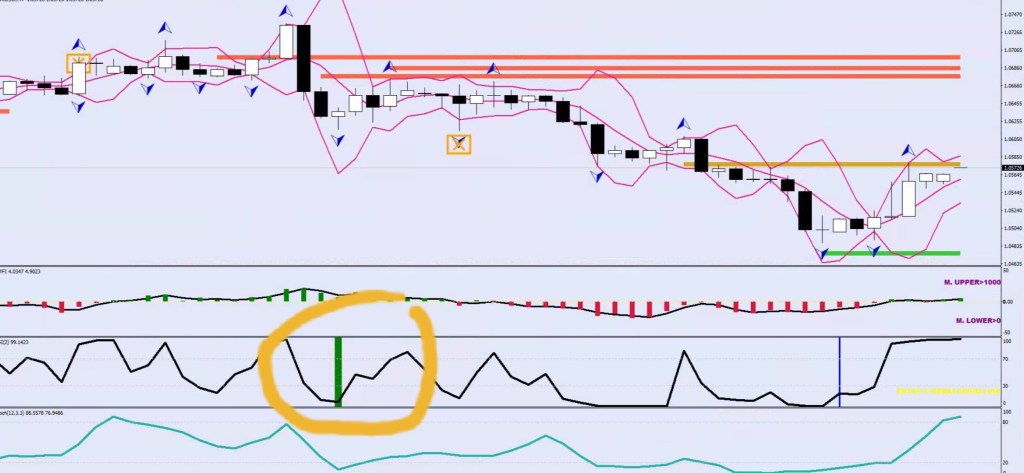
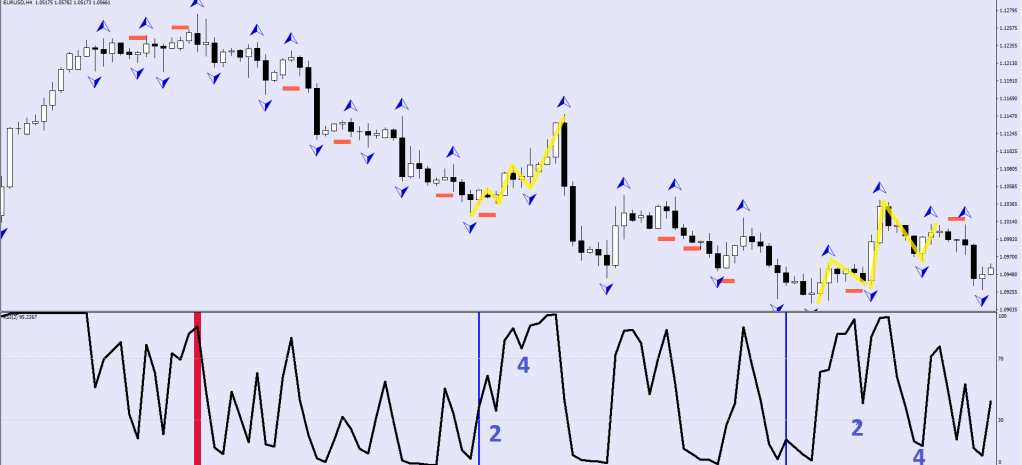
If there’s one thing that we learnt from Elliott Wave, it is that large corrections are made up 5 waves, hence he named them ABC corrections.
I had this idea of marking up the start of where a 5-wave correction is imminent.
A bit over optimized, but that’s what I have for now:
The only one that was on the iffier side was this rising wedge, since the RSI2 was too slow to register the Wave 2 blip in an articulate manner.
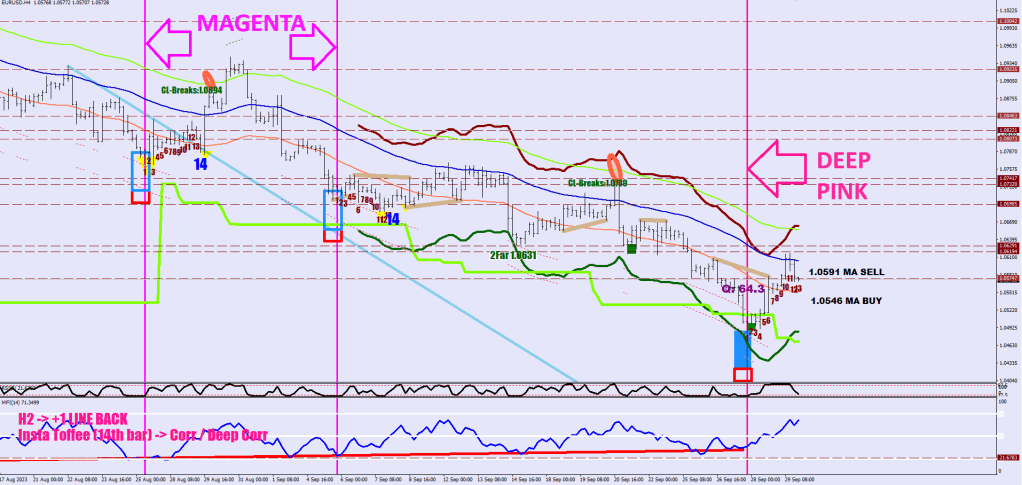
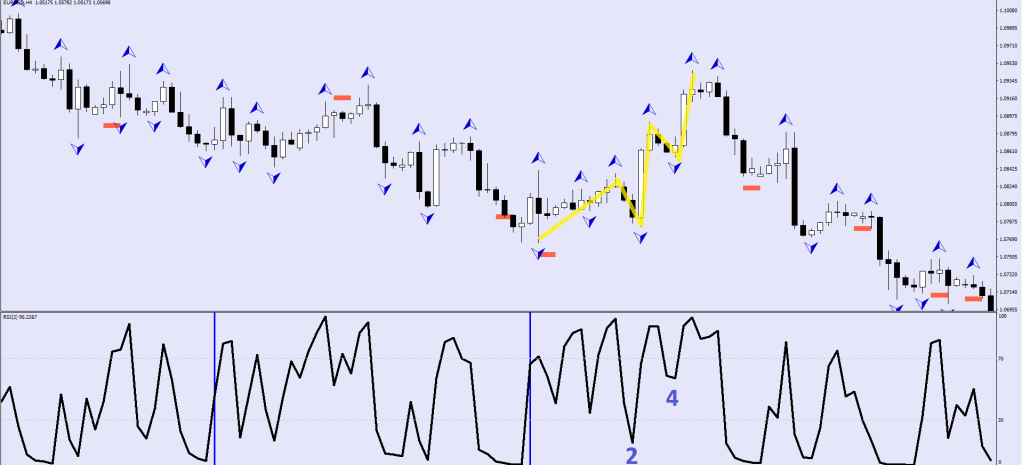
Other corrections visible from 4H space:
& when the brain begins to fault
As you can see, what I’m doing is not throwing shit on the wall. Far from it. I utilize statistics and mechanical awareness.
Unlike one size fits all charlatans selling 2k memberships, I have no products to sell and I am not even venturing to try the same things on a different Forex pair. Yes, I am a one trick horny.
These are the things I can get my head wrapped aound: lowest spread, lowest commission, highest liquidity, specalization – the ability to hedge apples with apples, the aforementioned statistics based indications, projections, some automatization and then you may have a fleeting chance of making it.
I don’t think anyone has picked this exact route before me.
Solving this today gave me a warm feeling. Like it was an ad for looking for people with similar thinking. You know that this was made by a human being understanding things about the human abstract thinking. The best part was not giving a hint on how to go about this. Very impressed.
Anyways, the magic ball from yesterday didn’t settle.
Yet, now we have a black ball for final. 55 points for that one. 135% you say? Yes, it is that certain that this is the bottom and no further progress downwards would be made.
Now, on to the terms and conditions part.
You must obtain an understanding of inertia.
Money flowing in causes an acceleration in one direction or another. The market is unable to turn on a dime. Instead it turns on money flow beat divergences.
That’s the money flow caused acceleration and these are the beats.
So when I say wheey-whey, whey you know where the wheat protein is.
The low being in was at 80% (40+20+20) until now. You need 95 to get serious about a reversal.
The Wave structure as follows: the Volatility Whip just took out the swing low made by Wave 4 at 1.0630. The W leg could go back to the upper red trendline.
I would equalize the short and long holdings in the 1.0892-1.0905 area.
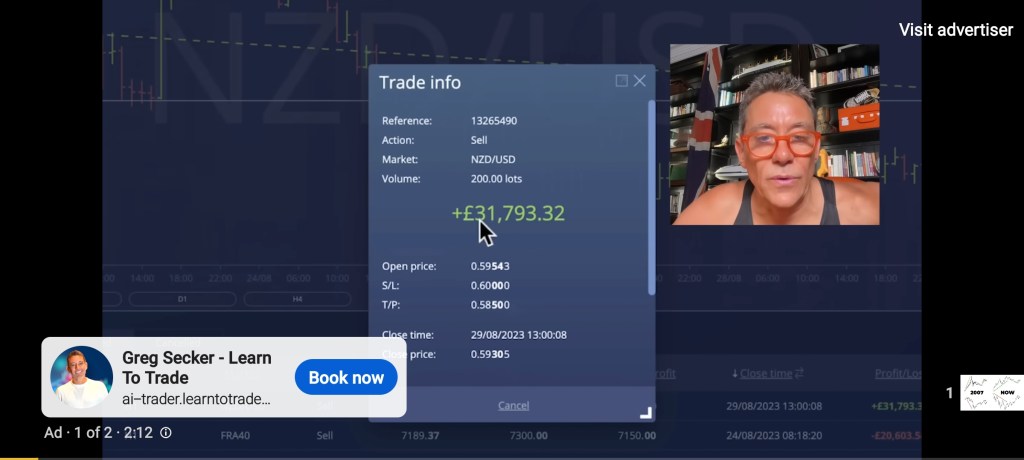
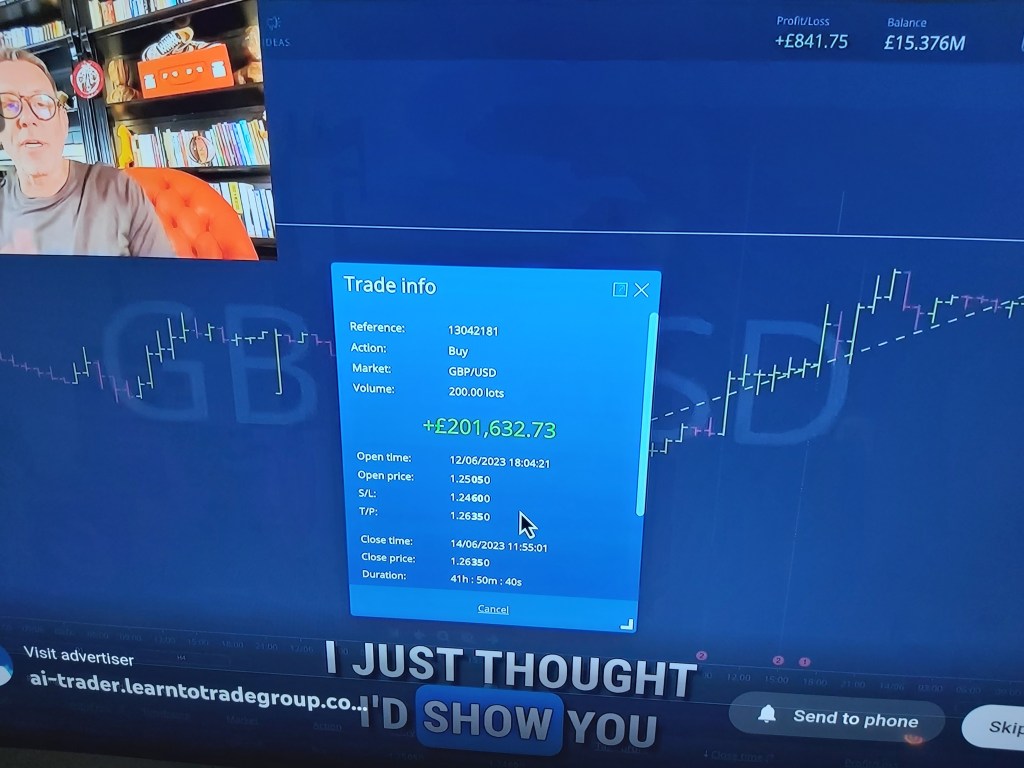
How can I say with certainty that the 200-lot trades are made on demo accounts, quasi they are fake?
First thing is the size of a broker. A small one may limit the opening on a real account to 50 lots per trade. I have a medium size broker, and their limit is 100 pips. Squared Financial had a 2000 lot limit, but they classify themselves as liquidity provider, the max leverage is 300:1 and you would not qualify as a person for an account, guaranteed.
When a scammer specimen shows you 200k made with a 32-pip move, think about what account could sustain such trade even with a 1:1 risk?
Looks like now he’s making a move into the funded account scam world. Seems like nothing’s ever enough, the horses must be costing a lot.
I will make a snapshot of the claimed 200k demo profit on Cable when I see it next, in particular because the numbers don’t add up either. With 200 lots you would need 100 pips, not 32.
Price does not even have to move for you to be stopped out for a 32-pip loss, it is enough if the broker cranks up the spread real high.
What person can afford an istant 200k loss whenever the broker feels frisky?
What kind of money would you have to trust on an offshore broker to not immediately give up on trading? Who in their right mind with 2 million dollars would shovel that in for the riskiest of ventures? The broker would just disappear with your money. They would not even have to leave the island they are on. Come after them if you can. Your lead is a guy named Mark.
There is only one guy out there that seems to be doing fine trading 200-lot blocks as Contract For Difference at 1:100 leverage and that is Trader Tom, but he is the kind of guy that wold come out of the dildo shop disappointed, but then he would spot a lamp post. Trust me, his losses are outsized as well.
Remember what I said about 200 lots, and then look at these brain trusts again:
Have a rectally safe day!
After a 200K trade, the daily profit/loss (up right) shows +£841.75 and the balance is £15.376 Million. Any questions?
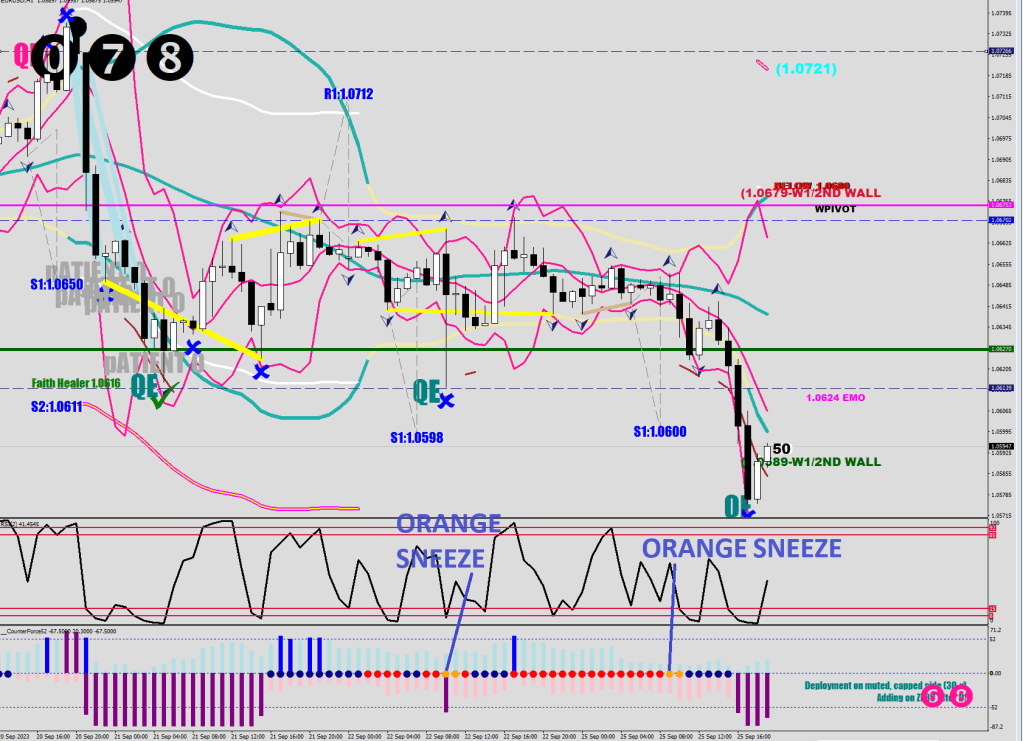
Now, the TA. The 0 got closed below 4x and got a back test from below. That’s the Hijack function where the Zero gets broken, not the Aggression. Then comes wave count to the downside.
Step outside 1x, 2x, 3x a lady.
Look, Lionel, since the last swing that came off of the Recoil point (move back beyond the 8EMO) exceeded 60 pips, we consider this to have gone parabolic. No more need of 3 breaks outside the 30-sample BB.
As for the 4H money flow reversal signal, as it turns out that hijacking becomes priority. Something to remember. It’s a sucker’s game after all.
No excuses for experimental incompetence. A Faith Healer can be broken. A QE+QE meant only 40% chance for the low being in.
My stubbornness resulted in a few k-s of opportunity cost.
The devil is in the retail – always said so. I actually had someone calling me “The Freshly Shaven Devil”. He was later taken to custody in Canada at a trafic stop and was handed back over to Hungary over an outstanding warrant.
It seems that all Orange Sneezes would always discharge away from the daily E9 (The Green River).
hey yo, check dis dope ass beat out willie back in da muthafuckin house and i got my niggas da menace clan on dis one to help me out and we representin our god damn selves cuz how da fuck you gona tell me how to get to where i’m goin when you dont know where da fuck you goin man das da blind leadin da muthafuckin blind
I could’ve been a leader not a follower a coach not a balla I could’ve had progress i could’ve lived wit less stress but i took it upon myself and played da card i wuz delt thought about my self fuck everyone else and they said fuck me too but it was cool like that see my mission was paper chasin and puttin da hood aon da map now i’ve done been there done that took one step and dew back for da life i wuz takin wut da fuck wuz i thinkin should’v slowed it down but i wuz speedin and i wuz stuck with a code and niggas waitin around to see if i wuz gonna come up befo but i can fold like a bitch seen da chance to switch but i wuz brought up yo make it seen da chance to take it find a rule and break it take a badge and shake it and against all odds get da fuck outta dodge but I’m a nigga wit records dat da state can’t file young, blind, and wild an uncontrollable child in da ghetto but seddling fo mo everyday and when i make up my mind i’m gonna get back in line but now i’m [chorus x2]
blind leadin da blind in a world of wars i search for peace of mind my stabillity fo my niggas and me said da way life wuz supposed to be in da ghetto
I looked out my window wut did i see it wuz a crack head nigga starin dead at me he said can i get a muthafuckin nickle for three i told his ass to da better in his rorock swetta he got a daughter he aint fed her he’d rather get high in his eye i see da demon i can hear babies screamin feenin it demeaning to see him to be in the ghetto but this is where i settle now wut would you do wit a strap in yo hand gangstas do wut dey wunt to suckas do wut dey can my role modle sips on a forty botlle in his footsteps i follow grab da brew and take a swallow i’ve been livin on da streets since da age of thirteen cuz i wuz sick of being raised by a dope fiend i so seen babies need similac money dat wuz meant for similac wuz spent on crack now do you wanna no i dont and its a liquor sto on every cona and niggas aint da owna now listen, we cant afford to send our kids to school but dey got da knowledge to spend dey money on da chaps when we could send our kids to college now here we are: hoes, dopes, dealers, and bums at da white man’s table still beggin fo crumbs but its da [chorus x2]
niggas shoot ball (niggas shoot da logs) nigas shoot da doves (niggas shoot to love) niggas shoot up (niggas shoot pool) but watch out cuz niggas shoot niggas too so wut da fuck am i to do when niggas fallin down like flies and dis muthafuckin money starin me in da eyes and my brother sayin come on in stop buggin but we done already lost 3 uncles and 5 cousins to da streets niggas shit deep no room fo da maple leafs cuz muthafuckas play fo keep i wunt respect when i step on da field saw a nigga dat killed i gotta kill befo deez niggas get sum bright ideals and start thinkin we hoes or sumthin so when i see dat muthafucka nigga nigga staight dumpin
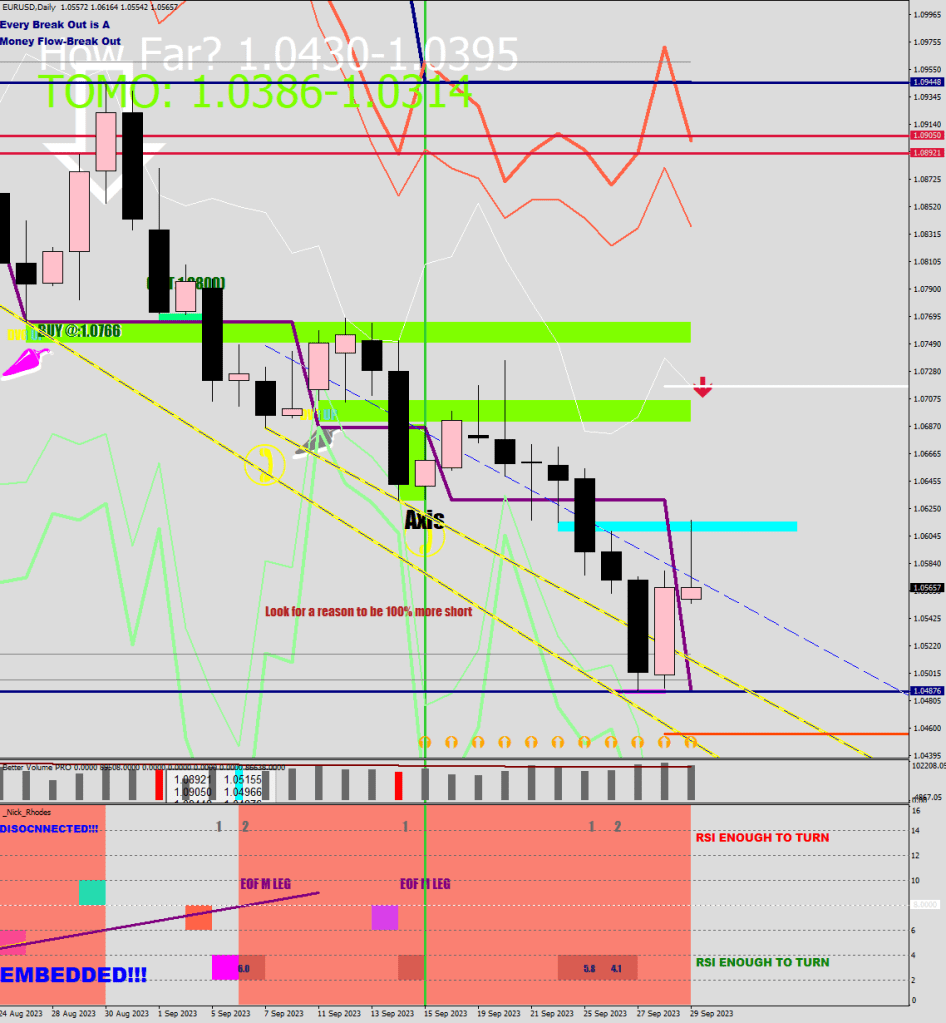
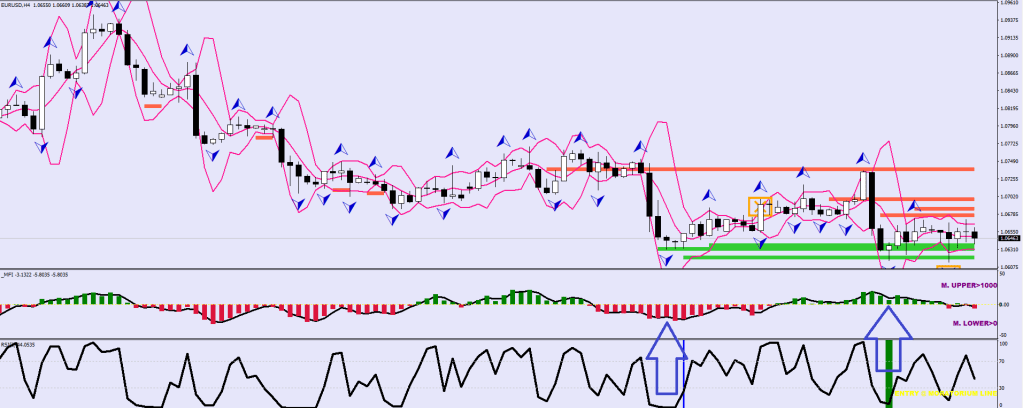
When dealing with indicators, there’s always the question, are you even looking for the right thing?
Nothing personal against Barry Taylor. In his latest video from 9:40 he talks about the Euro and he has no turning signals, none of the 3 he is using, i.e.: bullish divergence, exhaustion sell, flash pattern.
I have been having good success with Money Flow divergences / turn projections and this weekend I invented some 4H MFI plots.
The thick green below is a complete Wrap of Money Flow.
I believe this divegence is the equivalent of what was printed at the top.
And this seems like a really strong signal, not in terms of being an exact top or exact bottom, but from the view point of these points not getting exceeded for quite some time, they are the origin of a new money flow trending move.
Time will tell if was monitoring for the right signals.
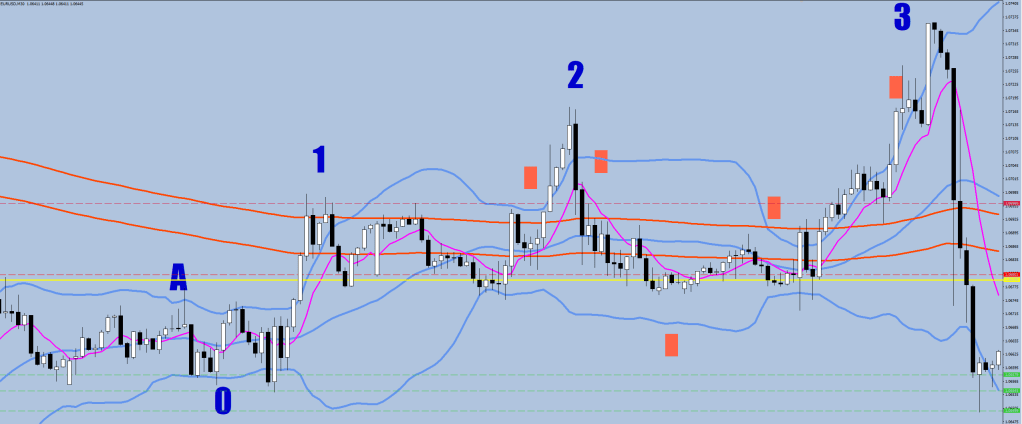
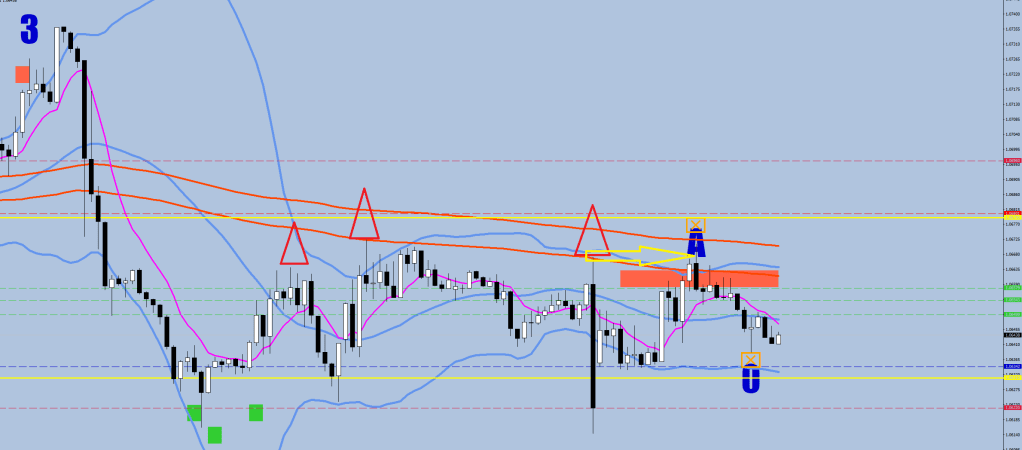
After a low is made, the fractal stage setting commences. There would have to be at least two hourly fractals before the market can try for a Wave 1.
The triangles are the fractals. Wave 1 up is the beat of the 2nd fractal down.
A = Aggression. 0 = Zero.
This is where the bull – bear show down takes place (The Clash). On the image above you can see that Zero gets back tested, but only one 30-minute close would be claimed. A break down failure. The bulls get to write a 3/60. This means 3 waves that breaks outside the 30-minute 30 sample Bollinger (or a single wave with a 60+ pips parabolic move from the recoil point.)
The 3rd Wave in this example had a 3-part sequence to it. See how there’s no multiple closes below the Magenta, 8 EMO – until it is too late. After the 3rd Wave the bears had the opportunity to carry on with the down trend.
Also, see how all the price action was taking place above the Aggression entry with the pullbacks bouncing off of the A. This is not a must, you could see higher lows as well.
Why am I teaching you all of this? Because a new low was just made. A Wave 1 took out the second fractal from above. A Zero is being printed. What should you be expecting next?