I had to find some uniquie icon for this whirlwind woman, Scarlet Johanssen.
I settled on the bellhop bell with the double meaning of “checking out”.
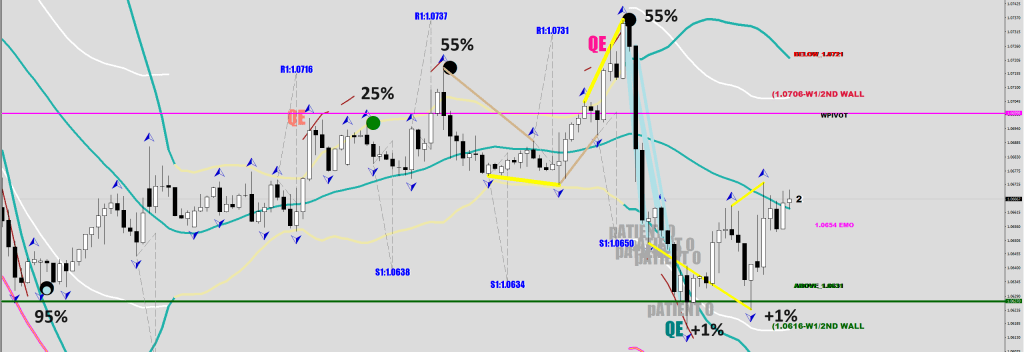
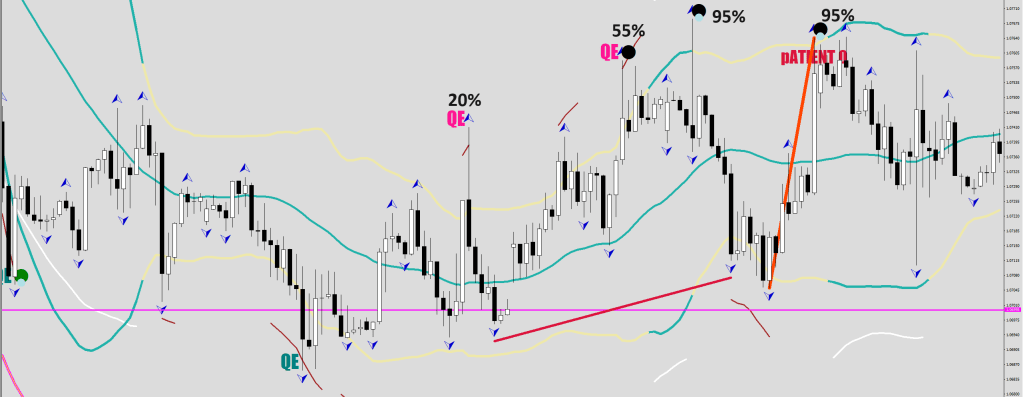
You see I was hot and heavy on associating percentages to my balls and other tangible conditions, i.e.: black ball 55%, green ball 25%, QE: 20%, magic ball 95%, liqudity re-visits 1% at a time, when I noticed a particularly peculiar divergence.
See I’m an RSI2 guy. A rare event is when a fractal prints and the RSI2 coasts further out on the next hourly print falls shy of following up.
I was firts thinking an S and an H combination, as in SHape SHifter pyromaniac paninaro, but a bell would do.
It was the music of Atomic. I looked it up & found some treasrure.
Topic: fractal evaluation.
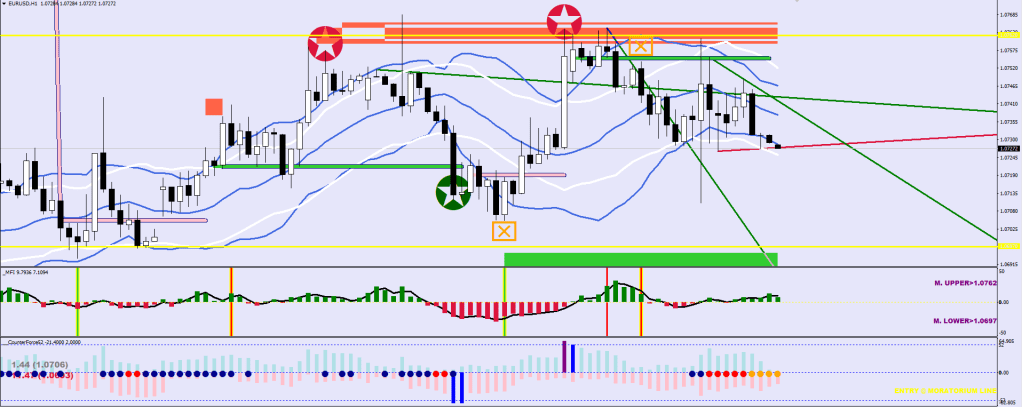
Black dot – reversal in progress / finished: hourly fractal at/outside the hourly 30 sample BB an LL or HH with the prior two candles being both bull or bear or the last candle was an inside print, i.e:
Green dot – retracement started: the last two candles do not fit the criteria for a black dot -> retracement to the 30 SMA / prior hourly fractal.
From here it is only half a step to figure a Qualified Exit condition.
I have no memory of selling my Amiga. Probably was too traumatic. The scene was pure overflow of creativity. People aspired, people did things. I applied with a demo group (Defcon One) as a graphics artist and sent them a bunch of logos and images. I was providing material for Terror News diskmag and also the IQ Depo. I held the only scrore greater than 1 million on Klondike. I grabbed a disk editor and transferred the Porsche from Test Drive 2 to Test Drive 1. All random stuff, all was worthwhile. We were gonna have our own future and not settle for second best.
Enlightenment. People did not know to spit or to swallow when I spoke about re-inventing the TTM wheel.
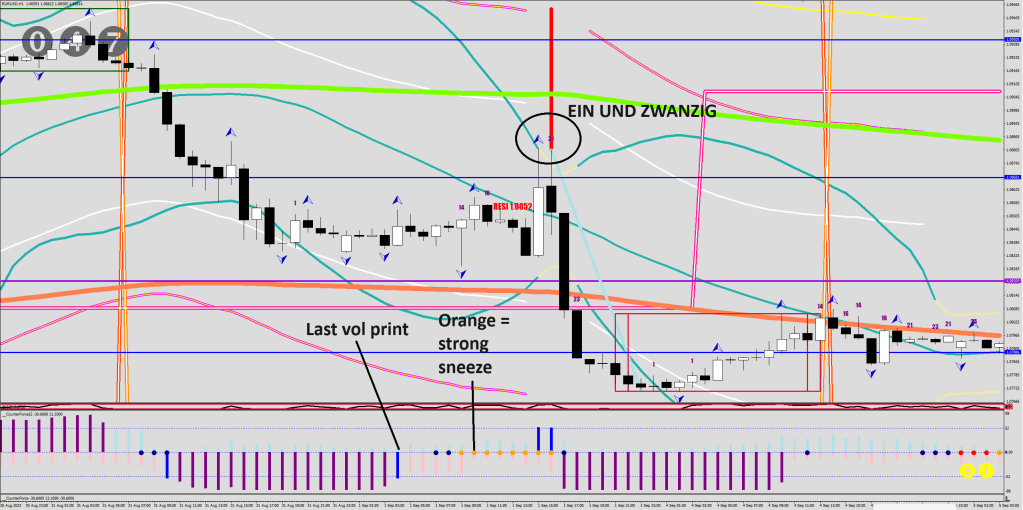
CounterForce52 with 18 sample is almost everything you would need on the hourly.
The last volatile print is the direction the sneeze is going to head to, and the timing knowledge obtained re: corrections can be well utilized. I’m talking of the 21 count.
See, the sneeze used to never come with a definite direction, it was merely called “continuation”. But the key is the volatility.
No volatility favors the bulls.
Which way is the next sneeze going to be disengaged to?
You need at least 2 hourly dots. Red or Orange. Ready or Not.
The sample size can be changed. I have 8, 12, 18 in use.
My idea of volatility is that it has a direction, a + or a – in front of it.
The dots were an after thought. A play on re-inventing Johannes Cartier’s TPM sneeze.
It is a bit of a challenge combining a histogram with arrow plots when zero is the lit value and EMPTY equals 2147483647 (0x7FFFFFFF). Had to go about it a different way and the displacement may be off depending on resolution / zoom.
They gave me 4 years, 3 more to go, keep chewing pretzels, time’s passing so slow.
Everyone is trying to guess the where of a continuation buy. Who cares about the when other than I?
What if I told you that the valley has the clock running at 2x speed?
Prevent horizon?
A snail has to be beauty and time conscious.
Inverse fair value gap SIBI mitigation? Nah.
Percentaggi? Ain’t that.
If you want your trading to become more of a smooth snailing, do the following:
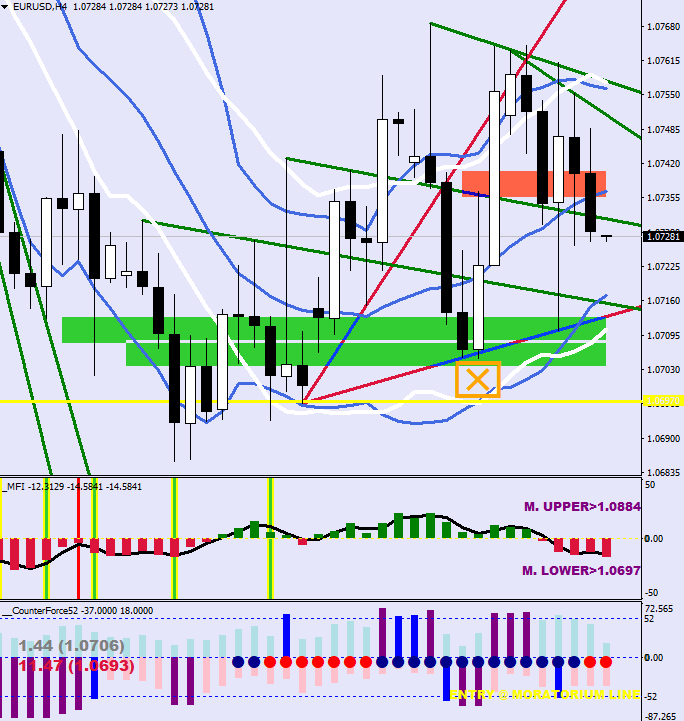
Have a 30-min 30 sampl BB HL2 to spot the 3rd volatility breach (start of correction).
Have a 60-min chart with the Green River (E207 High & Low) and the Guard Rails plotted for 1 fluctuation maximum distance marker, be conscious of the time zone and start counting the hours.
Loneliness: 14-16 hours. 7 inside the valley
Disregard: 21-23 hours. 10-11 inside the valley.
Occult Populism
God forbid someone coming along and start telling you that trading was reactive.
I used to like this guy, but this video killed it for me. A painful joke from begining to end.
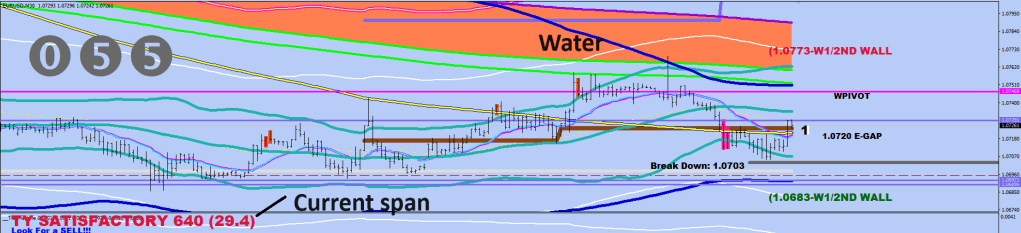
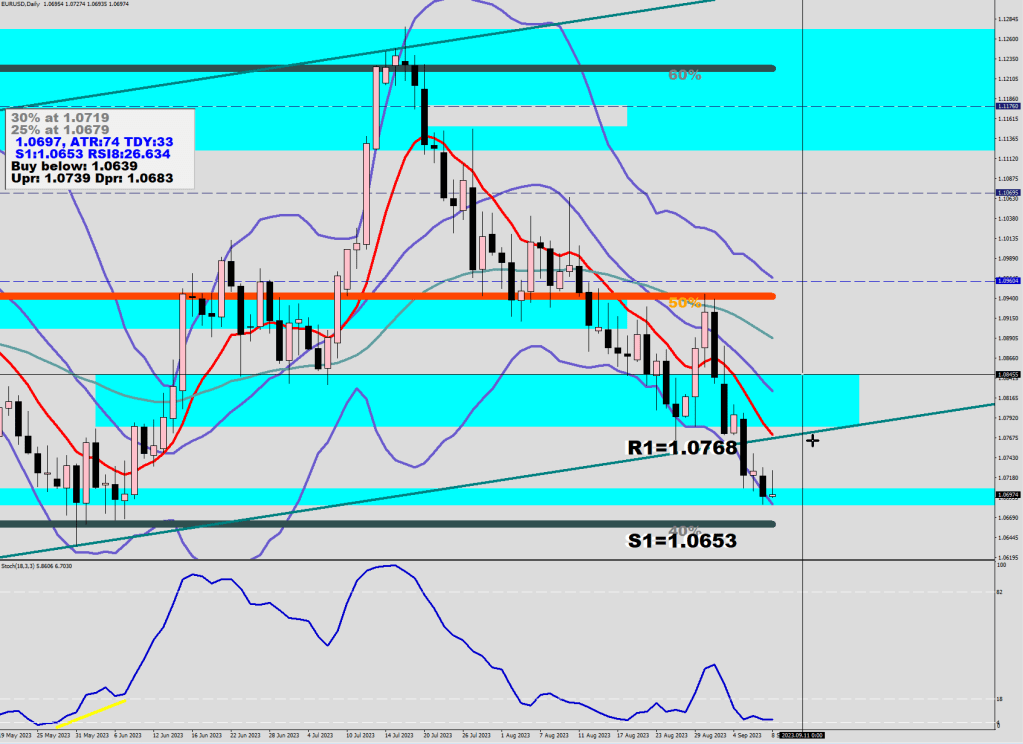
As you can see, there is no up, up and away from the bottom. There is a struggle to get higher. If there was a liquidity break, there could be a parabolic run up.
What are we waiting on? The water uo freeze over. It would do when the distance drops below 27 pips between the shores. This is a safety mechanism.
The fact that I have 0 followers has nothing to do with the fact that I do have the answers.
You have received 68 Bitcoins from a random address. What do you do?
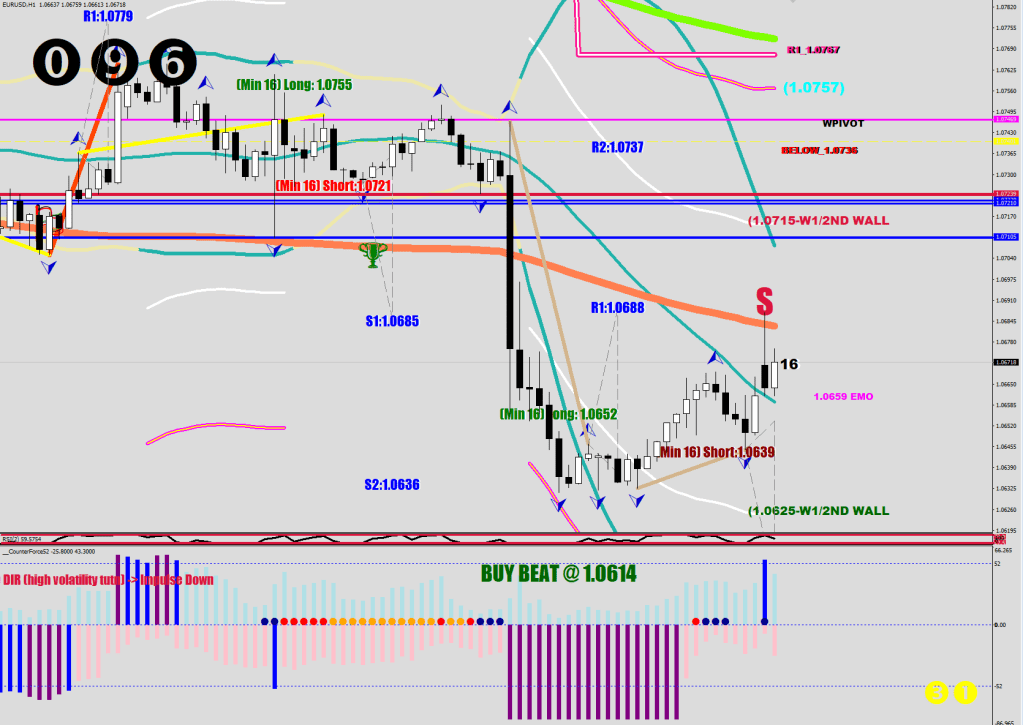
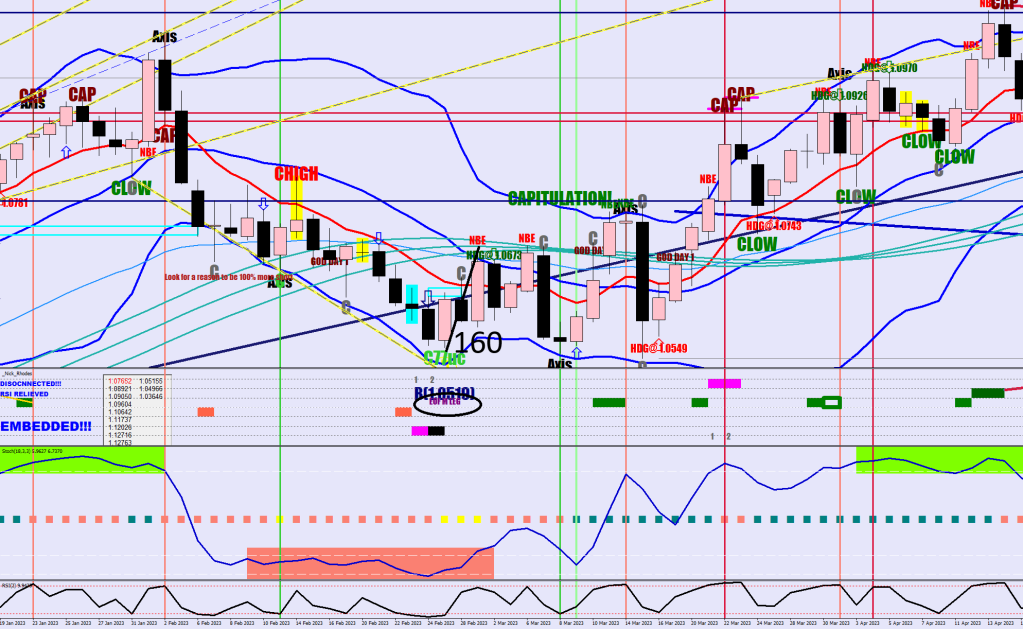
There was a lower low made for a black Nick Rhodes print, a close up and a 160-pip rally before the Beat was made. In fact this round trip was made twice with the second rally (the volatility whip’s V leg) touching the upper BB.
Diffrerences. Currently the lower BB is still being capacitated.
The downside stoch room difference between the two low close pro volume candles is huge. I would suggest that the pros dumped most of their holdings, but not all. The 160-pip rally would mean 1.0845 for the rebound. The script may still be valid, as the BB will continue to get closer every day.
Push and Echo go hand in hand, so does Measuring Leg and Divergent Leg, but I use the first two mainly on the daily and above whilst the latter pair on 4H and below.
Elliott, my no-good-for-nothing son! Sit up straight in my class.
For your Corrections exam you received a C. You even failed to name the 3 kinds of the corrections.
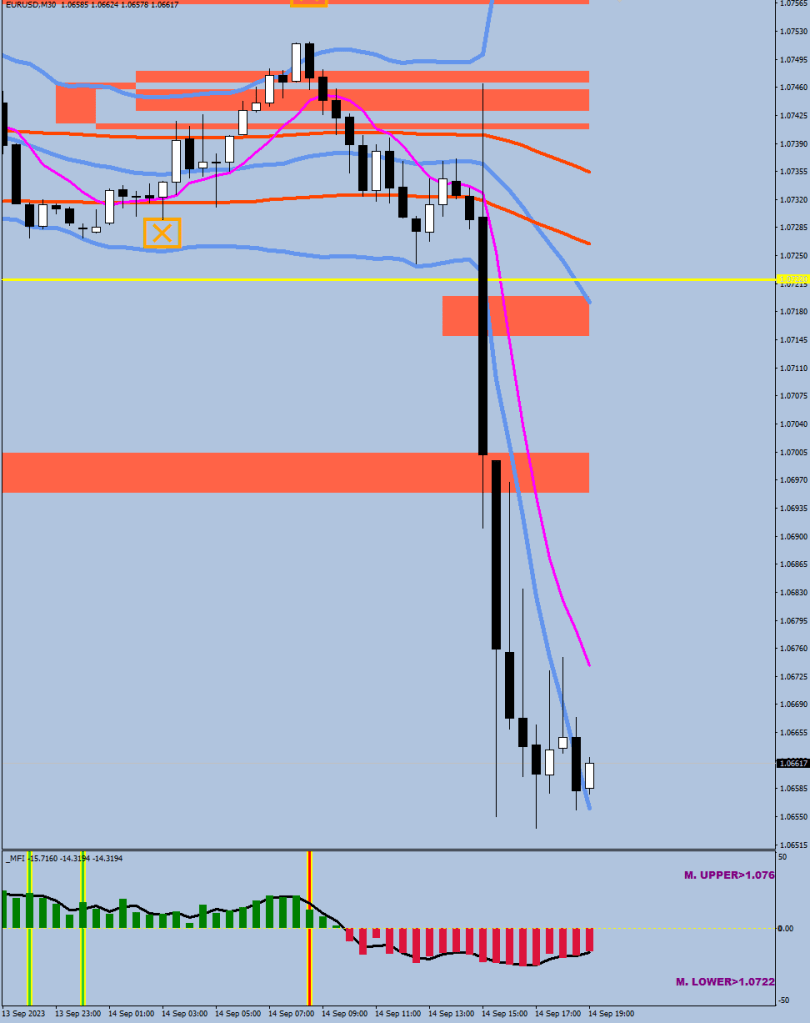
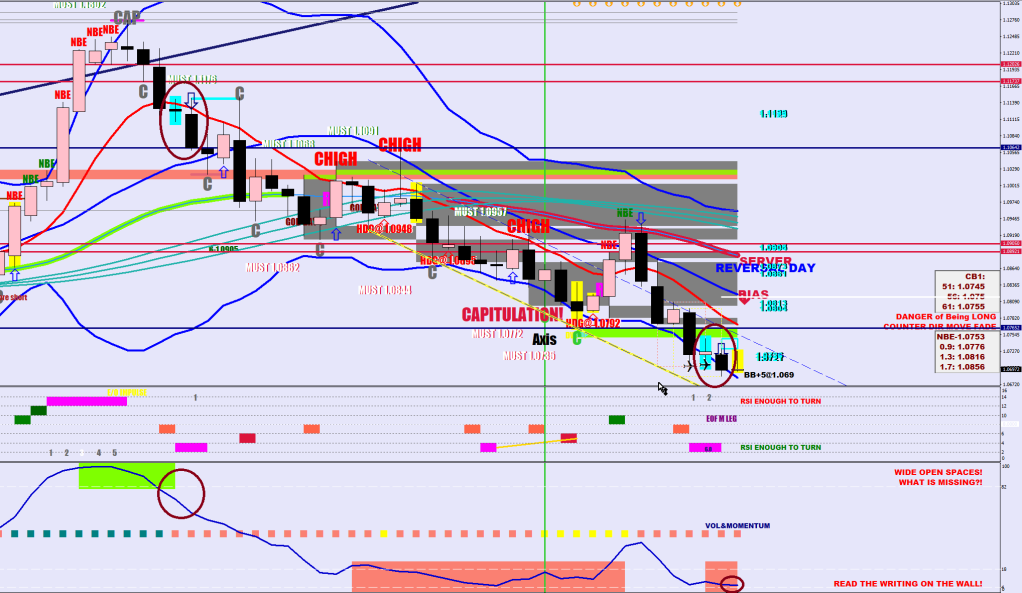
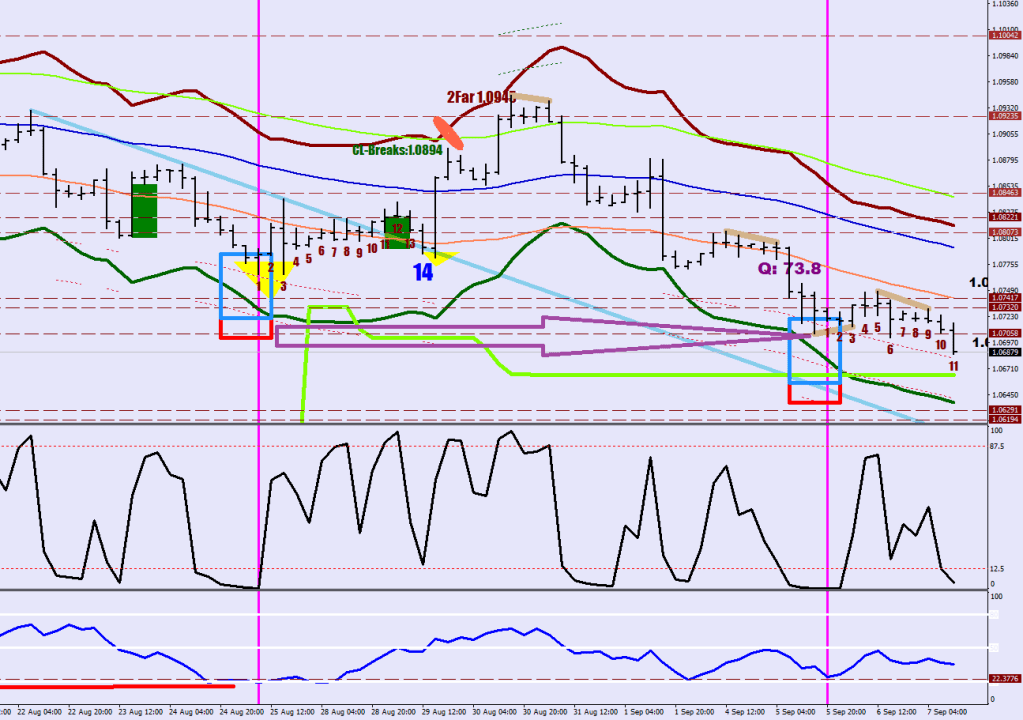
The loneliness correction likely occurs when the 30-sample hourly BBs are still expanding. The price only makes it to the other side of the S30 by the 14th, 16th hour. Example:
The disregard correction likely occurs when the 30-sample hourly BBs have stopped expanding and the correction reaches its peak at the 21st / 23rd hour, often breaching the upper band. The S30 often gets challenged before the 14th / 16th hour. Example:
The 3rd correction type is the Liquidity Break.
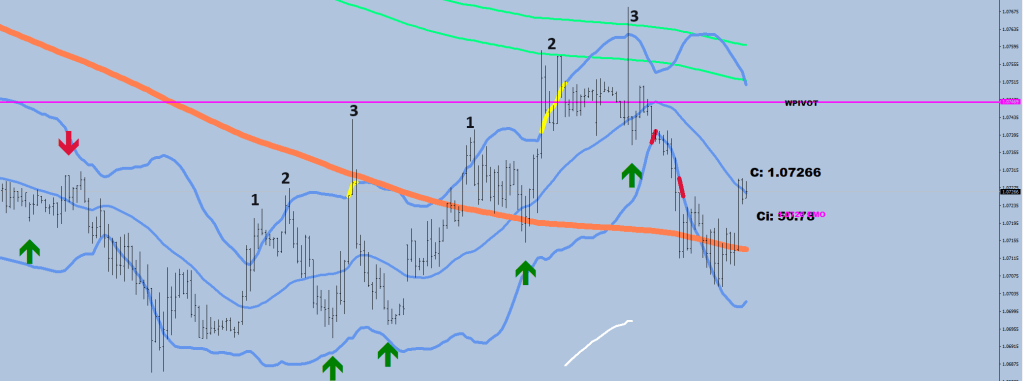
Image below: Loneliness or Disregard?
We use indicators because we don’t have X-ray vision. You cannot just eyeball a candle and determine that the hourly RSI2 was below 6, I start counting the hours of the correction here.
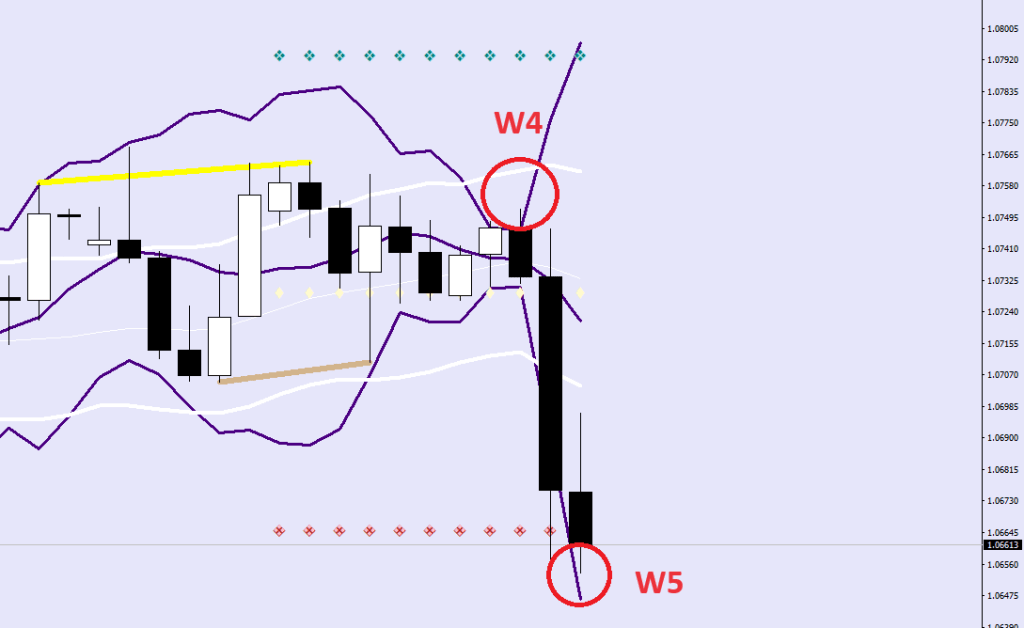
For Wave Structures, you got an F. The volatility whip is not part of the wave structure, thus no labelling required. Recent Vol Whips highlighted.
Wave absorption is an experimental field. Usually it is Wave 4 that gets absorbed throwing off the count. My suggestion is a 6-sample 3SD 4-hour BB to spot the breach during extreme compression of volatility.
Back to Ricky Gervais.
He is dancing with Seona tears in his eyes.
The Seona images are from brochures. My only criteria was that they were taken the same day, so this image did not qualify:
Nor did this:
These did.
These two below look exactly like my wife & kid. What a coincidence!
Viva La Republica
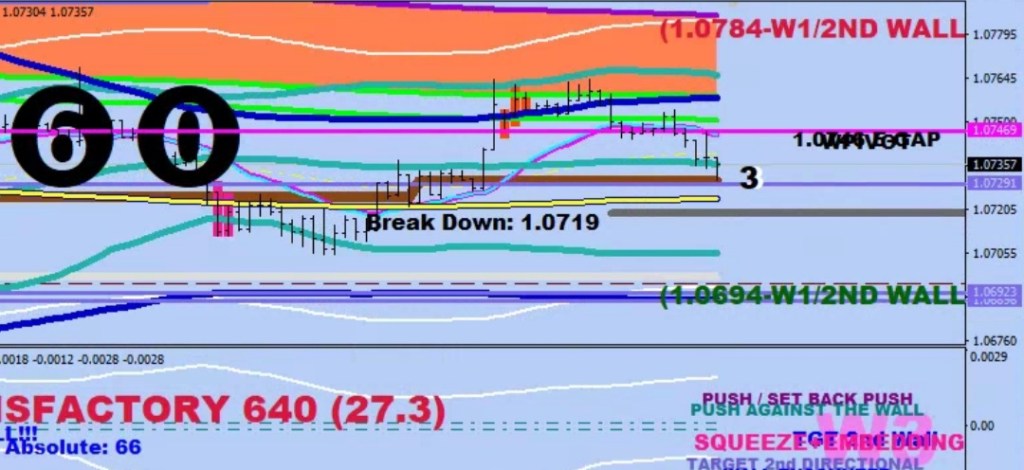
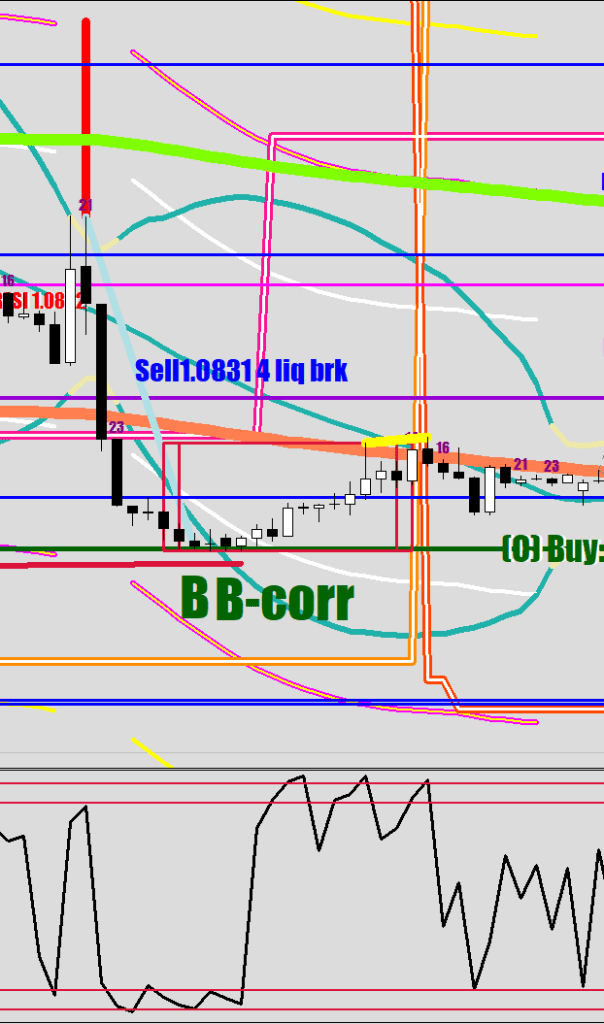
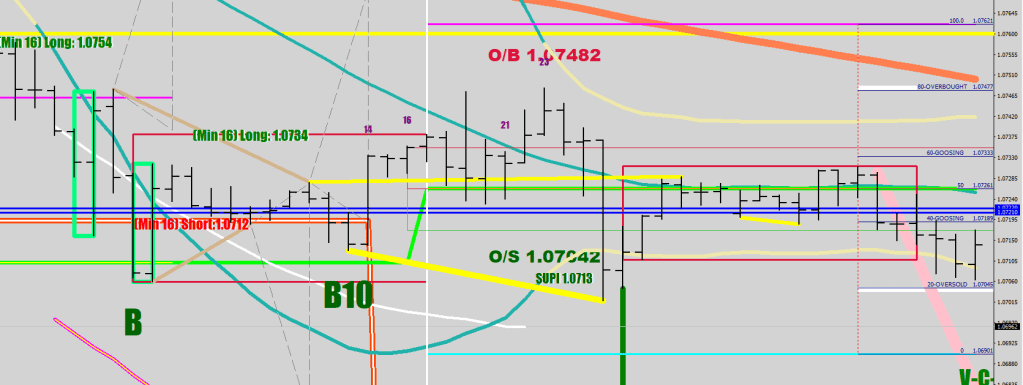
The above call was made when the 1st powder box printed on the downside.
I remembered a setup that was the mirror image of this, on the second run the red line proved to be final. Of course, in this case the continuation divergence got broken and they rounded up the short gains a little more. I would expect the 50% of this new powder box to hold. Call it 1.0687
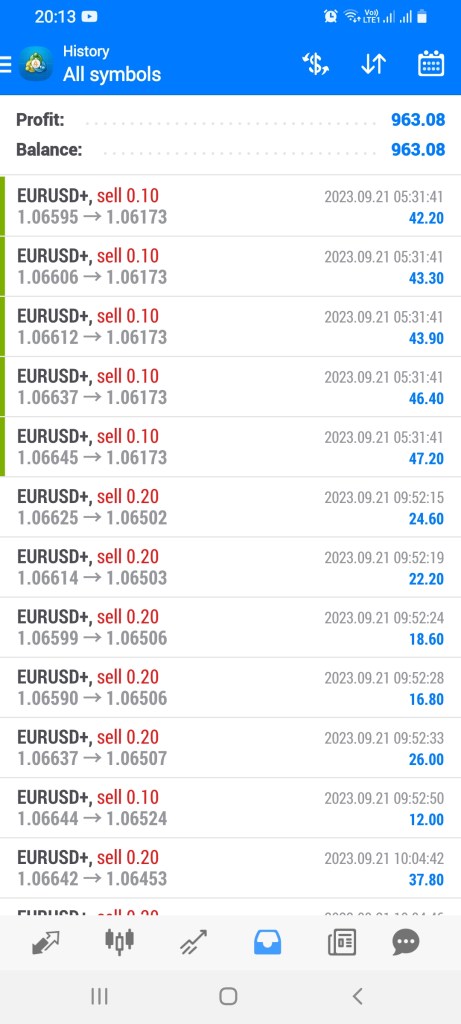
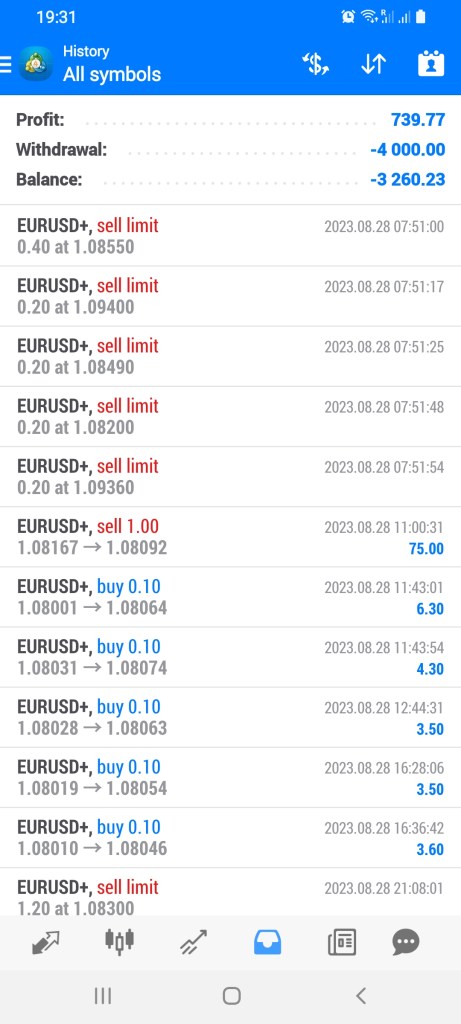
The great thing about Forex trading is that you can get away with little time by the computer. Crossing borders, flying for days, sailing without internet, buggy riding does not have to stop you from bringing your average holiday or not. Daily $500 is $2500 per week.
$2,9555.60 / 4 days (=$738.9 avg.) meets the criteria.
Don’t worry, won’t hold you for long. My target for the Wave 5 is 1.0705 (red square bottom). After that a vol whip’s V leg back to the continuation high (1.0950)
So what is Dominic doing over here? I left on Monday with a last minute withdrawal.
Teaching turtles algae jumping. I have gotten good at Photoshopping feet.
My new movement is this: make it and then pretend you’re faking it.