Subordinate Clause

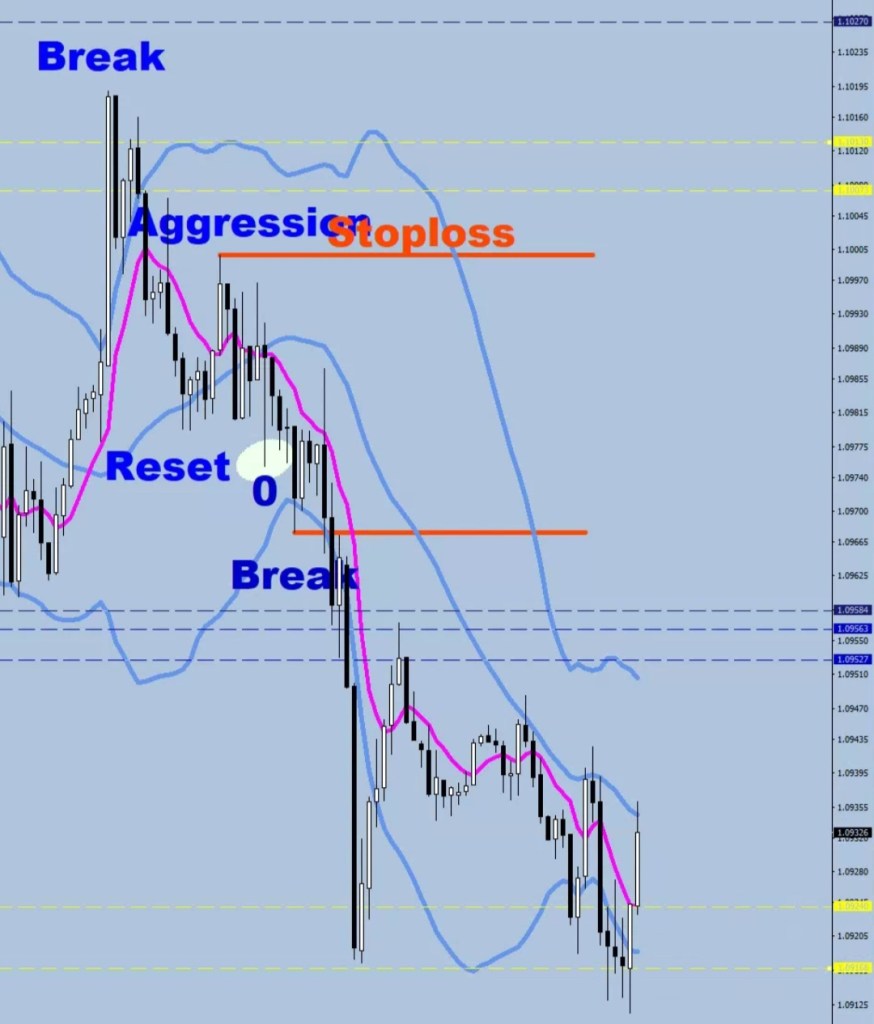
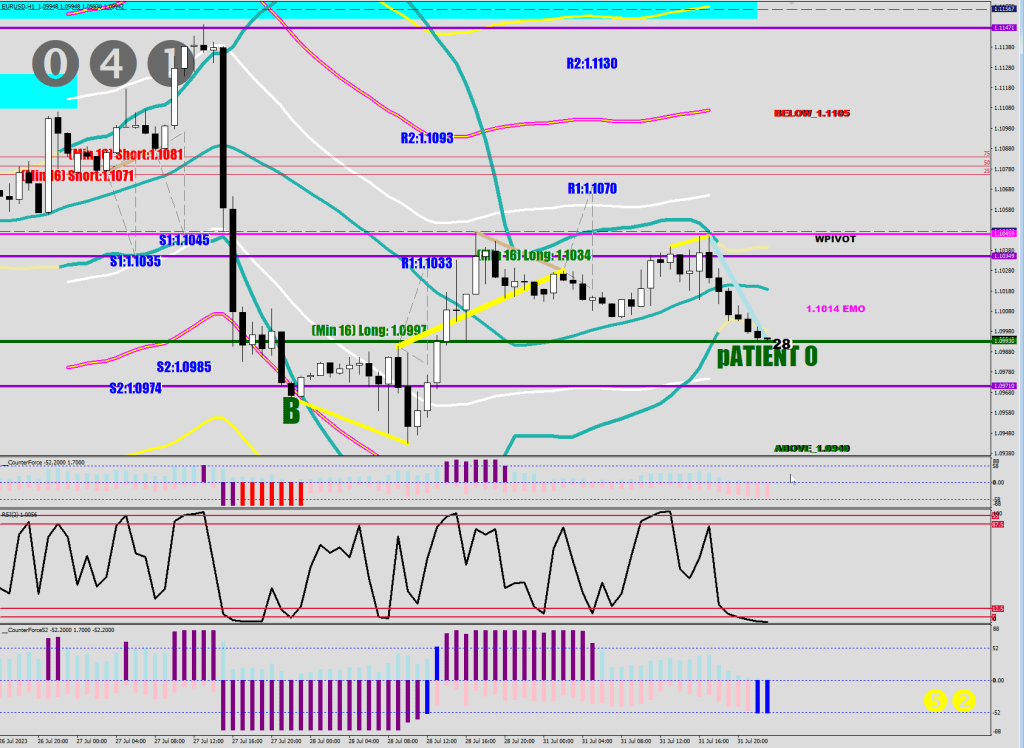
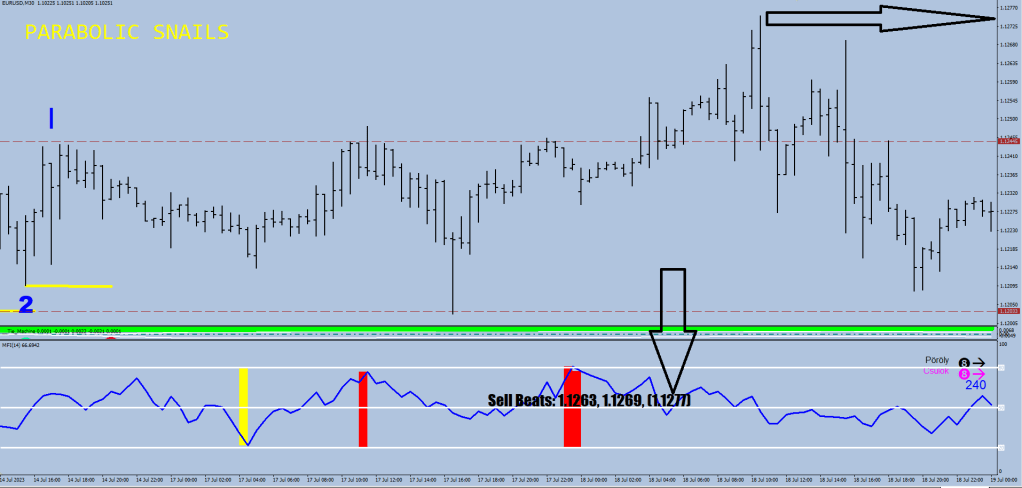
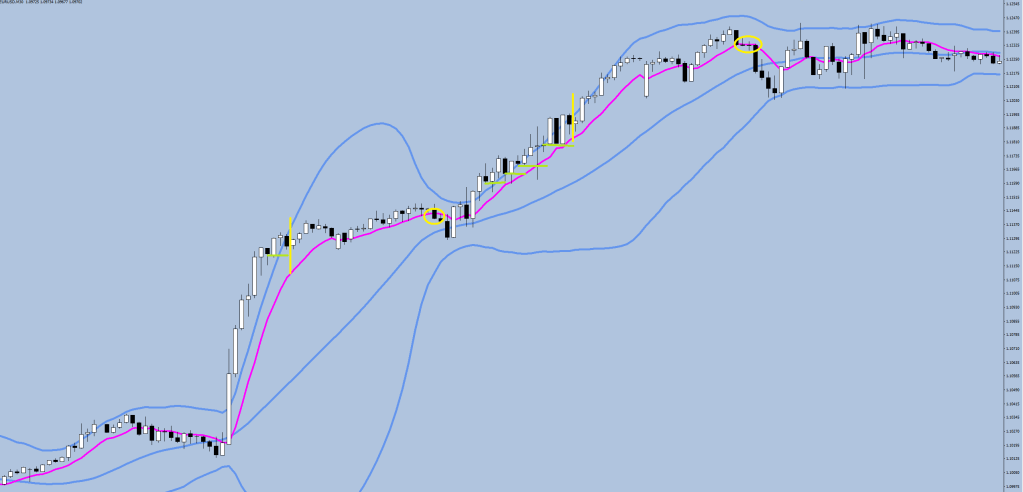
Gonna lose you with the colors again, but here we go.

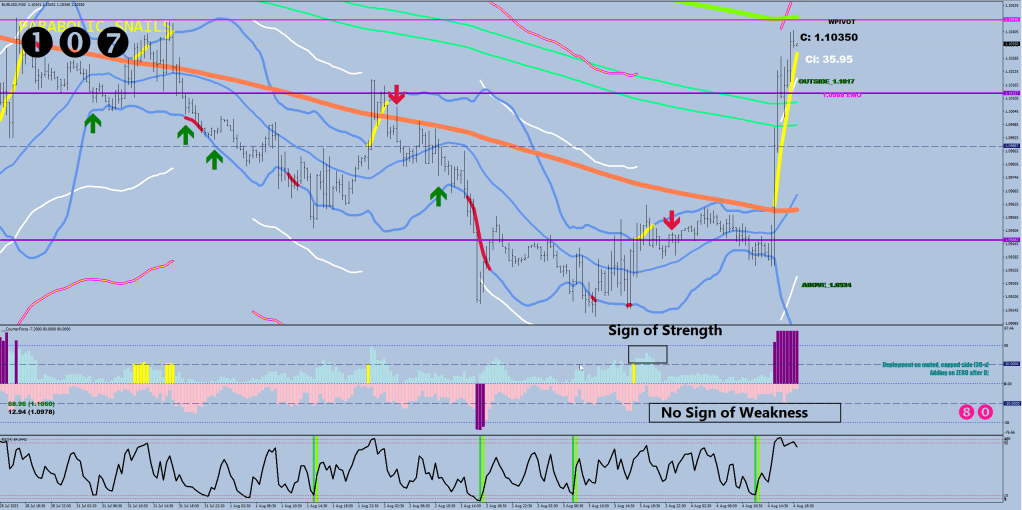
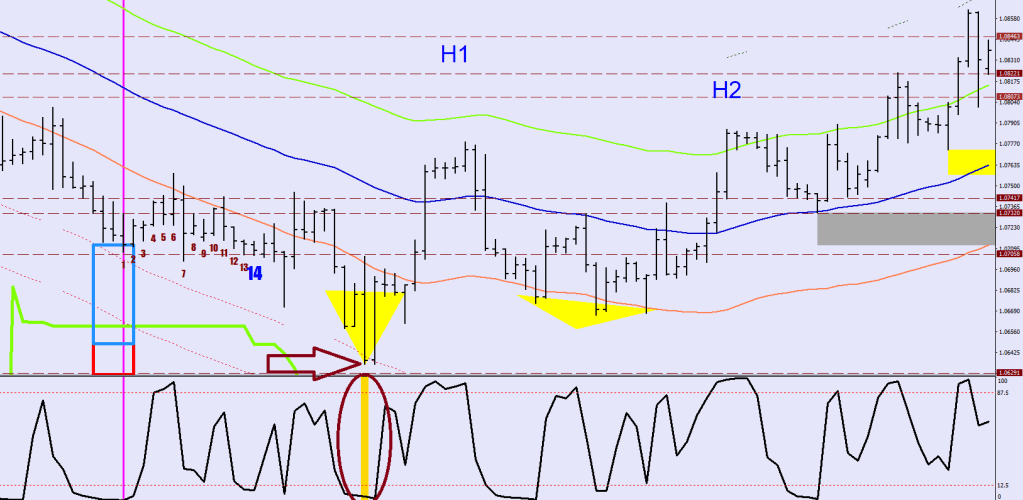
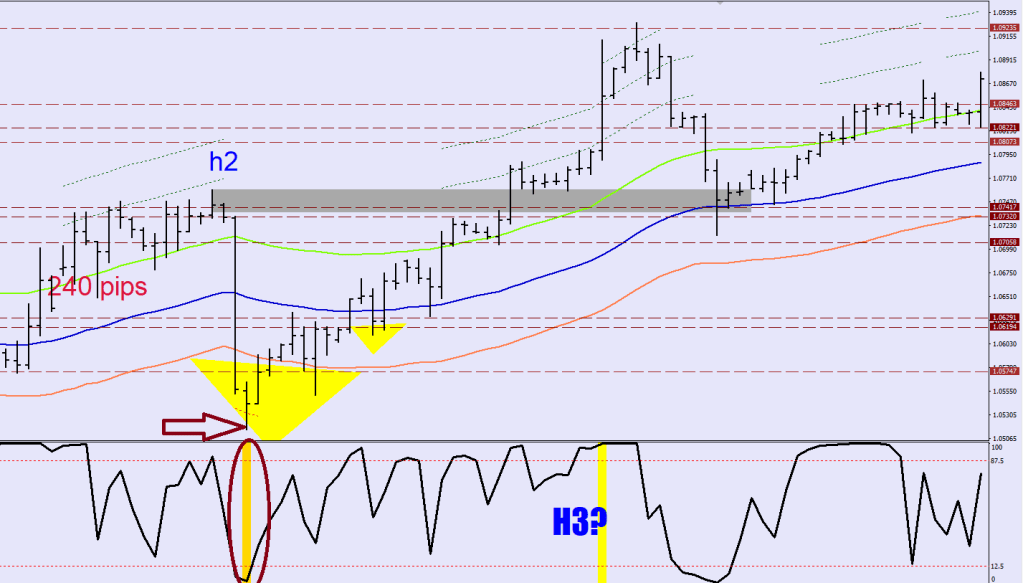
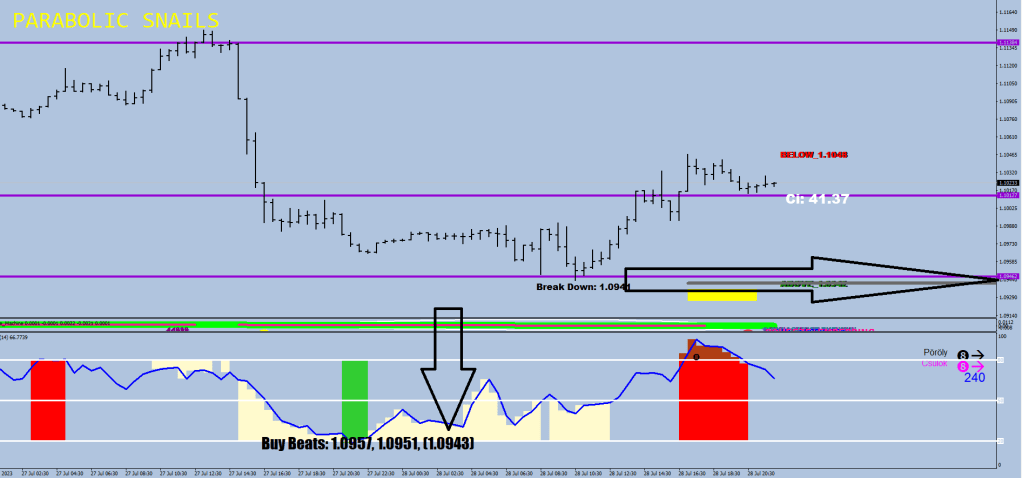
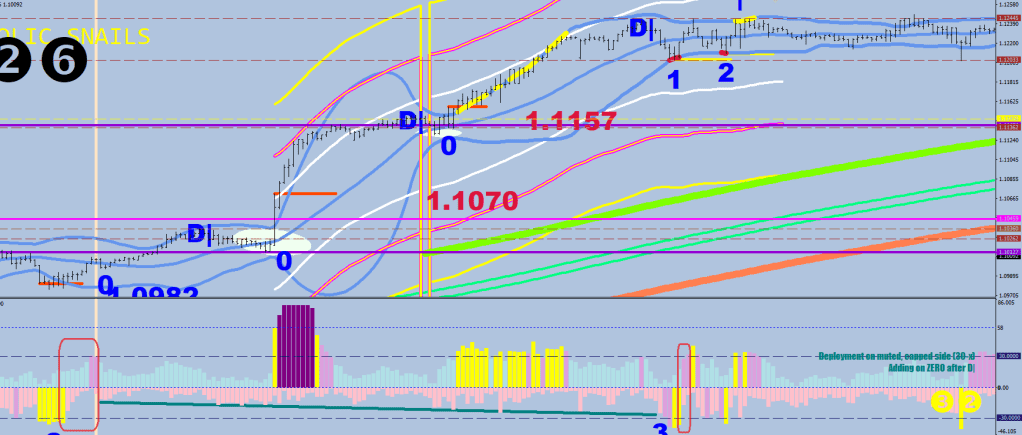
A yellow on one side followed by 2 plums on the other is a direction picked.

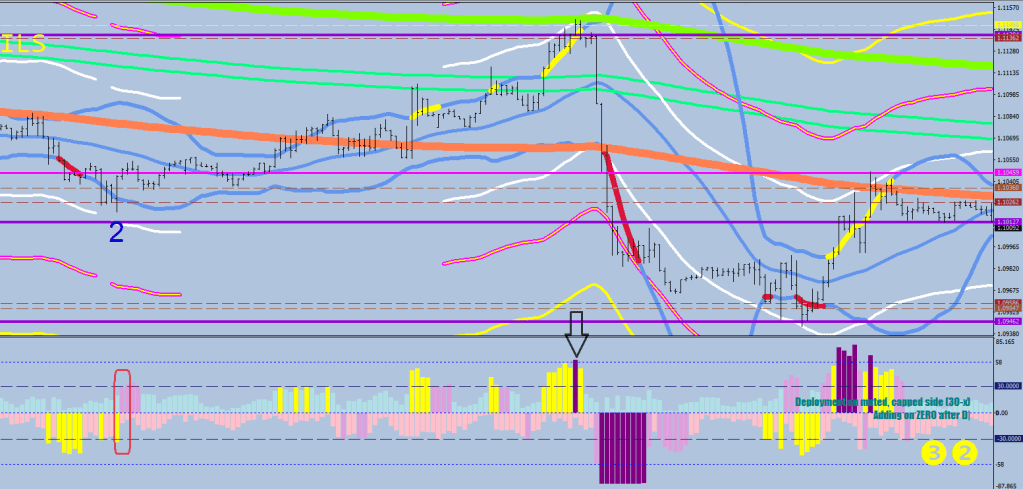
Missing tooth in the middle.

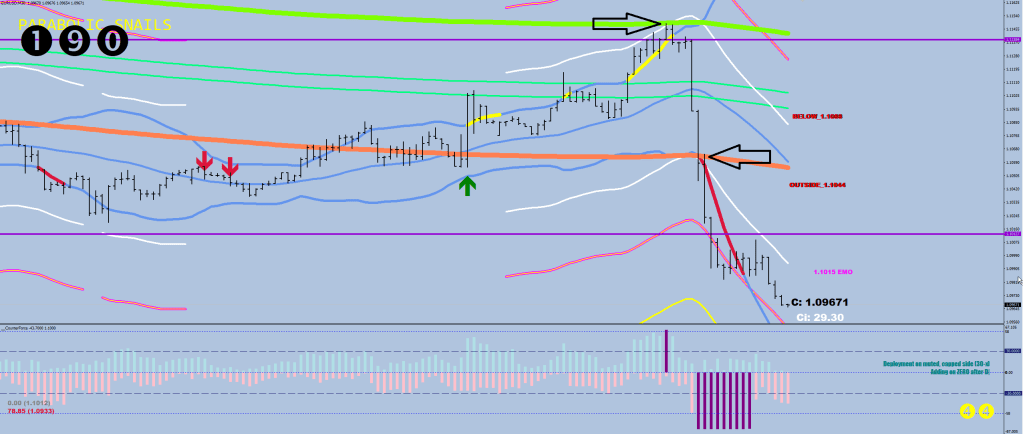
What is missing here? A yellow print on the upside followed by 2 plums down.

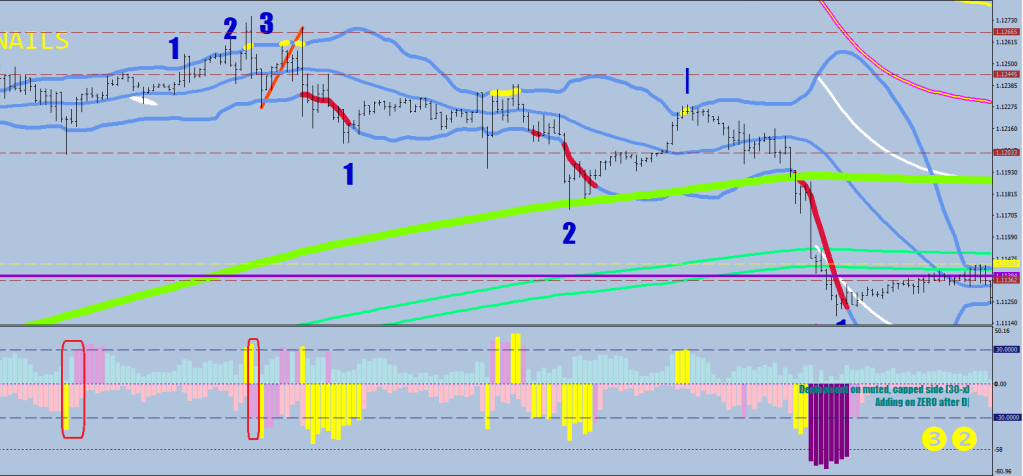
The plum basically a move that consolidates before breaching volatility. The oppressed or subordinate side is the dusk before the dawn.


ExtATRBuffer[i]= -1*(iHigh(symbol,0,iHighest(symbol,0,MODE_HIGH,sample-1,i+1))-Low[i])*10000;
 if (ExtATRBuffer[i]<-80) ExtATRBuffer[i]=-80;
else if (ExtATRBuffer[i]<-28 && ExtATRBuffer[i]>-58 
&& Low[i]<iBands(symbol,0,30,2,0,PRICE_MEDIAN,MODE_LOWER,i)) ExtATRBuffer6[i]=ExtATRBuffer[i];
else if (ExtATRBuffer[i]<-28 && ExtATRBuffer[i]>-58 
&& Low[i]>iBands(symbol,0,30,2,0,PRICE_MEDIAN,MODE_LOWER,i)) ExtATRBuffer7[i]=ExtATRBuffer[i];

 ExtATRBuffer2[i]=(High[i]-iLow(symbol,0,iLowest(symbol,0,MODE_LOW,sample-1,i+1)))*10000;
 if (ExtATRBuffer2[i]>80) ExtATRBuffer2[i]=80;
 else if (ExtATRBuffer2[i]>28 && ExtATRBuffer2[i]<58 
 && High[i]>iBands(symbol,0,30,2,0,PRICE_MEDIAN,MODE_UPPER,i) ) ExtATRBuffer6[i]=ExtATRBuffer2[i];
 if (ExtATRBuffer[i]<-58) ExtATRBuffer3[i]=ExtATRBuffer[i];
else if (ExtATRBuffer2[i]>28 && ExtATRBuffer2[i]<58 
  && High[i]<iBands(symbol,0,30,2,0,PRICE_MEDIAN,MODE_UPPER,i) ) ExtATRBuffer7[i]=ExtATRBuffer2[i];
 if (ExtATRBuffer[i]<-58) ExtATRBuffer3[i]=ExtATRBuffer[i];
 else if (ExtATRBuffer2[i]>58) ExtATRBuffer3[i]=ExtATRBuffer2[i]; 

   SetIndexBuffer(0,ExtATRBuffer);   
   SetIndexStyle(0,DRAW_HISTOGRAM,STYLE_SOLID,4,indicator_color1);
   SetIndexBuffer(1,ExtATRBuffer2);   
   SetIndexStyle(1,DRAW_HISTOGRAM,STYLE_SOLID,4,indicator_color2);
     SetIndexBuffer(2,ExtATRBuffer3);   
   SetIndexStyle(2,DRAW_HISTOGRAM,STYLE_SOLID,4,indicator_color3); 
        SetIndexBuffer(3,ExtATRBuffer4);   
   SetIndexStyle(3,DRAW_HISTOGRAM,STYLE_SOLID,4,indicator_color4); 
   SetIndexBuffer(4,ExtATRBuffer5);   
   SetIndexStyle(4,DRAW_HISTOGRAM,STYLE_SOLID,4,indicator_color5);
      SetIndexBuffer(5,ExtATRBuffer6);   
   SetIndexStyle(5,DRAW_HISTOGRAM,STYLE_SOLID,4,indicator_color6);
      SetIndexBuffer(6,ExtATRBuffer7);   
   SetIndexStyle(6,DRAW_HISTOGRAM,STYLE_SOLID,4,indicator_color7);
#property indicator_color1  clrPink
#property indicator_color2  clrPowderBlue
#property indicator_color3  clrPurple
#property indicator_color4  clrGreen
#property indicator_color5  clrRed
#property indicator_color6  clrYellow
#property indicator_color7  clrPlum

So this was about posting clips again?

The Key

The key to aggression is counter directional volatility.

The key to target projection is counter directional volatility.

While the market does not display the ability to move agaist the trend, it remains in a permanent limbo.

I thought the criteria for an Aggressive entry was settling back to the 30-min S30 first, and although the A would end up printing on the other side of this MA, the actual show card is 30+ pips of move first in the wannabe aggression.

Similarly, MFI beat projections are requiring a conter move in excess of 58 pips to be taken seriously.

So the first fight to engage in is for claiming enough volatility.

I do not know if I have picked the right metric, but I like the 4-hour sample 30 minute chart combo.

This is what I’ve been trying to tell you all my life: news does not change positioning.

COT data is delayed by a week and nobody knows how to read it. Funds cannot just dump what they have into decreased liquidity.

Also drawing “sell side liquidity” and “buy side liquidity” would not get you any closer to understanding the next move’s sustainability.

The market speaks to you via making directional volatility plots.

There was a fake out of the Weekly S2 (1.0945) and the daily S2 (1.0939).

Other: the Money Flow beat got an extra filter, the ionosphere. A low / high outside means that a lower low / higher high is yet to come.

 if (mfi[i+12]<mfi[i+13] && mfi[i+12]<mfi[i+11] && mfi[ArrayMinimum(mfi,3,i+11)]<mfi[ArrayMinimum(mfi,23,i+15)] && mfi[i+12]<21 && iStochastic(symbol,0,120,3,3,MODE_SMA,PRICE_MEDIAN,MODE_MAIN,i)<72){
            ObjectCreate("Sals"+DoubleToStr(i), OBJ_TEXT, indicator_window+1, Time[i+10], mfi[i]-mfi[i]*.2); 
        ObjectSetText("Sals"+DoubleToStr(i), "Buy Beats: "+DoubleToString(NormalizeDouble(iLow(symbol,0,iLowest(symbol,0,MODE_LOW,16,i+1))-80*Point,4),4)+", "+DoubleToString(NormalizeDouble(iLow(symbol,0,iLowest(symbol,0,MODE_LOW,16,i+1))-140*Point,4),4)+", ("+DoubleToString(NormalizeDouble(iLow(symbol,0,iLowest(symbol,0,MODE_LOW,16,i+1))-220*Point,4),4)+")", 22, "Impact", Black); 
         if (Low[i+12]<(stratod[i+12]-400*Point)) ObjectSetText("Sals"+DoubleToStr(i), "Buy Beat: "+" ("+DoubleToString(NormalizeDouble(iLow(symbol,0,iLowest(symbol,0,MODE_LOW,16,i+1))-220*Point,4),4)+")-> LL", 22, "Impact", Magenta); 
         if (iStochastic(symbol,0,120,3,3,MODE_SMA,PRICE_MEDIAN,MODE_MAIN,i+12)>10) ObjectSetText("Sals"+DoubleToStr(i), "MFI weakness", 22, "Impact", DimGray); 
         
      }

Also the golden stripes now have a look right +1 sample comparison

  if (i>0 && RSI2[i-1]>RSI2[i] && Low[i+1]<guardraild[i+1] && RSI2[i]>2 && 
   ((RSI2[i]<RSI2[i+1] && RSI2[i+1]>.5 && RSI2[i+1]<3.5 && RSI2[i+2]<4.5)
   || (RSI2[i]>RSI2[i+1] && RSI2[i+1]>.5 && RSI2[i+1]<3.5 && RSI2[i+2]>3.5  && RSI2[i+2]<7 
   && iMFI(symbol,0,14,i+1)<45 
   && iMFI(symbol,0,14,i+1)>25  ))
   && iLow(symbol,0,iLowest(symbol,0,MODE_LOW,6,i))< iLow(symbol,0,iLowest(symbol,0,MODE_LOW,10,i+7))
   )

Still a virgin afer all these years

Market M.O.

Let the virgin become a surgeon and the surgeon turn into a sturgeon.

The market operates the following way: it is printing virgin levels that it can push against go get a directional move going.

Where’s the fire? One virgin put out…

show me the meaning of being yellow

these levels are attractors, but repellants soon after their cancellation before ultimately becoming neutral

This is an example for the 3rd spike not making it outside the BB, thus the outer limit was printed by spike 2.

Hijacking

Hi, my name is Jack and I’ll be your hijacker today.

Everything’s been going like clockwork for several months in terms of terminal patterns coming about and playing out to the T.

Today, there was a shocker move: the zero got run over.

After the volatility breach / break out the price would settle back to the 30 SMA for a reset. The move from there towards back to the BB gets cut short by the Aggression. That’s player one (with a Zero shirt on) positioning at one side of the volleyball net. Player 2 tries to hit back the ball. If he/she slips, there is a helper by the end of the BB field. That’s a second touch for serving back the ball. If the second player drops it as well, the break is on.

Similarly, now the price is expected to settle back to the S30 net for another Aggression that would be received by the Zero and there would be another game where hijacking becomes a possibility.


Now let’s move onto Baroness Münchausen.

With that tumbnail image and a random snapshot of a 26k Robin Hood account with a daily gain of $570 (2.23%) from somewhere are meant to be the definite proofs for her claim of making 6.5 million in 2 years starting with a negative balance.

“I turned $26 to 26k, then to 100k”…

“You think I’m lying? Well, motherfucker I’ve got proof”

This is a terrible future we are veering towards. The bigger liar you are, the less spine you have, the higher the likelihood of you succeeding and getting rewarded in life.

742k views of this absolute nonsense.

“There is the retail and the institutional approach. You can trade it either way.”

Sure, it is a personal preference to make money or to lose.

After this you need to ponder a bit about how much people like Graham Stephan and Yassir Paffrath are inflating their bottom lines as well.

Graham would sell his mother for a revenue producing YouTube video, refer to his insurance policy of making a vid on giving his girlfriend 100k to max out returns.

Disgusting these people are.

Mistaken Spike Identity

you can’t complain about coherence and consistency

I gave you the yellow level yest.

notes again

#1: spike out / dog fight (can improve on its final number) – pull back to shy of 8 EMO
#2: spike out (can fall short at times) – come back beyond S30 (shy if steep angle)
#3: max velocity – 7-12-28 pips beyond #1/#2’s furthest; #3 can be cut short before the BB at times

database

& now for the opposite yellow…

Tight Turn

I wrote this down yest on notepad.

This market is not going to stop going up until a

D|-0-1-2-3 or a
A-0-1-2-3 pattern happens (Aggression requires the touch of the S30 prior)

Buy:
lower BB,
the 0 after the D| / A (8-9 pips beyond S30)
10 pips inside the BB after the 1 and the 2

counterforce -28 is ideal for adding

1-2-3 has to come in a quick succession, otherwise 0 can repeat

Little did I know what they had in store in less than 16 hours into the week.

This was an A-0-123 pattern at resistance at the highest speed possible. Breach 3 never scored a close outside which is highly unusual.

Also I started adding the violation 3 30-min close back opens and closes as two different levels of intetest (interrupted lines).

Now it looks like at a minimum we’re gonna tag the yellow virgin level underneath. A lower low is a possibility, but not a must.

A liquidity snake could salvage the uptrend question, but for that price would have to dip at least 52 pips. Get below 1.0994 within 7 hours, or my name would not be Parabolic Snails.

 
    if ((((iBands(symbol,0,30,2,0,PRICE_MEDIAN,MODE_UPPER,i)-iBands(symbol,0,30,2,0,PRICE_MEDIAN,MODE_LOWER,i))*10000>58
   
  
   &&  Low[i]<iBands(symbol,60,30,2,0,PRICE_MEDIAN,MODE_LOWER,i) 
    && 
    (High[i+2]>iBands(symbol,60,30,2,0,PRICE_MEDIAN,MODE_UPPER,i+2) || High[i+3]>iBands(symbol,60,30,2,0,PRICE_MEDIAN,MODE_UPPER,i+3)
    || High[i+4]>iBands(symbol,60,30,2,0,PRICE_MEDIAN,MODE_UPPER,i+4) || High[i+5]>iBands(symbol,60,30,2,0,PRICE_MEDIAN,MODE_UPPER,i+5)
    || High[i+6]>iBands(symbol,60,30,2,0,PRICE_MEDIAN,MODE_UPPER,i+6)))
     ||
    (iHigh(symbol,0,iHighest(symbol,0,MODE_HIGH,7,i))-Low[i]> 520*Point && Low[i]<iBands(symbol,0,30,2,0,PRICE_MEDIAN,MODE_LOWER,i) && High[i+7]>iBands(symbol,0,30,2,0,PRICE_MEDIAN,MODE_UPPER,i+7))
    )
     && (iHigh(symbol,0,iHighest(symbol,0,MODE_HIGH,7,i))-iLow(symbol,0,iLowest(symbol,0,MODE_LOW,18,i+7))>520*Point
      || (iBands(symbol,0,30,2,0,PRICE_MEDIAN,MODE_UPPER,i+7)-iBands(symbol,0,30,2,0,PRICE_MEDIAN,MODE_LOWER,i+7))*10000>27
     
     )   && iHigh(symbol,0,iHighest(symbol,0,MODE_HIGH,7,i))-Low[i]<950*Point
    ){
          ObjectCreate("Palmat"+DoubleToStr(i), OBJ_TEXT, 0, Time[i], Low[i]+10*Point); 
          ObjectSetText("Palmat"+DoubleToStr(i), "pATIENT 0", 32, "Impact", DarkGreen);
          if (iBands(symbol,0,15,2,0,PRICE_MEDIAN,MODE_UPPER,i+4)-iBands(symbol,0,15,2,0,PRICE_MEDIAN,MODE_LOWER,i+4)<300*Point && iBands(symbol,0,15,2,0,PRICE_MEDIAN,MODE_UPPER,i+4)-iBands(symbol,0,15,2,0,PRICE_MEDIAN,MODE_LOWER,i+4)>260*Point) ObjectSetText("Palmat"+DoubleToStr(i), "pATIENT 0", 32, "Impact", DarkGray);

Weekend Wrap

The market had a healthy bounce off of the weekly S2.

The continuation divergence is now set (C).

A 5th wave sould match / slightly beat the high. A measurement of using the legth of the W1 gives 1.1290+ for a target.

The overlap of Wave 1 and Wave 4 is the norm.

The big picture is that the Y wave would conclude after this Wave 5 up that can be improved upon by the following volaility whip.

So that would be up mostly for the first 2 weeks of August. The daily 20-sample Bollinger would likely be hit at some point.

The one reactive area is the daily fair value gap’s top marked with the red X.

Happy trading!

6 Years A Blogger

It’s an anniversary, so let’s throw some mothafuckas on the fire.

Chad GPT

The Fake It Till You Make It programme does not come with given things. Random things go into the blender. Andrew Tate’s “genius” Matrix analog, stretching – that’s a must, loads of health conscience, longetivity made poular by Bryan Johnson. Add crypto in the mix. A Chad GPT person scissors and magnifies. Numbers? 200x!

The only practical piece of information towards owning a $34 million private jet is stretching – so let’s use that.
120 years – in the mix.

“Everything’s a ponzi”. That’s right, Mr. Argentina, nothing to cry for me about. Every stock in the world is a pump and dump scheme.

Does anybody ever think about how does this foreigner end up with a Green Card? The last time overstayers could be sponsored was in 2001. He is not married, had a toilet cleaning job – not the high demand kind.

Ilusiveness and vail of fog. “A man coming from afar can say whatever they want” – a Hungarian saying.

Quotes from the Kodaly’s Hary Janos Wikipedia Entry.

“…his stories are not true is irrelevant, for they are the fruit of a lively imagination, seeking to create, for himself and for others, a beautiful dream world.”

“According to Hungarian superstition, if a statement is followed by a sneeze of one of the hearers, it is regarded as confirmation of its truth.”

The Sneezers

The YouTubers don’t care about fact checking. They care about clicks, watches and likes, as those translate to revenue, thus truth is irrelevant and credibility gets forged by big names.

Have you made a mill? – asks Sebastian.

20 milllion here, 20 million there. Somehow he managed to short all the big crypto bankruptcies whilst not having any of his money in Tether or at an exchange like FTX. Proof? Nowhere. Credibility: a loss of 3.5 million.

Moved to Puerto Rico, because of the 3% tax rate. He must be rich then. Everybody who moves there is a millionaire.

He claims to have to pay 1 million in taxes. That’s a 3% of what number that was multiplied by 200?

There are claims like having turned 5k to 100k in 7 months, but no proof of any kind. Whatever happened with the 2 million float on crypto to have a 50k short be safe.

The snapshot numbers are – as best I can make them out:

Entry price: 20,770 market price 20,318.55

P&L 3,144.11 (10.87%)

It seems to be the same software that Crypto Face is streaming with whilst selling a useless TradingView indicator in record quantities for 1.5k a pop.

The best trading advice of your life is coming up…

Straight from the video titled: “I trade on a Different level.”

Every scammer has a smartness. When a gypsy said he was going to take my Mustang for a test drive and then transferred it onto his name and sold it, that was his m.o.

Luke Belmar charges 15k for his “Capital Club” membership. Lambo Raul has a dental specialist father and he sells “trade signals” (made by his friend, Albert) to compliment his income whilst posting videos of trading with a demo account.

I also wanted to touch upon the shock therapy part. You would be less prone to mulling over the content when you receive a beat up session. The aggression and jerk attitude also slipped into the blender of Mr. Agent Puberty.

433k views, money is starting to roll in bitchez!

As for the having lost 45 pounds part…

..

I was thinking to get a curly wig and a straw hat and a raw eggplant / cucumber and pose for a “trying on the Wagamama Bahama Mama 25-billion dollar diet”, but I will be going to a different part of the Caribbean.

I’m a cosmo-electrician

(maybe more, maybe less)

closer than your next of kin

angel, devil of the night

…and the seed of everything

This image has an empty alt attribute; its file name is 20210514_084543.jpg

The Coveyor Belch

How do I know that the low is in?

I base it on 3 things.

1st: 4H RSI2

Current:

Previous ones:

Filter:

Low[i+1]<guardraild[i+1] && RSI2[i]>2 && 
   ((RSI2[i]<RSI2[i+1] && RSI2[i+1]>.5 && RSI2[i+1]<3.5 && RSI2[i+2]<4.5)
   || (RSI2[i]>RSI2[i+1] && RSI2[i+1]>.5 && RSI2[i+1]<3.5 && RSI2[i+2]>3.5  && RSI2[i+2]<7 
   && iMFI(symbol,0,14,i+1)<45 
   && iMFI(symbol,0,14,i+1)>25  ))

2nd: Money flow final beat. Both last calls were off by less than a pip.

Filters:

  if (mfi[i+12]>mfi[i+13] && mfi[i+12]>mfi[i+11] && mfi[ArrayMaximum(mfi,3,i+11)]>mfi[ArrayMaximum(mfi,23,i+15)] && mfi[i+12]>79 && iStochastic(symbol,0,120,3,3,MODE_SMA,PRICE_MEDIAN,MODE_MAIN,i)>28){
            ObjectCreate("Sal"+DoubleToStr(i), OBJ_TEXT, indicator_window+1, Time[i+10], mfi[i]+mfi[i]*.2); 
        ObjectSetText("Sal"+DoubleToStr(i), "Sell Beats: "+DoubleToString(NormalizeDouble(iHigh(symbol,0,iHighest(symbol,0,MODE_HIGH,16,i+1))+80*Point,4),4)+", "+DoubleToString(NormalizeDouble(iHigh(symbol,0,iHighest(symbol,0,MODE_HIGH,16,i+1))+140*Point,4),4)+", ("+DoubleToString(NormalizeDouble(iHigh(symbol,0,iHighest(symbol,0,MODE_HIGH,16,i+1))+220*Point,4),4)+")", 22, "Impact", Black); 
         if (iStochastic(symbol,0,120,3,3,MODE_SMA,PRICE_MEDIAN,MODE_MAIN,i+12)<88 || iStochastic(symbol,0,120,3,3,MODE_SMA,PRICE_MEDIAN,MODE_MAIN,i+12)>96.8) ObjectSetText("Sal"+DoubleToStr(i), "Vindicated MFI strength", 22, "Impact", DimGray);  
      }
      
         if (mfi[i+12]<mfi[i+13] && mfi[i+12]<mfi[i+11] && mfi[ArrayMinimum(mfi,3,i+11)]<mfi[ArrayMinimum(mfi,23,i+15)] && mfi[i+12]<21 && iStochastic(symbol,0,120,3,3,MODE_SMA,PRICE_MEDIAN,MODE_MAIN,i)<72){
            ObjectCreate("Sals"+DoubleToStr(i), OBJ_TEXT, indicator_window+1, Time[i+10], mfi[i]-mfi[i]*.2); 
        ObjectSetText("Sals"+DoubleToStr(i), "Buy Beats: "+DoubleToString(NormalizeDouble(iLow(symbol,0,iLowest(symbol,0,MODE_LOW,16,i+1))-80*Point,4),4)+", "+DoubleToString(NormalizeDouble(iLow(symbol,0,iLowest(symbol,0,MODE_LOW,16,i+1))-140*Point,4),4)+", ("+DoubleToString(NormalizeDouble(iLow(symbol,0,iLowest(symbol,0,MODE_LOW,16,i+1))-220*Point,4),4)+")", 22, "Impact", Black); 
         if (iStochastic(symbol,0,120,3,3,MODE_SMA,PRICE_MEDIAN,MODE_MAIN,i+12)>10) ObjectSetText("Sals"+DoubleToStr(i), "Vindicated MFI weakness", 22, "Impact", DimGray); 
      }

Filtering is art. Filtering is science. Filtering is my life.

3rd: Compare & enjoy

In what way are these two images one and the same? (Top VS Bottom)

Let’s rotate and annotate.

D|: divergent pitch; 0: Zero entry; 1,2,3 are the 3 BB breaches & was over

The Conveyor II

Where are the purple lines from? They are the Divergent Bats (D| = S). Fire sales without getting up to the 30-sample BB.

The thing about trading is that everybody seems to talk about volatility, yet nobody seems to understand it intimately since John Bollinger.

A single number cannot substitute the two, directional measurements.

It is always the one chart that you stopped looking at that holds all the keys.

The neon blue people were sitting on that ask. E-50 is what they had in mind.

The opportunity is excellent to talk about a feature of the Conveyor: a 30-minute close outside is a buy. A 30m close back inside, and the market has to prove that the momentum is still present. Otherwise… this very thing can happen. Outside day down.

The Magenta line is the 8 EMO. Candles are a must for this one.

The Guard Rails are a product of my vivid imagination. They don’t exist.

h2 I would put somewhere above 1.1095. From there there may be a fork. If h2 gets broken after some retracement, the whole thing flips bullish and starts a new H-h count to the upside. Otherwise an H3 should make a beat beyond the H2, 1.0923 would be the next logical level down.

Since this is going to likely print a Divergent pitch here (DI), the bears would get an opportunity to run with this momentum by stepping in just beyond the S30 (blue), somewhere in the 1.1044-1.1088 area.