Everything Wrong With E.W.

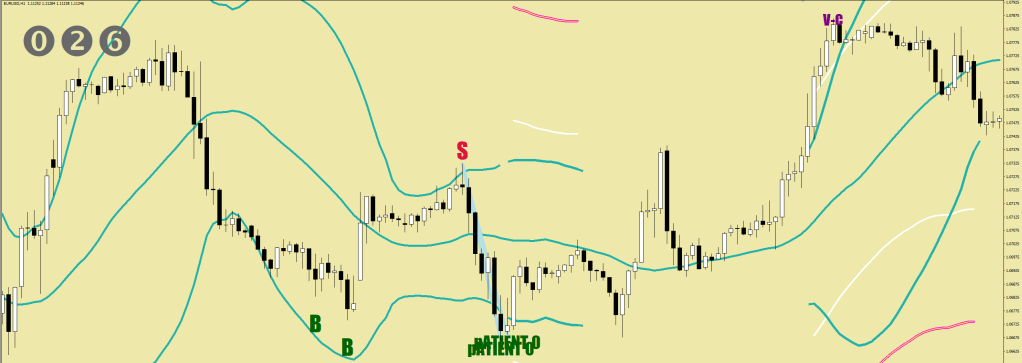
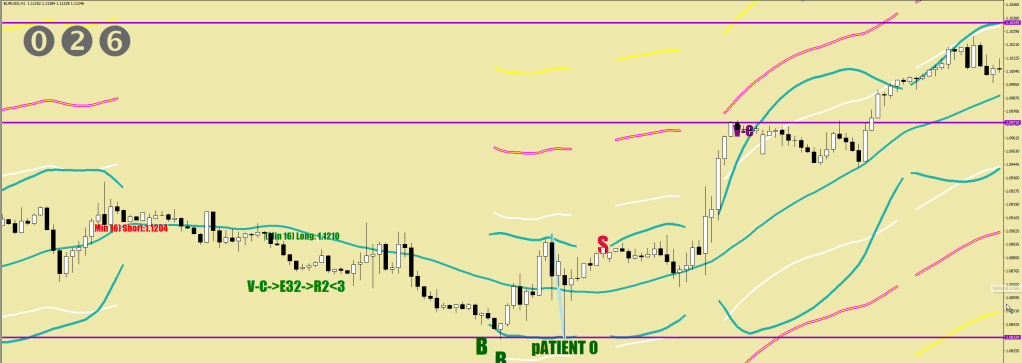
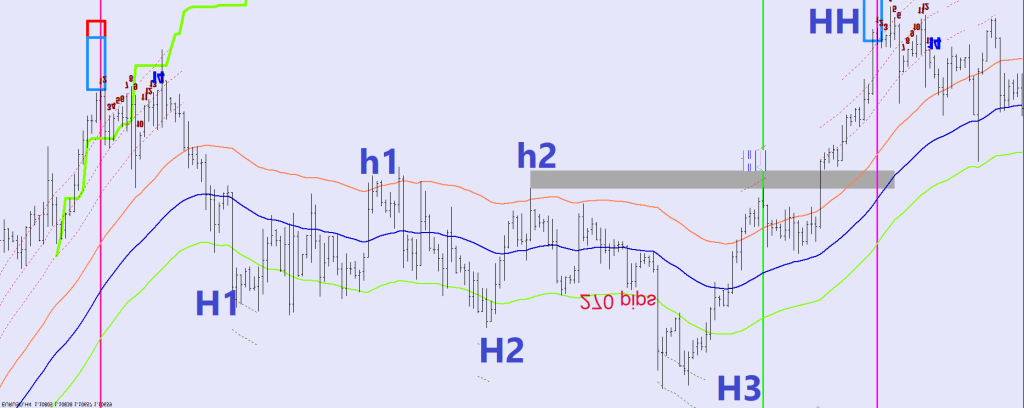
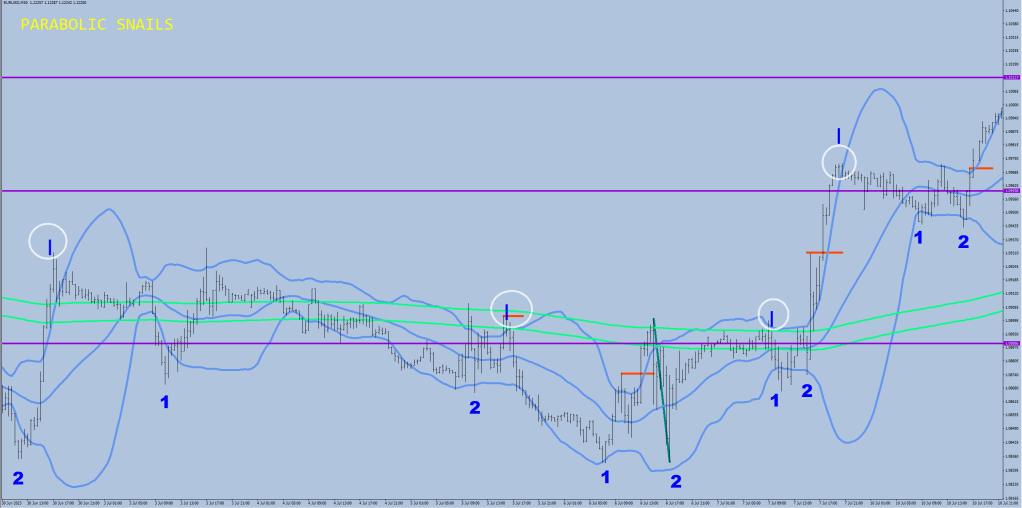
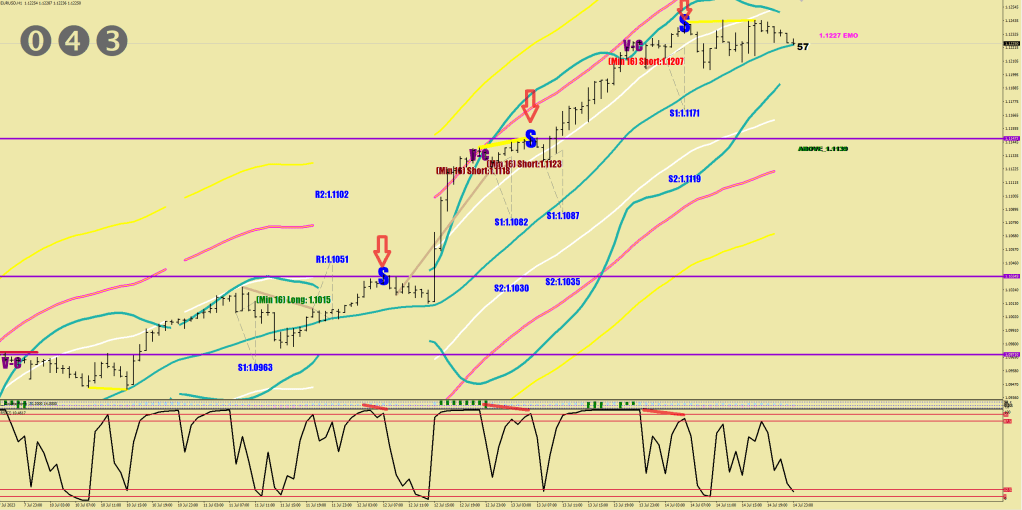
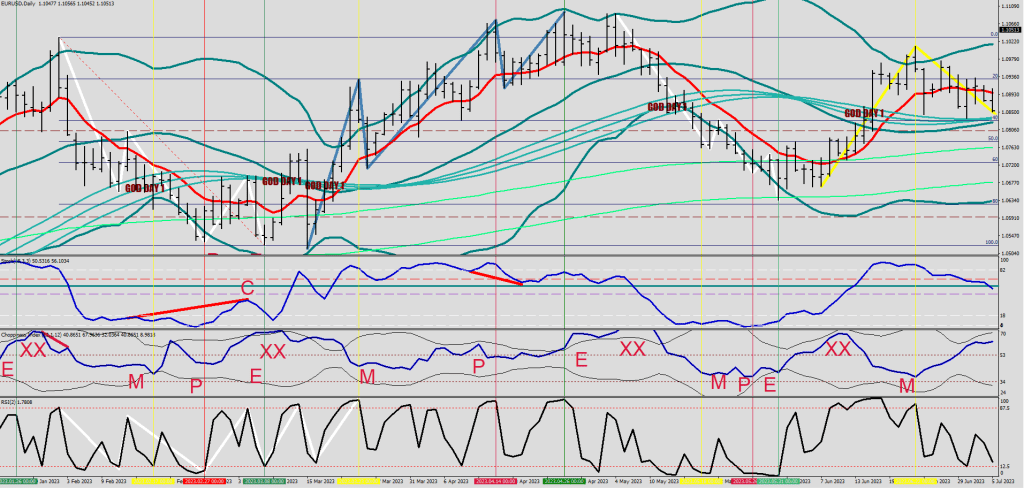
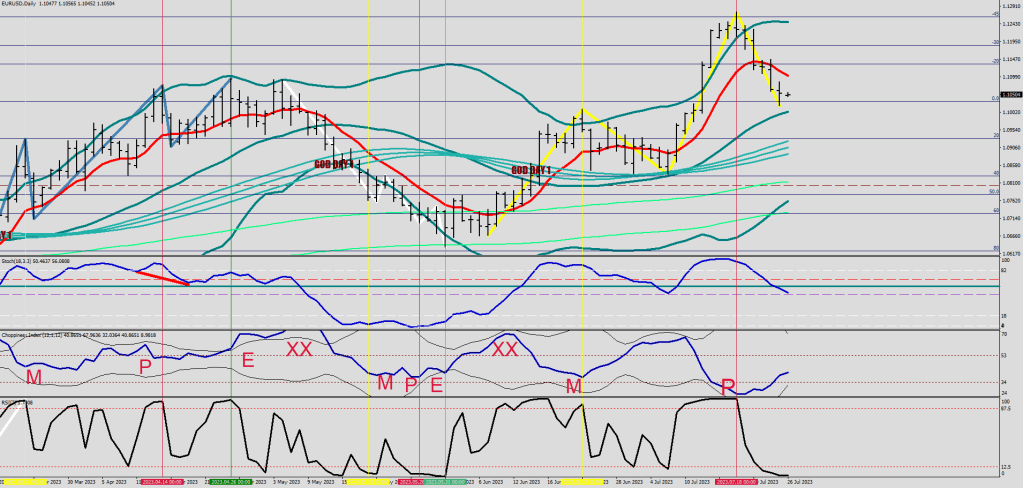
Wrong 1: Not everything is part of a wave structure. The episodes of Extra High energy reverses (XX) and compressed volatility at some point may trigger a whipping “revenge”. This move may end with a higher high / lower low beyond the established wave structure at times.

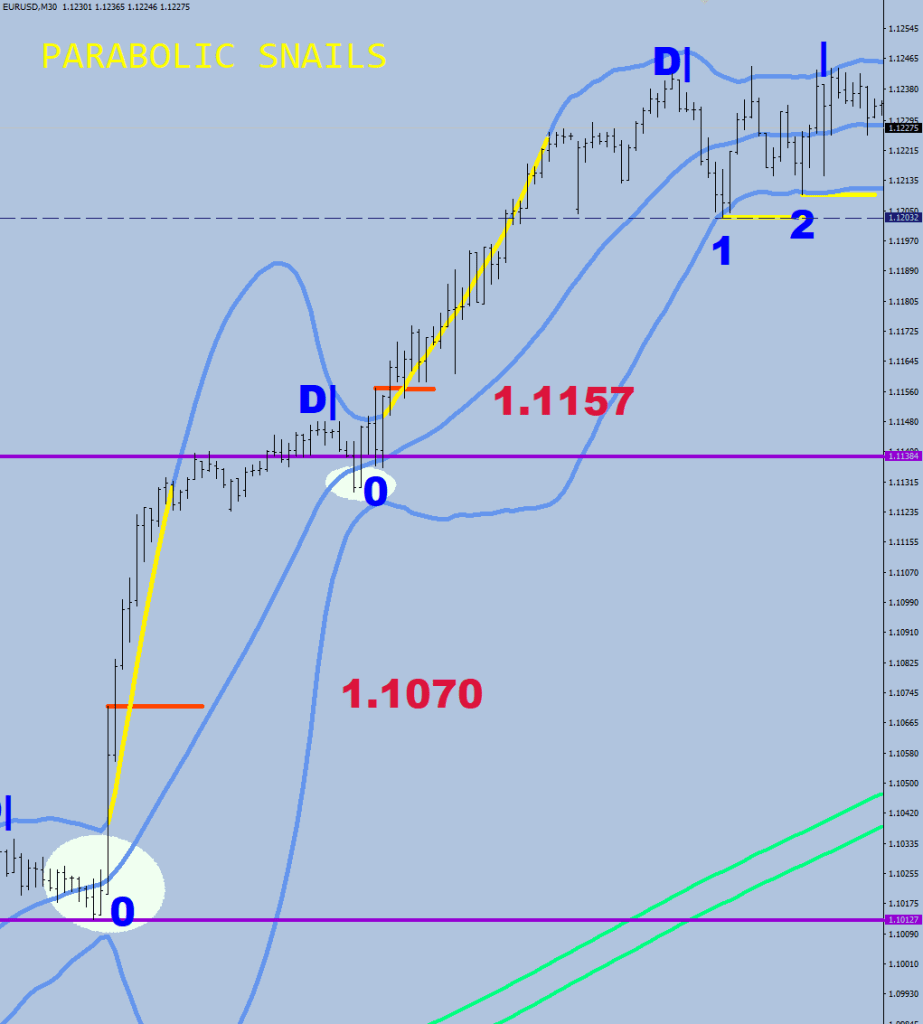
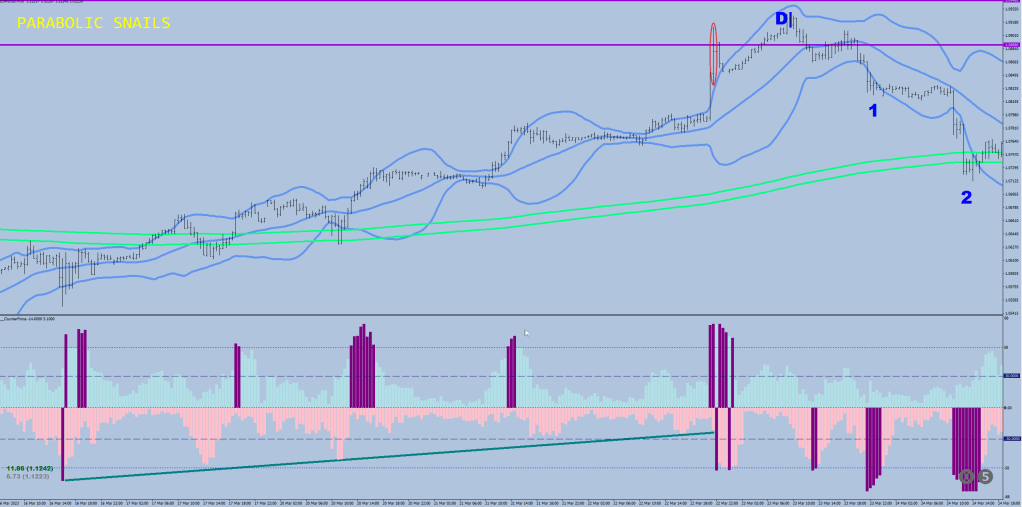
Wrong 2: Wave 3 may actually be a lot weaker than a Wave 1, since the M, Measuring leg only starts drawing after a breach of the 2SD 30 sample BB. I know, E.W. says Wave 3 cannot be the weakest of the 3 impulses, it is the impression that plants in people’s heads that is the problem here.

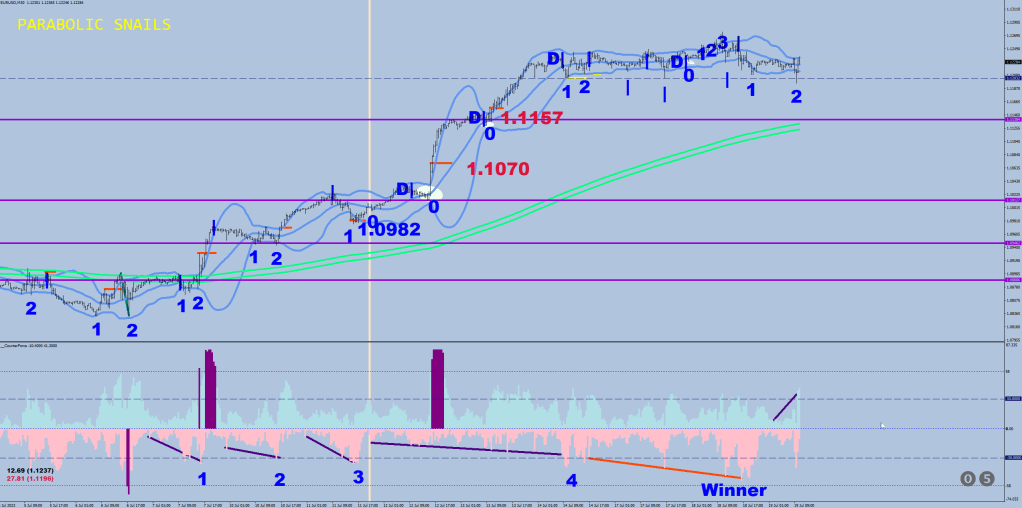
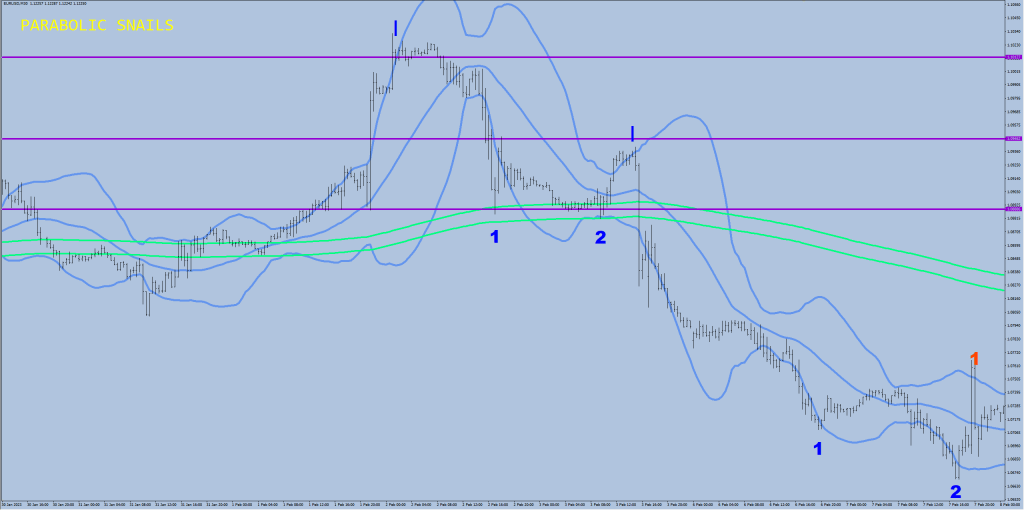
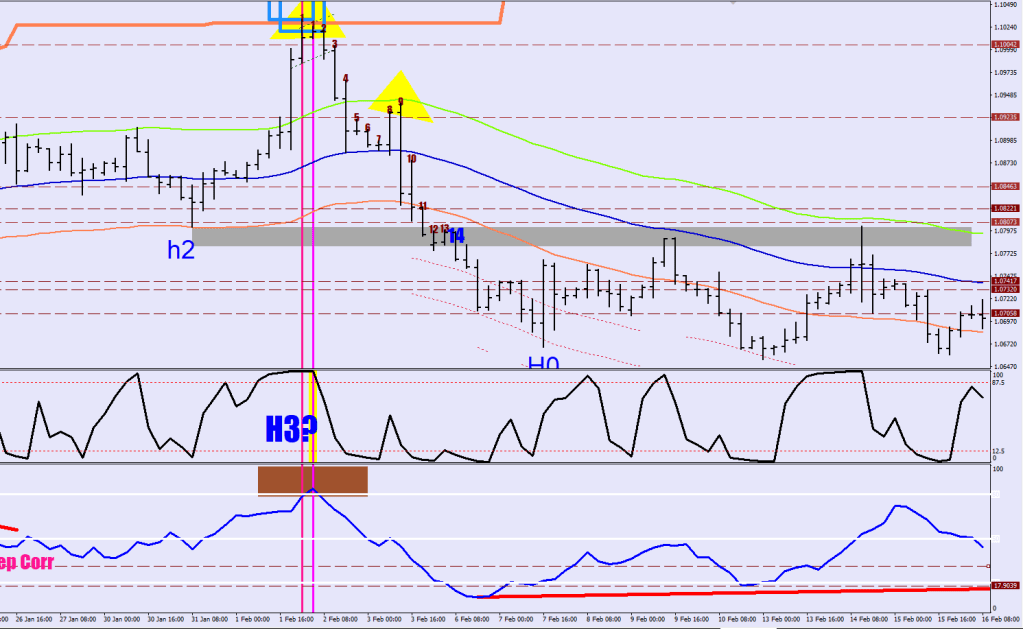
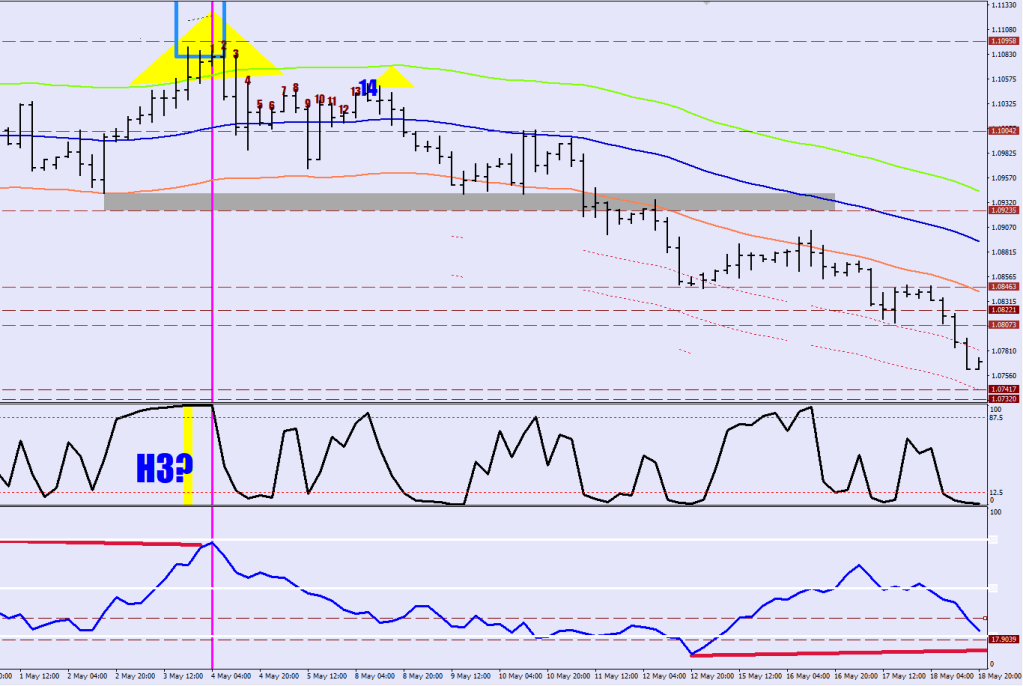
Wrong 3: Wave 1 and Wave 4 cannot overlap. You can see 2 overlaps out of the last 3 wave structures above.

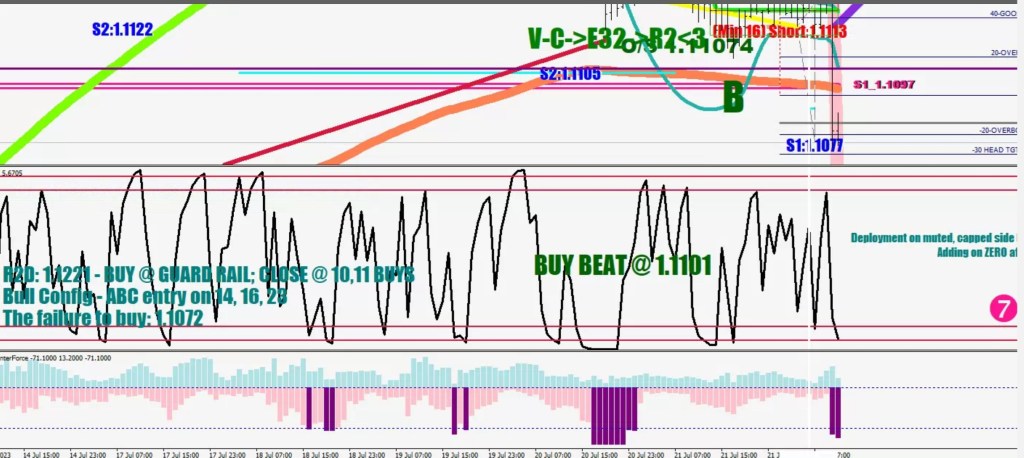
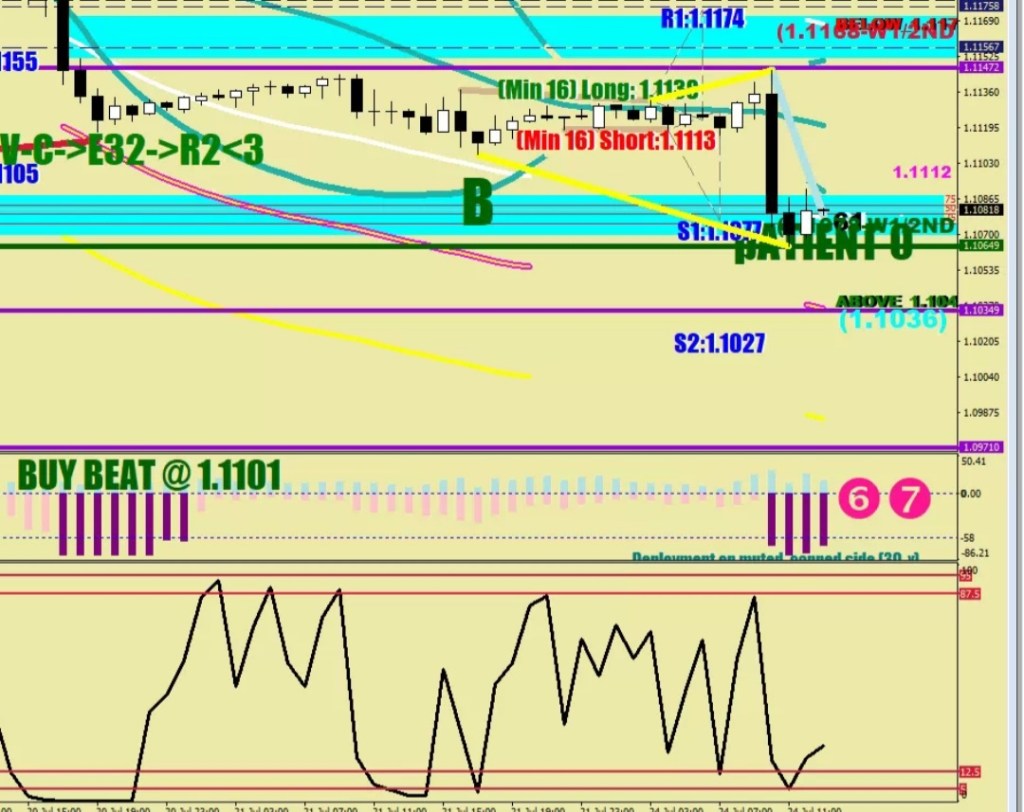
The biggest problem with their system is the lack of quantifying anything. There is no measuring stick, only looks and likes. I believe using the Choppiness is a way of overcoming a lot of the problems.

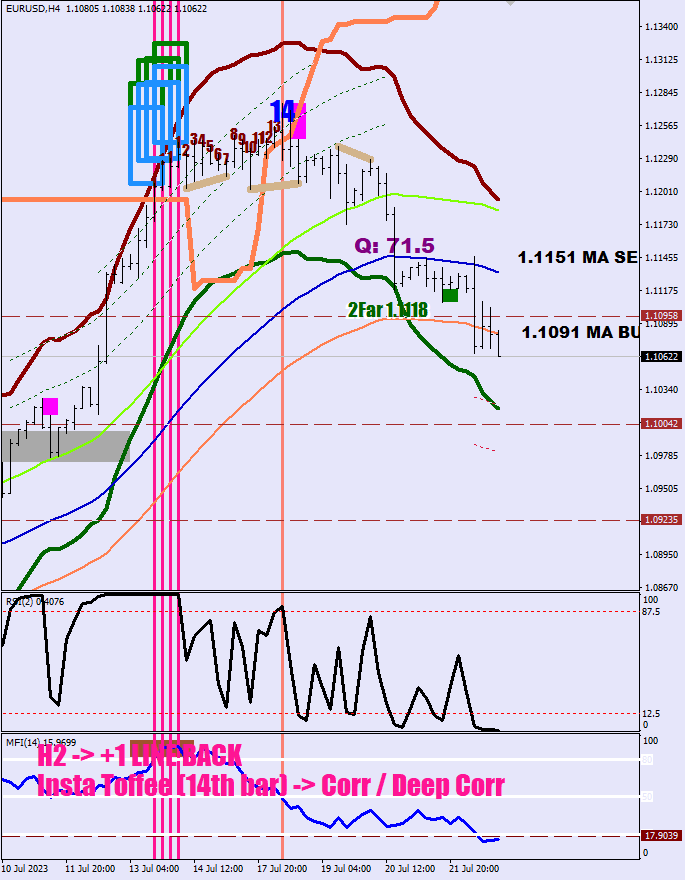
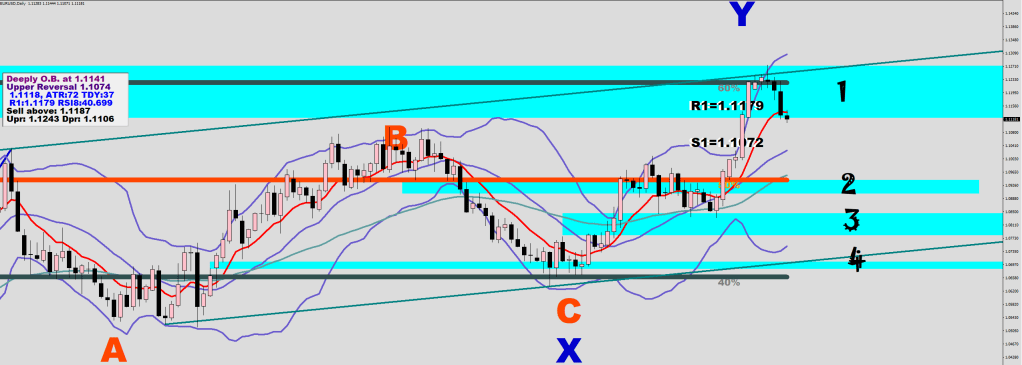
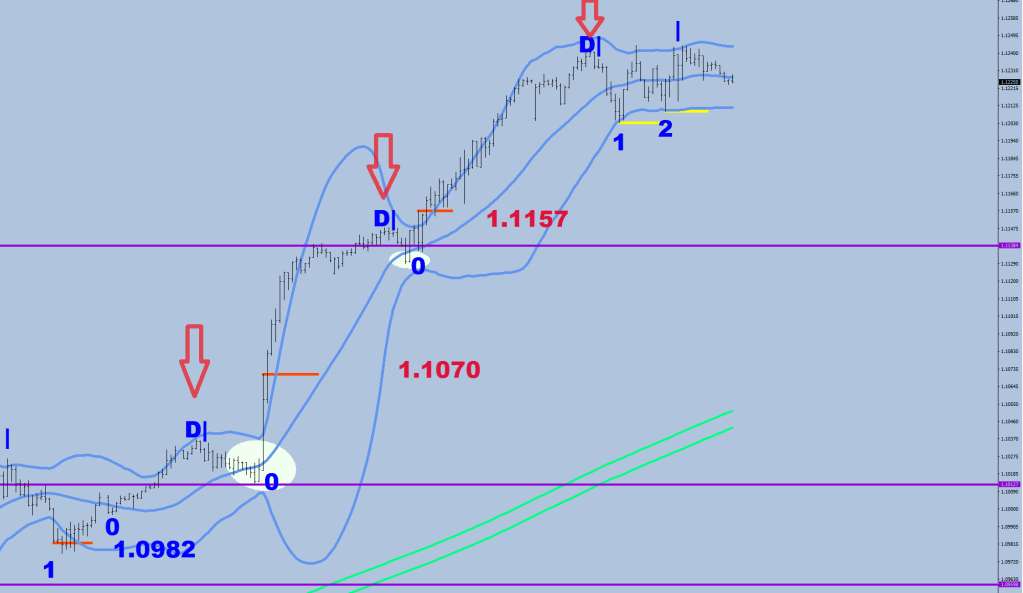
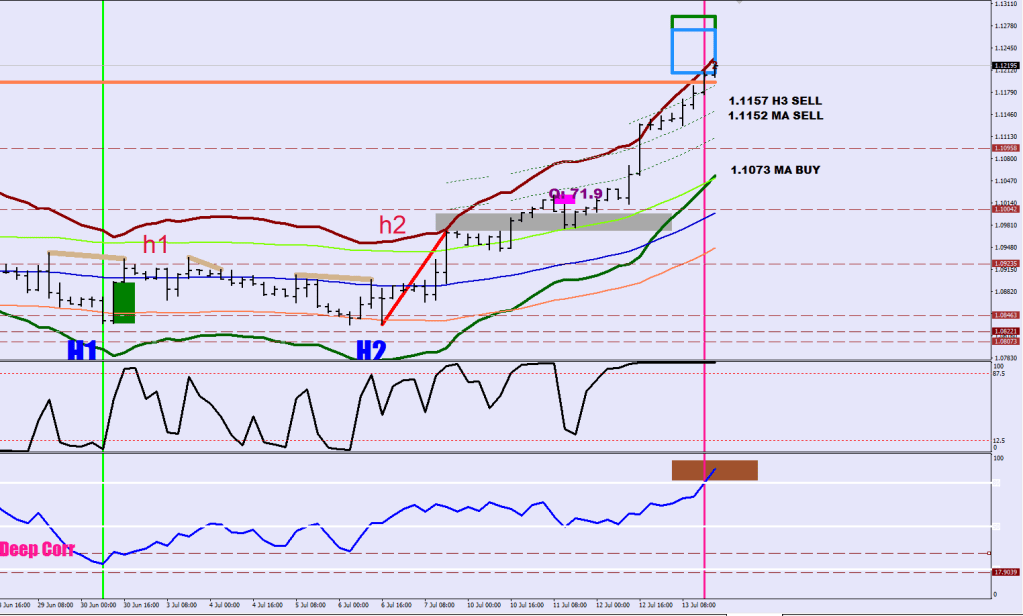
This idea of the “Wave 3” up on the Euro, that Pippoletto and others are beating away at…

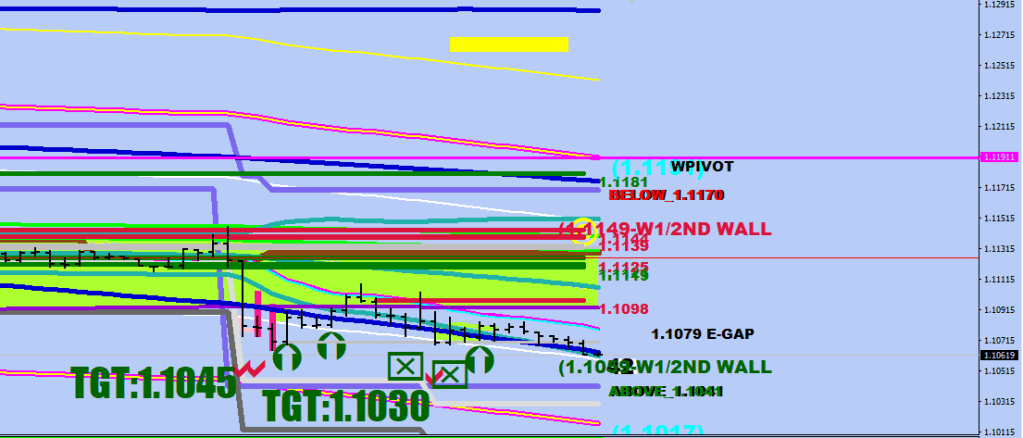
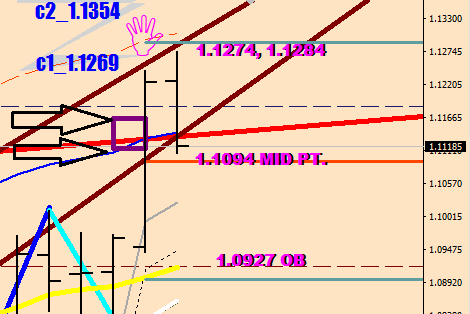
…does not represent the expectations of the futures markets. The further out we go in time, the more dollar strength seems to be the theme.

Remember, it is a relative game. The Dollar is losing its value, but this does not mean that this would be the overall case against the Euro.

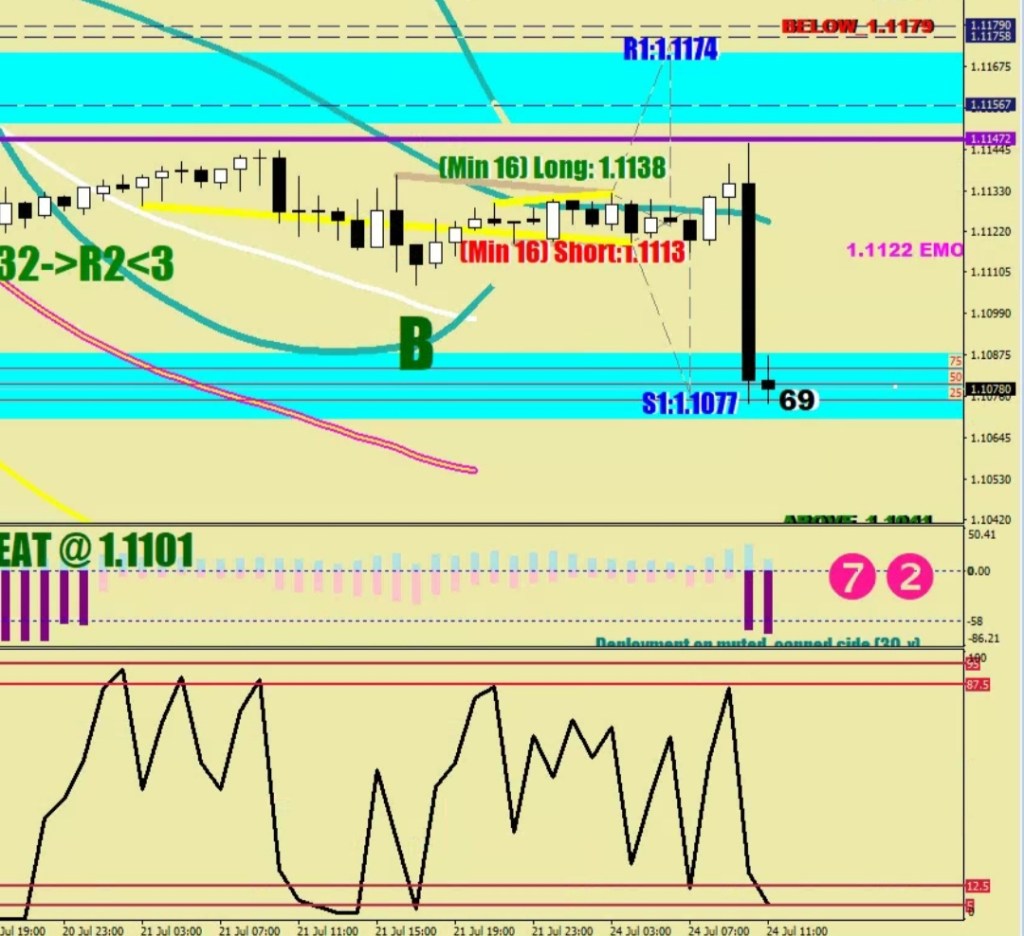
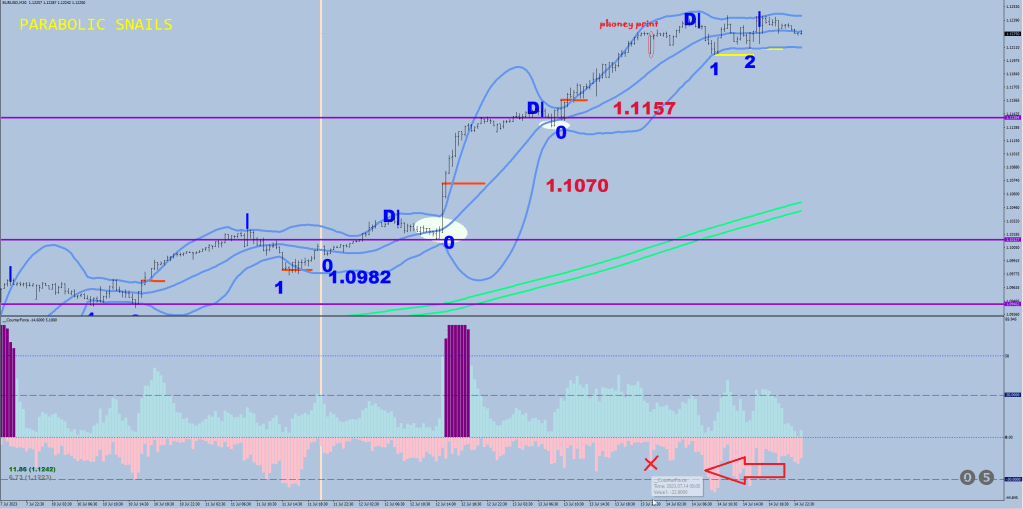
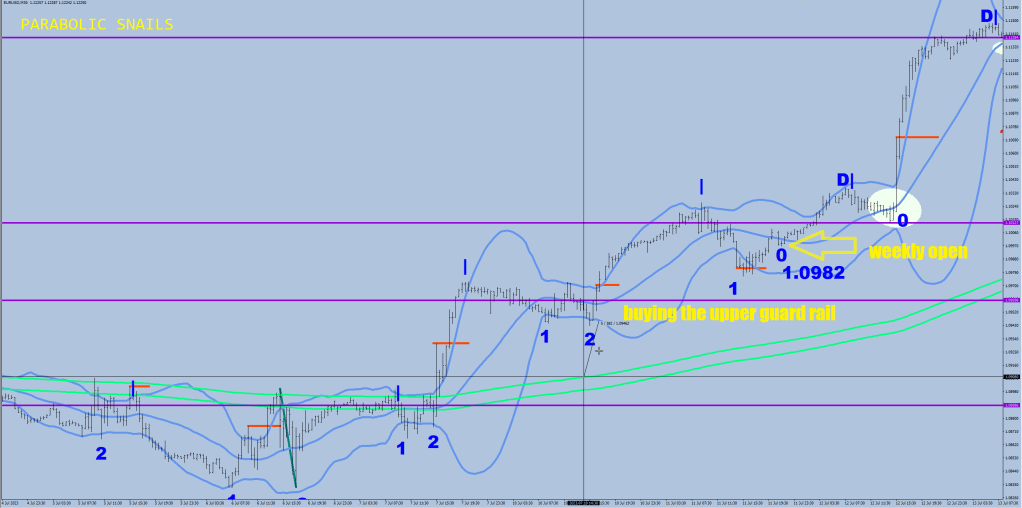
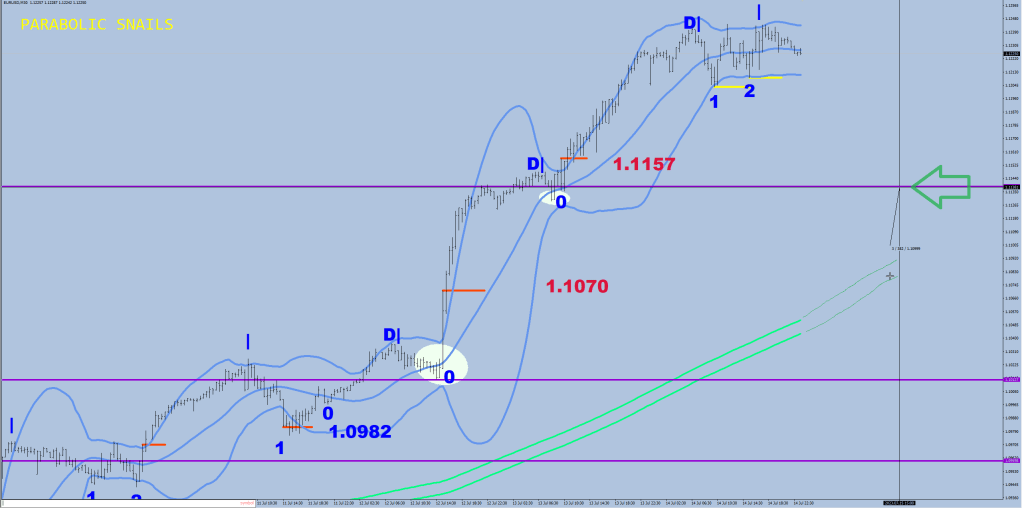
The Push of this run up was made, a “Wave 4” is now a whisper away from the “Wave 1”. A continuation divergence is about to print on the Daily chart.

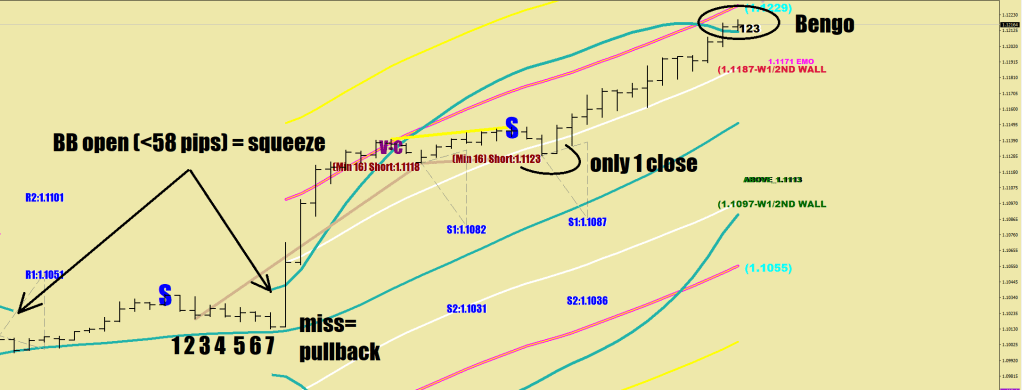
The Echo (quasi Wave 5) may or may not make a higher high. Typically there would be a beat anywhere from 1 to 64 pips, and do not forget, that the “Volatility Whip” when the Volatility bursts out of the compression can do the same thing as an Echo could, which is anywhere from falling short to making a 110-pip beat (at the end of a more complex / triple wave structure separated by continuation divergences “C” – see below).

B-Boys

Dear Streets of Earth City,

what was missing for a low? The second B.

2 examples below:

The two B-s were followed by a 60+ pips rally, then a liquidity break that either made a slight beat or fell shy of the last B.

What was the level to fail with the current, bullish configuration (E414>E712 by 27+ pips)? 3rd row.

Manipulacija or liquidity break? Either way, the resultat is the same.

Yellow line shows the divergence between the B fractal (which was a divergence end point itself) and the current move.

…and it’s broken.

Patient 0 gets a counter directional move verification.


    if ((((iBands(symbol,0,30,2,0,PRICE_MEDIAN,MODE_UPPER,i)-iBands(symbol,0,30,2,0,PRICE_MEDIAN,MODE_LOWER,i))*10000>58
    &&  Low[i]<iBands(symbol,60,30,2,0,PRICE_MEDIAN,MODE_LOWER,i) 
    && 
    (High[i+2]>iBands(symbol,60,30,2,0,PRICE_MEDIAN,MODE_UPPER,i+2) || High[i+3]>iBands(symbol,60,30,2,0,PRICE_MEDIAN,MODE_UPPER,i+3)
    || High[i+4]>iBands(symbol,60,30,2,0,PRICE_MEDIAN,MODE_UPPER,i+4) || High[i+5]>iBands(symbol,60,30,2,0,PRICE_MEDIAN,MODE_UPPER,i+5)
    || High[i+6]>iBands(symbol,60,30,2,0,PRICE_MEDIAN,MODE_UPPER,i+6)))
     ||
    (iHigh(symbol,0,iHighest(symbol,0,MODE_HIGH,7,i))-Low[i]> 520*Point && Low[i]<iBands(symbol,0,30,2,0,PRICE_MEDIAN,MODE_LOWER,i) && High[i+7]>iBands(symbol,0,30,2,0,PRICE_MEDIAN,MODE_UPPER,i+7))
    )
     && (iHigh(symbol,0,iHighest(symbol,0,MODE_HIGH,7,i))-iLow(symbol,0,iLowest(symbol,0,MODE_LOW,18,i+7))>520*Point
      || (iBands(symbol,0,30,2,0,PRICE_MEDIAN,MODE_UPPER,i+7)-iBands(symbol,0,30,2,0,PRICE_MEDIAN,MODE_LOWER,i+7))*10000>27
     
     )
    ){
          ObjectCreate("Palmat"+DoubleToStr(i), OBJ_TEXT, 0, Time[i], Low[i]+10*Point); 
          ObjectSetText("Palmat"+DoubleToStr(i), "pATIENT 0", 32, "Impact", DarkGreen);
          if (iBands(symbol,0,15,2,0,PRICE_MEDIAN,MODE_UPPER,i+4)-iBands(symbol,0,15,2,0,PRICE_MEDIAN,MODE_LOWER,i+4)<300*Point && iBands(symbol,0,15,2,0,PRICE_MEDIAN,MODE_UPPER,i+4)-iBands(symbol,0,15,2,0,PRICE_MEDIAN,MODE_LOWER,i+4)>260*Point) ObjectSetText("Palmat"+DoubleToStr(i), "pATIENT 0", 32, "Impact", DarkGray);
          
          ObjectCreate(0,"DRACHUPPER"+DoubleToStr(i),OBJ_TREND,0,Time[i],Low[i],Time[iHighest(symbol,0,MODE_HIGH,8,i)],iHigh(symbol,0,iHighest(symbol,0,MODE_HIGH,8,i)));
ObjectSetInteger(0,"DRACHUPPER"+DoubleToStr(i),OBJPROP_RAY_RIGHT,False);
ObjectSet("DRACHUPPER"+DoubleToStr(i),OBJPROP_COLOR,clrPowderBlue);
ObjectSet("DRACHUPPER"+DoubleToStr(i),OBJPROP_WIDTH, 8);

 ObjectDelete("Hallelujah");
              ObjectCreate( "Hallelujah", OBJ_HLINE, 0, Time[i], iLow(symbol,0,iLowest(symbol,0,MODE_LOW,3,i)) );
               ObjectSet("Hallelujah", OBJPROP_COLOR, clrDarkGreen );
               ObjectSet("Hallelujah", OBJPROP_WIDTH, 5 );
               ObjectSet("Hallelujah", OBJPROP_STYLE, 2 );

    }

Here’s what I think is going to happen.

H1 would be about 60 pips below the Lower Guard Rail on the 4H (cca 1.1040-1.1030)

(mirrored example)

h1 would come back up to the Upper Guard Rail (and a bit) cca 1.1180

H2 would make a lower low 1.1010 or just below

h2 would come back up to that 1.1180 level, fall shy of the h1

H3 would print at 1.097x -> break of h2, HH above 1.13

Capital Deployment

In space no one can see you smile.

Let’s talk legs up.

Inefficiencies & fair value gaps.

Two of these boxes turned out to be very useful.

1: The top of this weekly inefficiency was the target, slam dunk. The bottom of the range also is proving to be usable.

2. I don’t see why this weekly inverse full value gap was much use. Price went back and forth like it was not even there.

3. This weekly fair value gap gap was usable for support once price crossed over it.

4. The daily fair value gap did not get any closes below, so the bottom level was useful.

Now, when I said, that this Divergent Pitch followed by the 3 Bollinger Breaches was a temporary top, I used an indicator.

When I said, that this by itself wasn’t a top, because the volatility was too muted, I used an indicator.

When I said that the mean reversion’s targets are the Upper Guard rail, the 20-40 pips area below the Green River, I used an indicator, displacements and statistical, instrument dependent knowledge.

When I said, that this Push to the upside would be followed by an Echo I used multiple indicators, including my own inventions.

The little box’s top and and bottom are two statistically likely distances from the top for the Echo to come from.

Making indicators contributes to understanding some of these functions and shapes my thinking.

I used an RSI2 to recognize that the flat line had a 5-wave stucture to it.

But of course you knew all of these without any indicators, because there was a Reaper Breaker Inverted Fair Value Mitigation on the 15 minute timeframe. Do you ever hear yourself out at all?

Since I do need indicators, I made one for capital deployment.

Arrows show the “short loved” side’s entries.

if (ExtATRBuffer2[i]>29 && High[i]>BBU[i]-50*Point) BBU_[i]=iBands(symbol,30,30,2,0,PRICE_MEDIAN,MODE_UPPER,i);
if (MathAbs(ExtATRBuffer[i])>29 && Low[i]<BBD[i]+50*Point) BBD_[i]=iBands(symbol,30,30,2,0,PRICE_MEDIAN,MODE_LOWER,i);

Therapeutical 80’s dico music.

The Conveyor

D-bat day.

A divergent pitch is a conscious let go of a direction to free up resources and perhaps come back in with a little less stretch to secure faster progress.

When the same people / other eager participants step back in with force before the 30-min BB – just beyond the 30-min 30 SMA, that may be causing an enough of a surprise that can keep on expanding at or faster than the Bollinger Bands themselves. The time window to place the price on the conveyor belt from the 0 entry seems to be 4×30 mins.

Belt highlights in yellow.

If the above time limit isn’t met, a rally may still evolve: a top won’t be made during a squeeze.

When the 60-min 30 sample BB HL2 drops below 58, the bands are as good as not present. They won’t be able to start containing price until they expand wide enough. To gain overall volatility there would likely have to be a downside open soon.

The very reaoson for the above consolidation not breaking lower was the 4H money flow in need of a divergent beat.

Penetrating the powder box more than half way is clear intention to continue.

The h1 pullback should take price back below the 9-day EMA by 20-40 pips.

Picture below shows the 30-min volatility breaches counted 1-3. Conveyor not activated.

The Counterfore routine source was posted here earlier. 8-sample diectional stochastic readings (between bracket high/low &, current low/high), but I moved down to the 30 minutes frame in the meantime.

Winner, winner, volatility dinner. Downside volatity opening up to the numbers below which are in excess of 30 pips. Once past the buy limit, the volatility becomes l’art pour l’art.

Now

If God has a master plan, then only he master understands…

To the conveyor den…

Hungry like an evolve…

Show me what squeeze is all about… (what kind of marketing spiel is giving a German title to an album that has all English lyrics?)

I want to rape free…

Bibimbap

Reversal help.

Why now?

3rd Divergent Pitch print. Yes, but there’s more to it.

1st thing to metnion about the return of counter volatility is that there would be phoney prints due to the 10PM GMT forex broker re-balancing, where they smack up the spread to call in all nearby pending orders within 20 pips, see below.

Nevertheless, someone did end up turning off the buying program that did not allow dips to form in excess of 25 pips on Friday, see Arrow.

Hitting the lower Bollinger Band for the first time is also a clue, but remember, that the bands could contract below 30 pips, so the overall 30-pip dip criteria may not get fulfilled.

On a previous example, the buying wasn’t so extremely intense. The below 30 dips were more like counters. Again, count 3 was Dracula.

As you can see, the dip after the D Pitch went below the BB, but did not reach 30 pips.

The last example shows a volatility taper & explosion. The top wasn’t much further out

Either way, monitoring counter-directional volatility development is a great too to have, escpecially when price gets outside the Valley (Guard Rails).

The 3 mentioned “Trending” makets are very different from one another. Trending by itself does not say much. Parabolic? Channeling? Tapering?

As far as the correction goes it should have two legs where price would get below the 30-sample BB and show for 50+ pips of downside volatility.

9-inch Snails

Push (hand) and echo (house) stats. (Upside for now)

The purple boxes are there to help to give two likely levels to get in on.

With the current high not changing, it is 1.1163 & 1.1112.

There is a 3rd line that comes from the measurement maximums is 166 pips lower (cca 1.1078)

The shallowest push pullback are at about 90 pips.

Looking back all the mean reversions, the likelyhood is great that the entire move would not end before getting below the Green River (E9D) by up to 46 pips.

Total pullback legths were 90, 168, 97, 167 pips.

The echo peaking may be occurring the following week, most likely two weeks out, but there has been an example of a third week, and also worth noting that there was an echo that received a “time out” because of falling short after 2 weeks and price was headed lower to close the wave structure with toucing down on the S1 which is 250 pips lower from the push value.

No point talking about the c1 and c2 values and the target line just yet.

Hey now,

We want to know how this correction would go first.

Snapshots of 3 examples.

The likeliest route is the next one. A quick ABC with opressed volatility peaks (D-bats) and a terminal 46 pips below the Green Flow.

Bed Of Snails

The pitch.

It’s a bat. It’s a bet.

The divergent pitch. First, on the hourly. RSI2 divergences marked with red (S, arrow). Prompting some sort of corrective movement.

On the 30m, you are looking at the same 3 pitches. See that these pitches fall short of the 30-sample BB top.

See how the response for the first two was getting in just below the 30 sample SMA, before the lower BB (white oval+zero).

The last time was different.

We got a Blush Response called Capillary (1) and Dialect (2).

Short histoty.

Before last week they overwhelmed the Dialect Response at the open with an aggressive buy, the market was already being kept out of the E9 Valley which is the 414 EMA band on the 30-minute. The valley’s limits are 1 fluctuation maximum away from the EMA band, which is 38.4 pips. That’s the measurement plotted between the Response and the Green River.

extern double FSize=32;
double FMax = FSize*6/5;

The future.

The most likely areas to be revisited on a “Mean Reversal”, are the Upper Guard rail, the Green River itself and the area below the Green River to the Lower Guard rail. These numbers would change dynamically, but I did plot where I think the rubber would meet the contact lense. That arrow is where the Upper Guard rail may arrive on Monday / Tuesday.


This guy is very good. If only he took a couple of lessons from me, he could be perfect.

Snail In The Coffin

After a million identity crises, here it is finally.

Two breakdown levels are prepped – in yellow.

To remain in a wildly strong uptrend there should be no 4H closes below 1.1157

To remain in a strong uptrend there should be no 4H closes below 1.1070

If you are a true bear, you want to see 1.0982 regained on a 4H basis to call the entire run up a fraud.


Some music you would likely have never encountered not visiting my blog ๐Ÿ™‚ I think I finally managed to outdo myself.

Preying In Reverse

Mantis, look at this!

The idea has landed. I always use the stoplosses for codes to target something. I have never used the targets as codes to adjust stop losses until now.

The thing about a parabolic market that it would alight before it wants to get off.

It is a sign of a parabolic move in itself that price does not touch one end of the 30-sample 30 minute BB. When it finally does, there would be one final hurray that is likely going to tag the other end one last time.

It is a rather differrent concept for me to dwindle on. Instead of cutting your position short, manage the stop loss at the right distance.

Keep away from the band by 10 pips and even out the bulges. First step is to feed the last 36 values into arrays.

for(i=0; i<36; i++)
     {
      band30u[i]=iBands(symbol,30,30,2,0,PRICE_MEDIAN,MODE_UPPER,0);
      band30l[i]=iBands(symbol,30,30,2,0,PRICE_MEDIAN,MODE_LOWER,0);

/////Short StopLoss - Code 333 30M BB -10

if( OrderType()==OP_SELL && OrderTakeProfit()==.333 && OrderStopLoss()!=band30u[ArrayMinimum(band30u,35,0)]+100*Point
 ) 
     {  OrderModify(OrderTicket(), OrderOpenPrice(), NormalizeDouble(band30u[ArrayMinimum(band30u,35,0)]+100*Point,5), OrderTakeProfit() , OrderExpiration());
//           Print("SHORT StopLoss Set to 30M BB @ "+DoubleToStr(iBands(symbol,30,30,2,0,PRICE_MEDIAN,MODE_UPPER,0)+100*Point,4));  
           }    


/////Long StopLoss - Code 333 30M BB -10

if( OrderType()==OP_BUY && OrderTakeProfit()==3.33 && OrderStopLoss()!=band30l[ArrayMaximum(band30l,35,0)]-100*Point 
 ) 
       { OrderModify(OrderTicket(), OrderOpenPrice(), NormalizeDouble(band30l[ArrayMaximum(band30l,35,0)]-100*Point,5), OrderTakeProfit(), OrderExpiration());
         // Print("LONG StopLoss  to 30M BB @ "+DoubleToStr(iBands(symbol,30,30,2,0,PRICE_MEDIAN,MODE_LOWER,0)-100*Point*Point,4));
         }


The Money flow beat projections do amount to something after all albeit the caveat is that the parabolic market has to make it ouside the BB like afore mentioned.

The 2x failure at the Stratosphere line does still mean something. The TY scissor is opened to 47 pips, that’s extra bullish. No move is likely to make it below the 9-day EMA band by more that 20-30 pips.

5.8x stretch from the mean still amounts to something (white line is 5x). A normal market would shy away by 4x. Even if it is opex Friday.

Radio killed the video star.

Little Known

Unknown unknowns.

A parabolic market starts off with a 7hr pullback + squeeze, then stays outside the Stratosphere / 8 emo  (max. 1 close over)
The parabolic move would make it outside the 30BB.

The market is going from powder box to powder box making H1-h1 H2-h2 H3-h3 sequences, where the h2 box either holds as a support, or it gets broken. The first hump after the back tedt gets a H0 count.
The initial penetration starts a counter. If 14 manages to keep out of the box by more than 50%, you are home free.
If 14/15 makes it over 50%, a continuation in the same direction is expected – from H3.

A quick drop away from the powder box is a mean reversion to E9D.

Current image: