We’re gonna do a song that you never heard before.
Rambo Italiano.
Sequential analysis
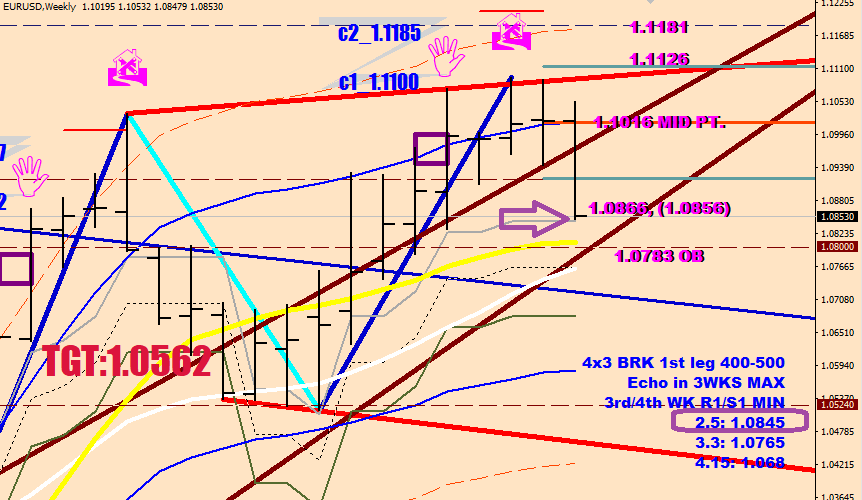
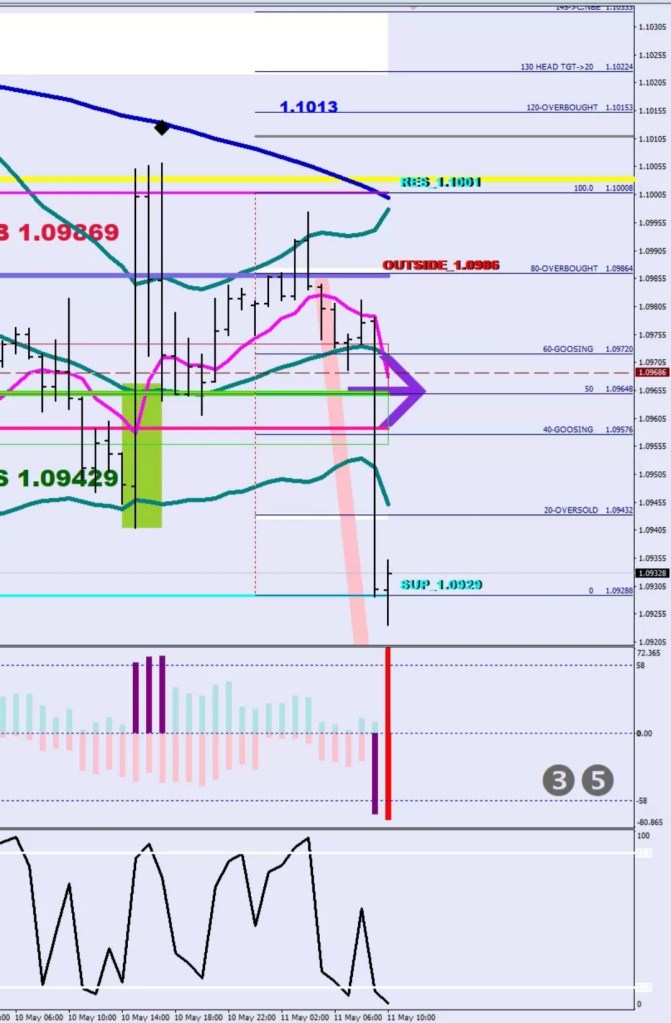
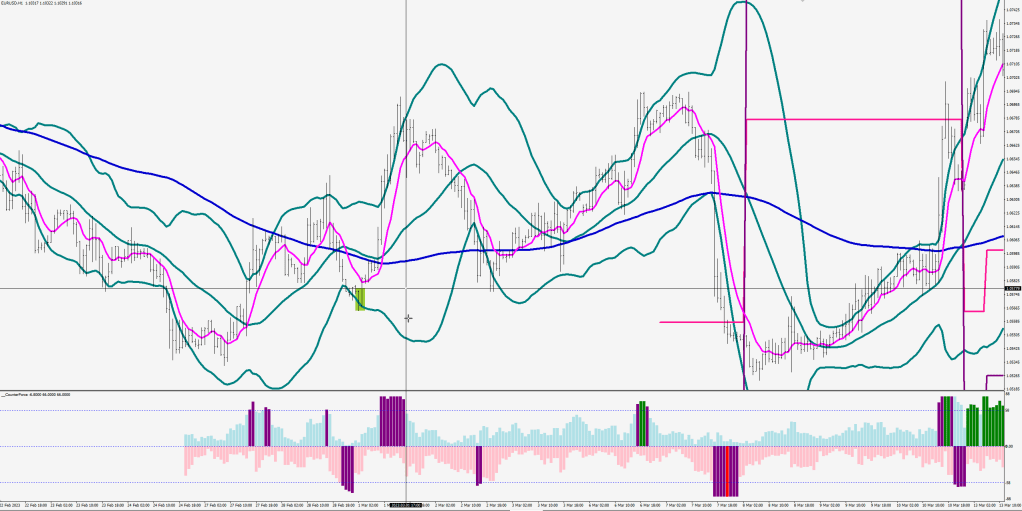
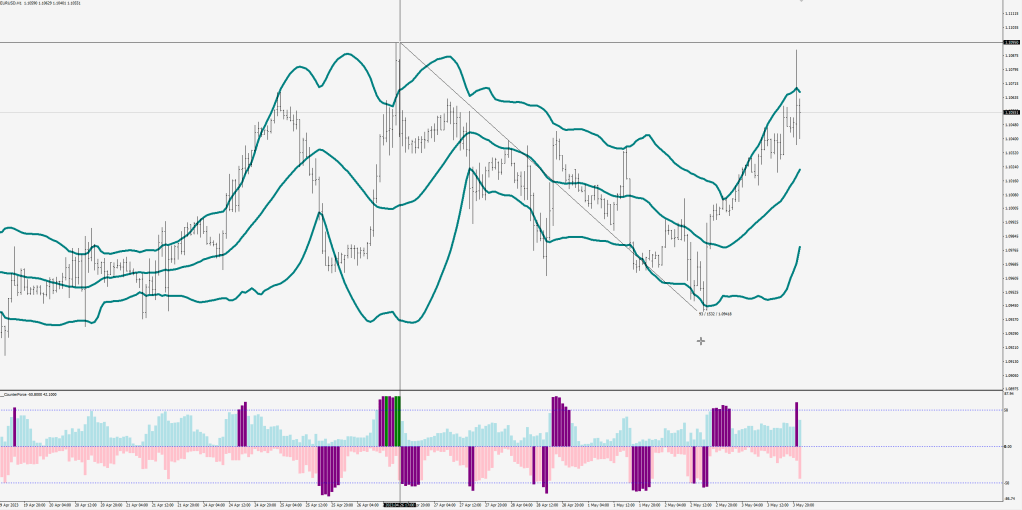
1st image: the importance of the S1 in this current uptrend.
Wave 2 and Wave 4 of A both had bounced off this very level. Even the B wave down ricosheted from it, after a re-alignment with an ABC move.
The downtrend was a lot more volatile. Seriously, the largest dip below the S1 so far was less than 4 pips!
I guess I killed the punchline. The sequential analysis can tell you with good odds if the price is in
a Push (hand) beyond the 14-sample Window envelope (Blue)
in an Echo (House icon) after a pullback to the purple square – or most likely time is up for this move (3 weeks beyond the push max.)
or performing a return (back from the House icon) to one of the 3 support / resistance lines (“HOME”) (or just arrived at one)
S1 is 250 pips from the last Echo print.
I believe this may have been the Wave 2 of Wave C, and yes, we are headed back up to 1.23
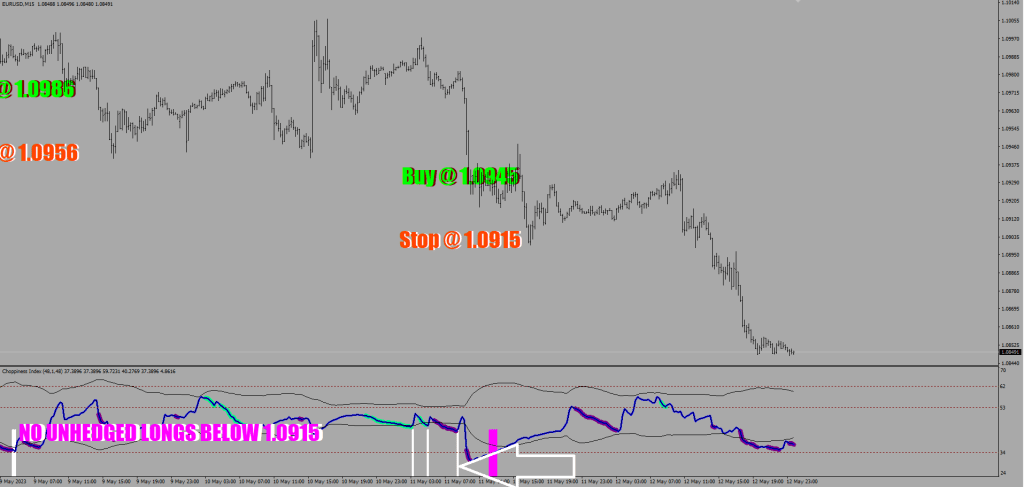
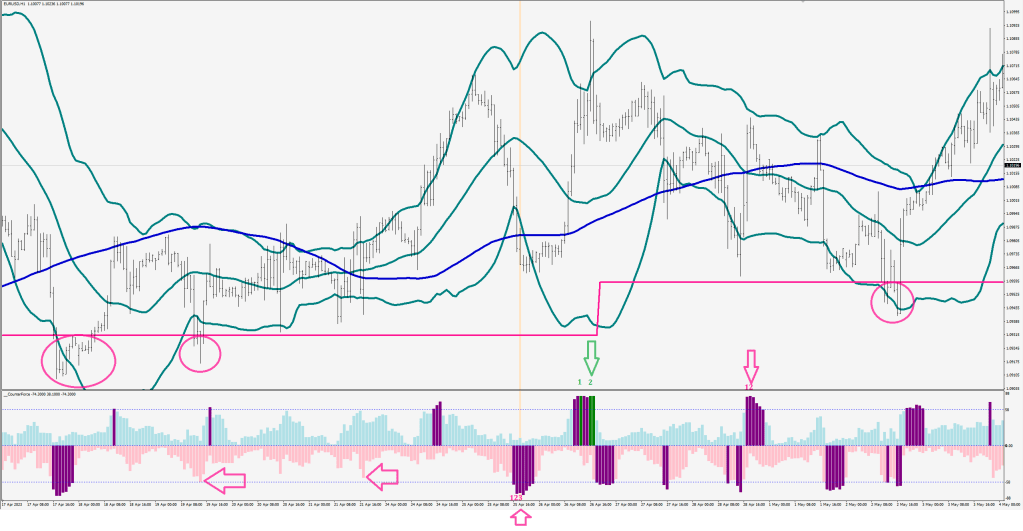
Let’s Rabbit guidance
A rabbit is an energy surge measured by Choppiness.
The White arrow shows the last White Rabbit. A Rabbit is a 30-pip range, where price may turn around. When the stop is surpassed, the Rabbit is broken. Hedging is a must.
The Magenta strip is a sign of deep exhaustion, it guarantees a lower low (or higher high based on the direction).
The Rabbit that broke its neck, broke the internet.
I’m the one to be the one, but my butthole is confused.
Somebody is posting strawberry eating rabbits on Twitter.
16 hours of attaining no counter directional volatility expansion is a call for a continuation entry.
You can always find a level afterwards that was nearby at the time. This is why I told you that time was more important than any price level.
But what’s your edge from there on? Taking price oversold yet again (now within the new consolidation range)? Below the zero price becomes overbought again (need to change those labels).
imagine numbers above the candles in the box
Squeeze highight (16 sample range that is less than 1/2 fluctuation size in width)
I thought I would explain some of the dynamics a little more.
The first thing to understand better is the failure level, which is 40% outside the statistical range (pendulum) drawn around the condolidation weight. I drew in the black line for you. That line has been in place since the last CI cross over above 53.
The white field is 57-68 pips away from the TAXI line, which is the consolidation mean, and as I mentioned before, the failure level is about 60 pips out. It is also about 10 pips shy of the Goldilocks level, which if it was hit would grant further rights for a no break extension move.
The second thing is the re-emergence of the red CounterForce signals. With a 6-hour delay this would eliminate the current S1 and S2 levels and use these lines from then on to represent R1 and R2.
If you follow the black arrow heads, you can see how the S1 line is yielding to the new born R1. S2 does the same for R2.
For the code, see the CounterRejoyce blog entry.
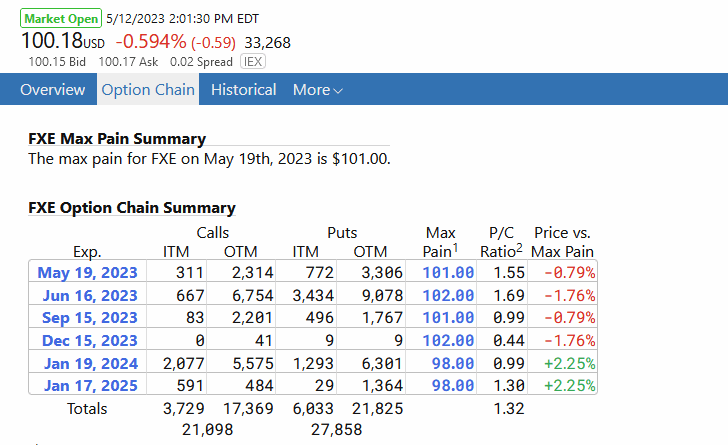
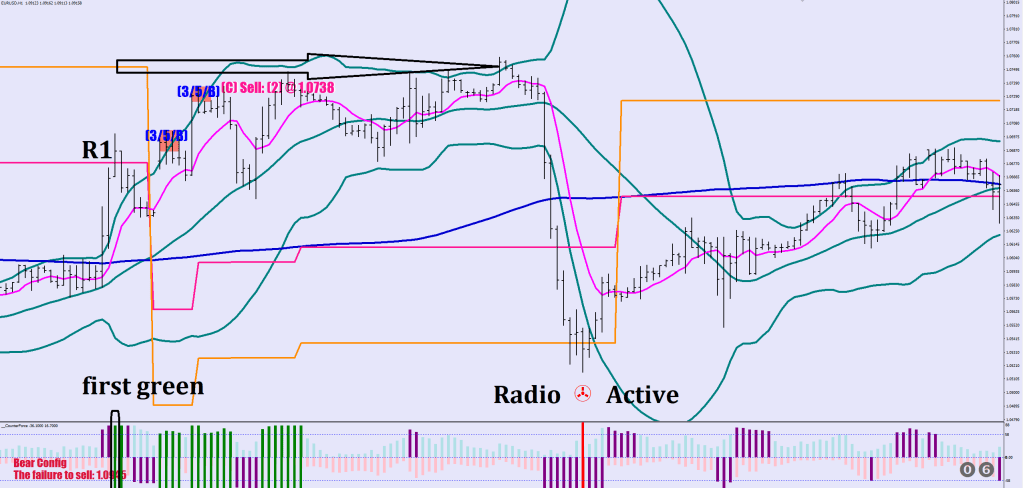
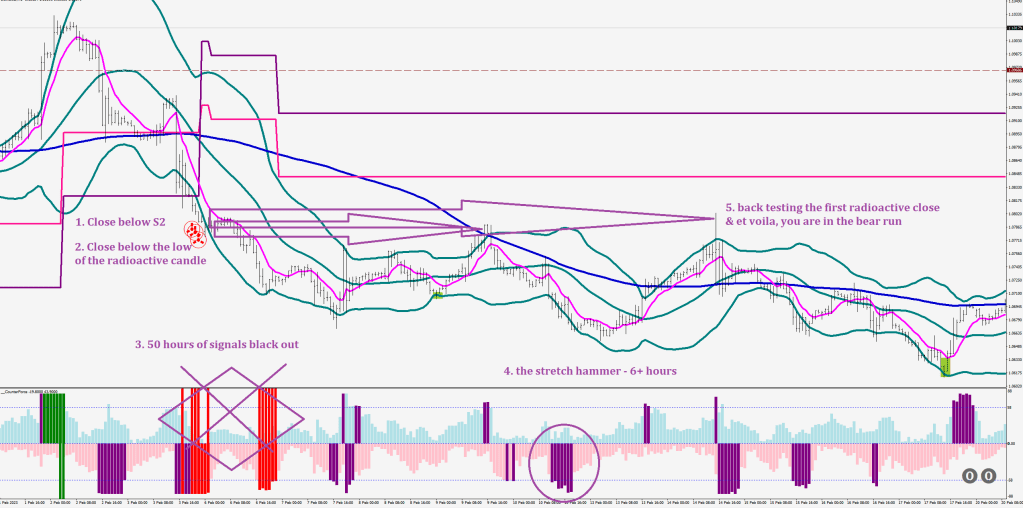
Now, let’s pull up an example of what preceeds a radioactive close.
For a radioactive close outside you would need the S2 to be re-applied, so counter-intuitively enough you would need Green Stretch Marks appear which would mean at least a 58+ pips stretch upwards. I highligthed the first green that coincided with a move above the R1. See how the S2 although was removed, price ended up coasting all the way to where it at was prior. It is also a possibility currently that price could make it to the where the S2 was, at 1.0885 – barring the Opex Futures expiration level to be adjusted by tomorrow. It now stands at 100.50 on FXE and that would mean price to settle at least 30 pips higher than where it is at at the monent (1.0916).
By the way, the radioactive print saw no continuation on the example above, as there was no close below the low of that candle. Multiple flips of resistance and support configs are also possible as you can see.
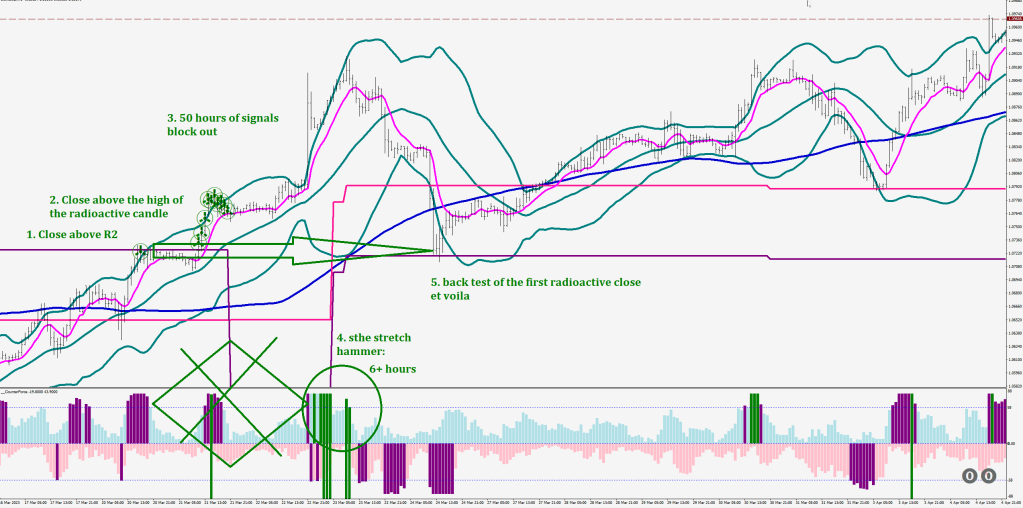
I have already talked about the stages of the start of a run including the signal blockout hours.
I started posting in 2017. I had views of a single entry reaching 200+. Hitting new lows again, yesterday’s post had 2 views so far. Time out & some stuff to indulge with if you like to use your imagination and perhaps solve some things along the way.
Autumn leaves, but does it, really? You are about to decide between working for The Toothpaste Management or the National Whale Services for the remainder of your time. As one big human falafel, writing is no longer of your concern.
…
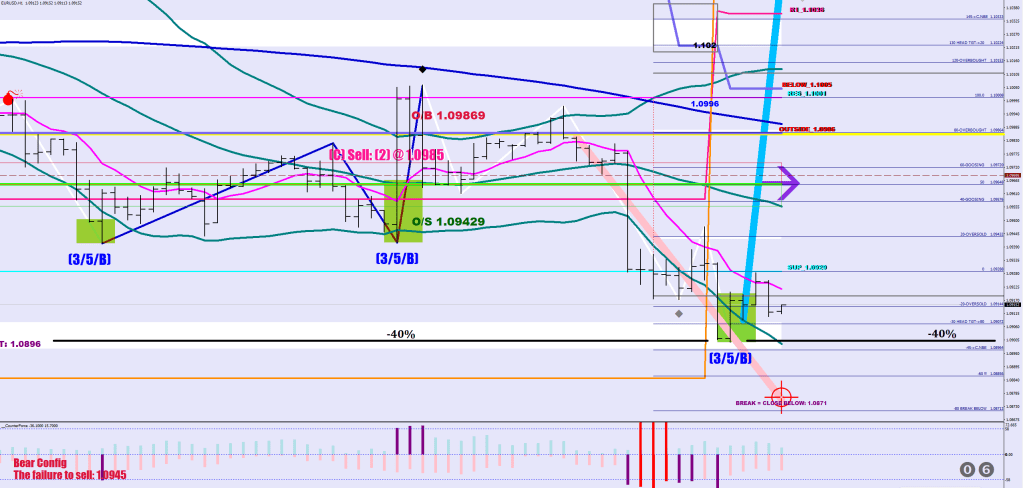
The first red print since the 1.07x low would change the config to bearish and would plot the R1 at 136 pips up from the low, currently this would mean 1.1060.
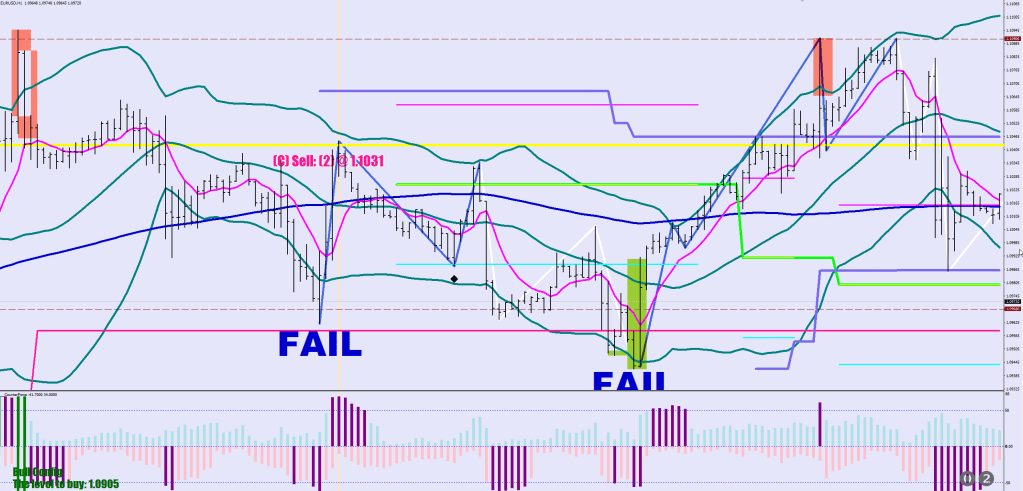
As Leon, the perpetrator said, the last thing you need to learn, is the close combat. Knife Fight in our case means getting the wave structure right.
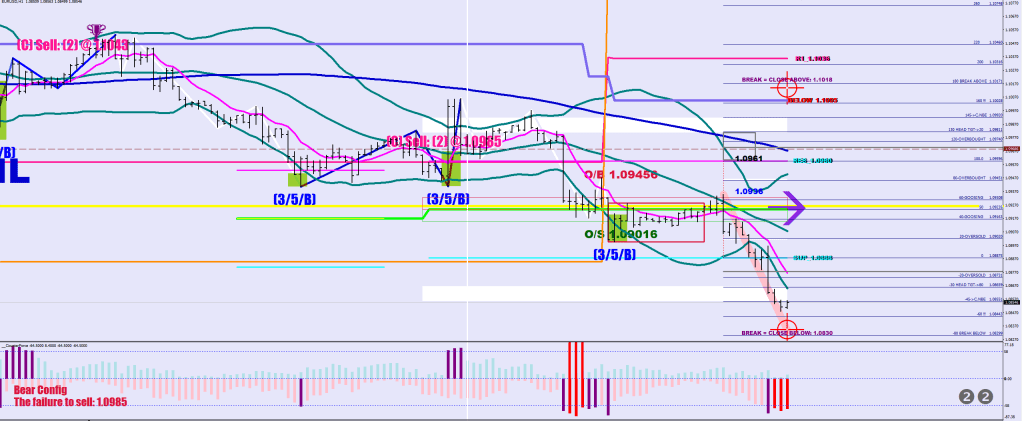
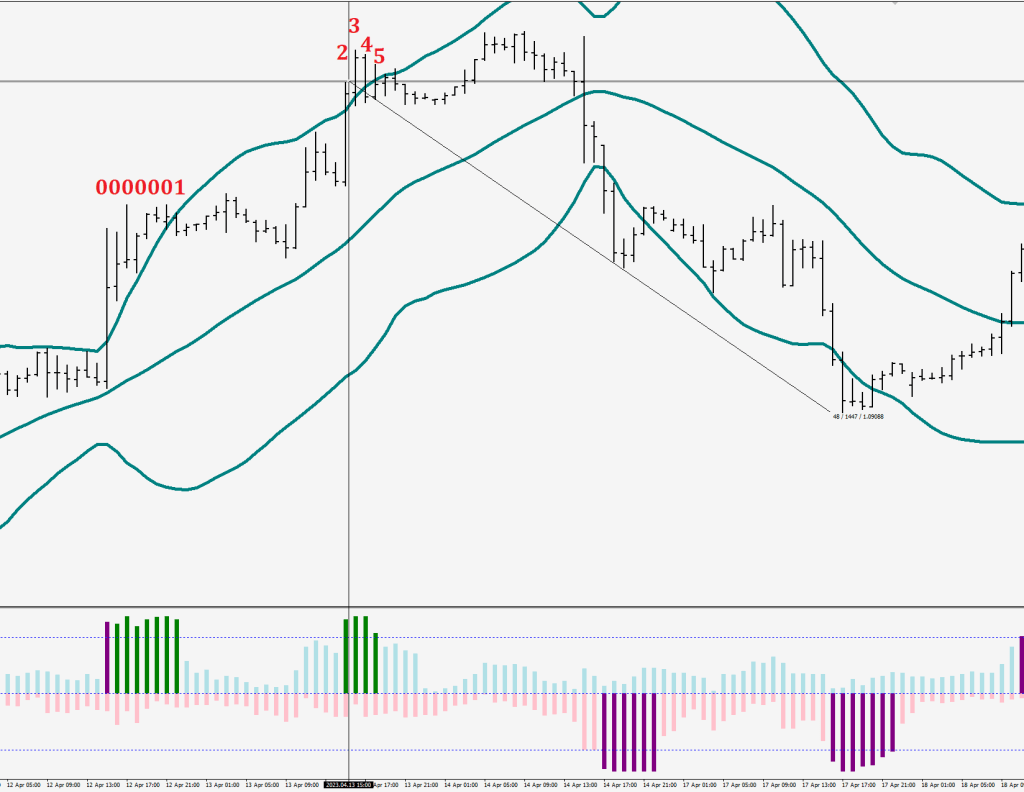
I made one mistake on this image:
Thanks to the new”C, sell W2″ pullback plot I can now say that the move up, that was looking like one continuous impulse move was infact an ABC move at a very high speed. This brings me to an interesting dilemma: I called this “No challenge of volatility”, but was there no challenge when price did show up at the rink only it brought Adidas to a knife fight?
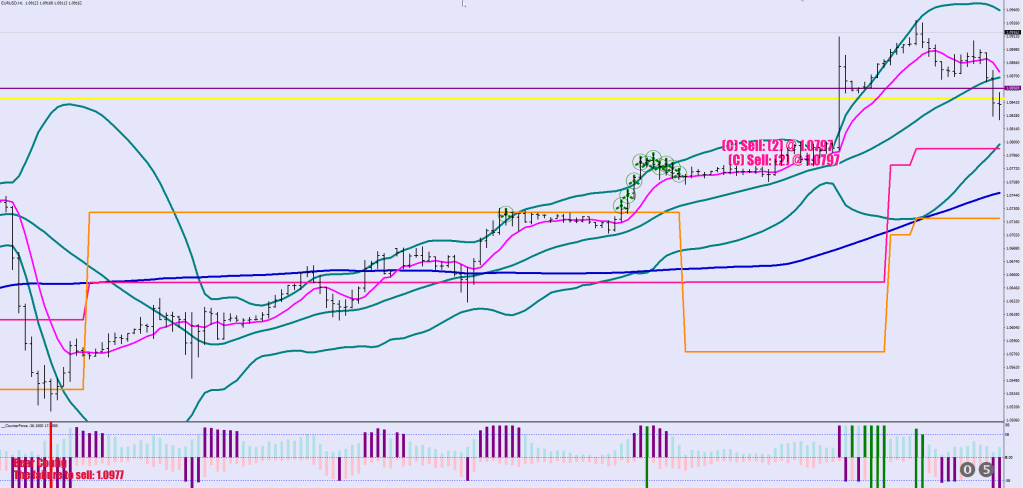
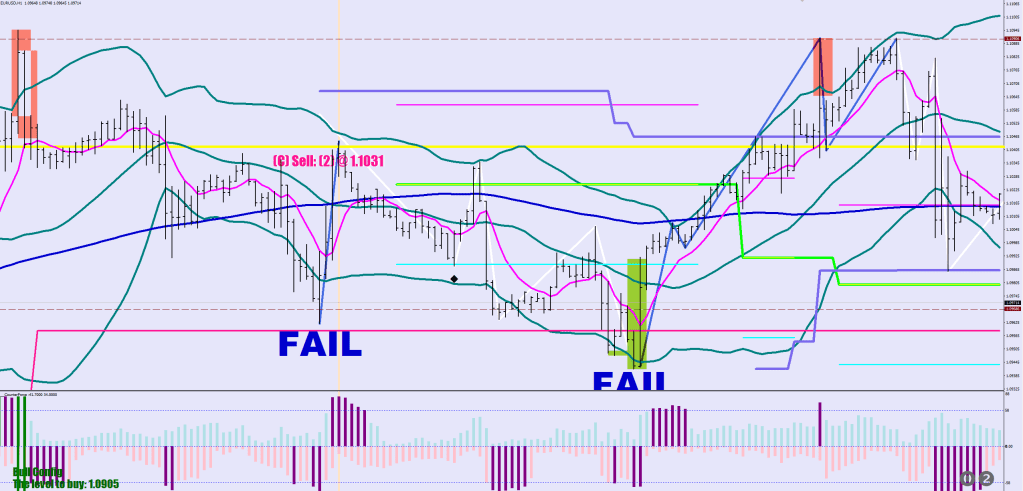
Corrected image below:
I’ll spare you the zoom in.
Tom Hanks to RSI2, I do keep an eye out for continuation divergences I.e. the one between wave 2 and Wave 4. I did get in on this short for instance.
This brings us again to Elliott Beethoven. Can you patent subjectivity?
I have learnt the 5 wave structure by experience, by using RSI2 HL2 on the hourly and naming a certain divergence a continuation divergence.
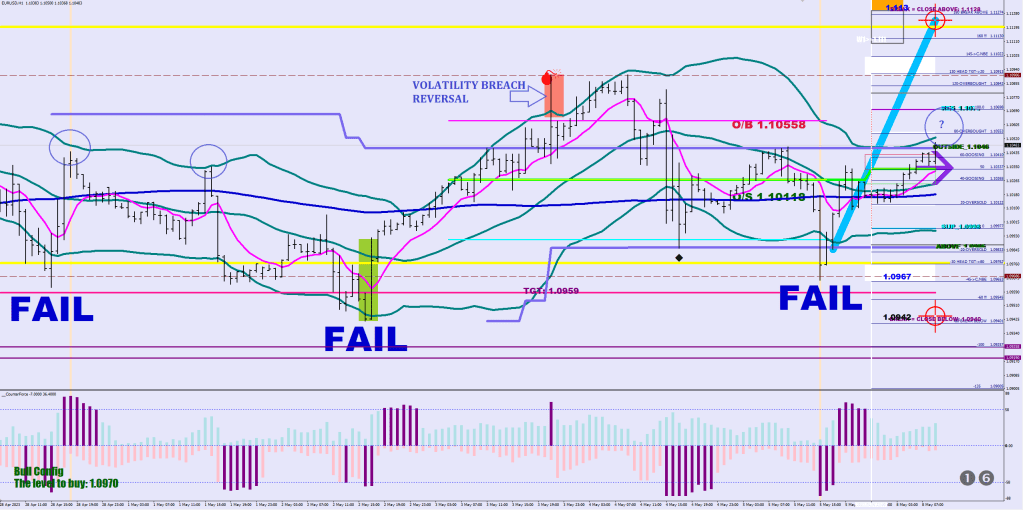
I decided on giving a plot to a Volatility Breach Reversal, found that this is great guidance for where that Wave 3 possibly ended, and saw that this was good.
Yet it isn’t me who is arrogant here. I don’t start sentences like “I still think” (which is only a smidge shy of “why don’t you” or “my frined”) like FX Pippoletto does, whom came in as number 2; not that he has nothing to learn from, but this is not condusive with being inconclusive.
So, what was this period after the 5 waves down? Coda. Sonido electronico. The gear selector. First Gear 3 was selected then Gear 5. Now we are in the run up. Maximum 5 hourly closes below the 8 EMO would be allowed.
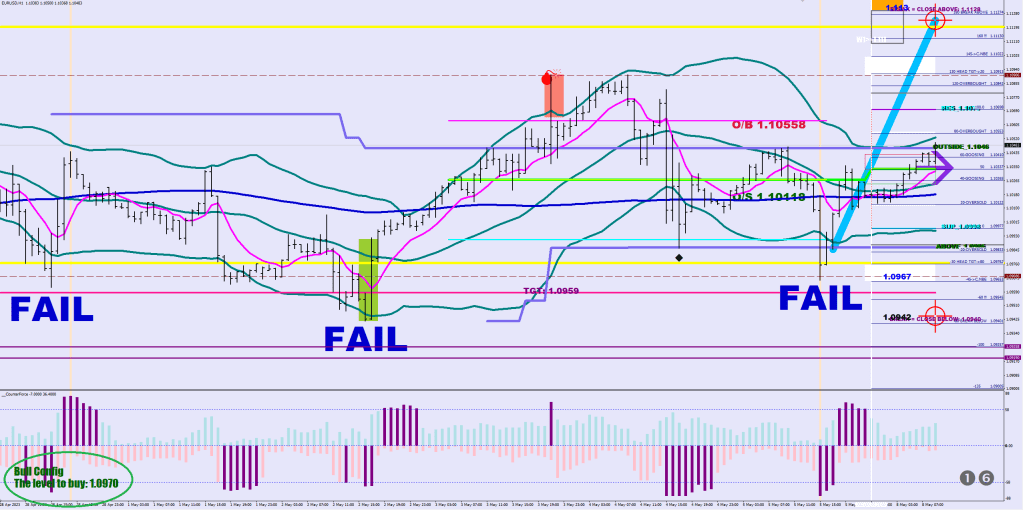
Going into the day, you can already know two things.
1. the configuration
2. the level to fail at
The configuration is the presence of R1 & R2 or S1 & S2 – see the CounterRejoyce routine.
The level to fail is based on the last 15-minute consolidation candle (where full charge was reached measured by the CI) and the distance is the 3-day ATR less 20 pips. There is no math to this, only stats.
Now, the scope of this article is to determine where the move away from the Fail levelel may yield another failure – in the opposite direction.
There are 2 main directional fail conditions.
One is above the highest close of the second “Green block” i.e.:
or a Volatility Breach Reversal – posted in the blog entry titled alike.
The last thing to contend with is volatility for the 3rd time. There may be a failure caused by the inability to challenge the upper 30-sample Hourly HL2 Bollinger Band, but as the previous example shows, there may be multiple attempts and I would not put my money on this event cutting the run short.
If you need to know how I can look back and find prior failures when all I plot is from the last 15-min failure, I have a continous version on the 15 min, and I can measure approximately 60 pips from the actual consolidation mean, et French.
It also seems to coincide with the white block, which is 30% outside the pendulum (in geek again).
Other than that there is nothing like the contrast of hevy metal and weightlessness.
In MT4 you cannot have the same routine make continuous plots both in the chart window and in an indicator window.
This is why I had to make this duplicate alter ego, since I wanted the statistical buy / sell level plotted at all times.
Now you have no choice but to rejoyce.
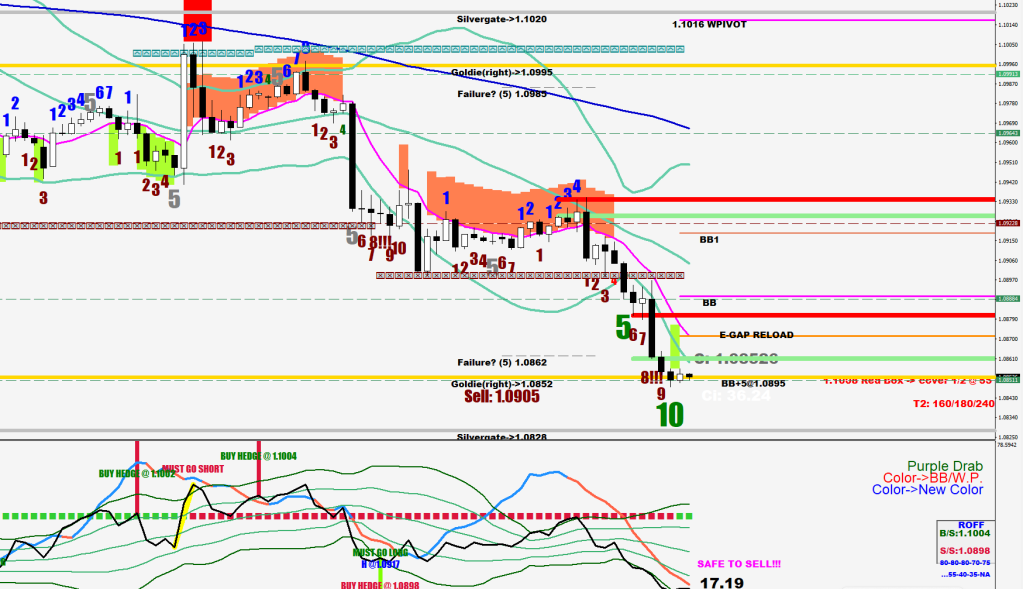
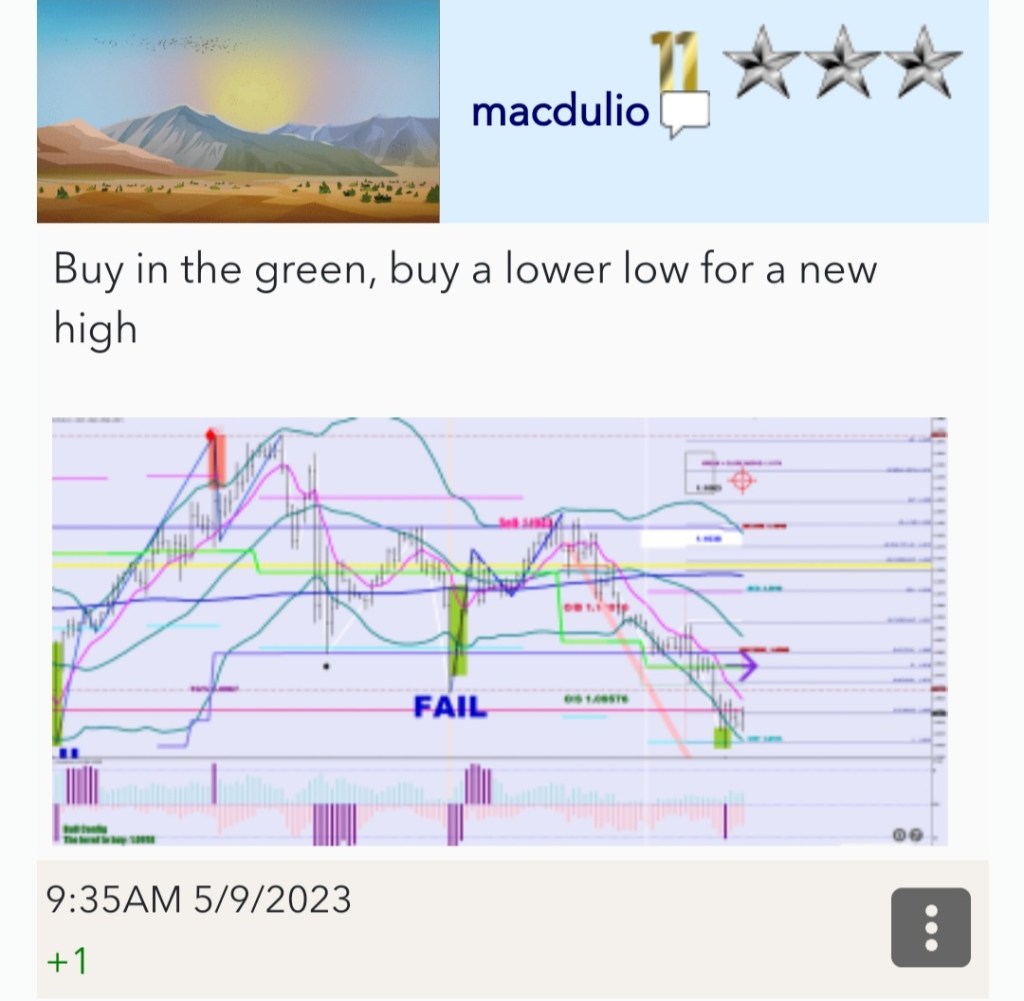
Here’s the buy, where it all happens.
After the buy, the bigger stretches are the entries, say 50 or more in the negative or the 3rd purple print arrives. The Run Up is on until the second Green print appears. As mentioned before, a full body outside the Bollinger diqualifies the counter for the first count. After the close of Green 2, the market is in the correction, down to the joyce line. Similarly, the get in is the 50+ stretch of the 2nd purple close.
A quick lesson on why quick lessons are important.
Apply the new filer changes & zoom out.
if (High[i]>iBands(symbol,0,216,1.8,0,PRICE_MEDIAN,MODE_UPPER,i) && (iBands(symbol,0,30,2,0,PRICE_MEDIAN,MODE_UPPER,i)-iBands(symbol,0,30,2,0,PRICE_MEDIAN,MODE_LOWER,i)>1100*Point || Low[i]>iBands(symbol,0,30,2,0,PRICE_MEDIAN,MODE_UPPER,i)) && ExtATRBuffer3[i]>0) ExtATRBuffer4[i]=ExtATRBuffer3[i];
 if (Low[i]<iBands(symbol,0,216,1.8,0,PRICE_MEDIAN,MODE_LOWER,i) && (iBands(symbol,0,30,2,0,PRICE_MEDIAN,MODE_UPPER,i)-iBands(symbol,0,30,2,0,PRICE_MEDIAN,MODE_LOWER,i)>1100*Point || High[i]<iBands(symbol,0,30,2,0,PRICE_MEDIAN,MODE_LOWER,i)) && ExtATRBuffer3[i]<0) ExtATRBuffer5[i]=ExtATRBuffer3[i];
}
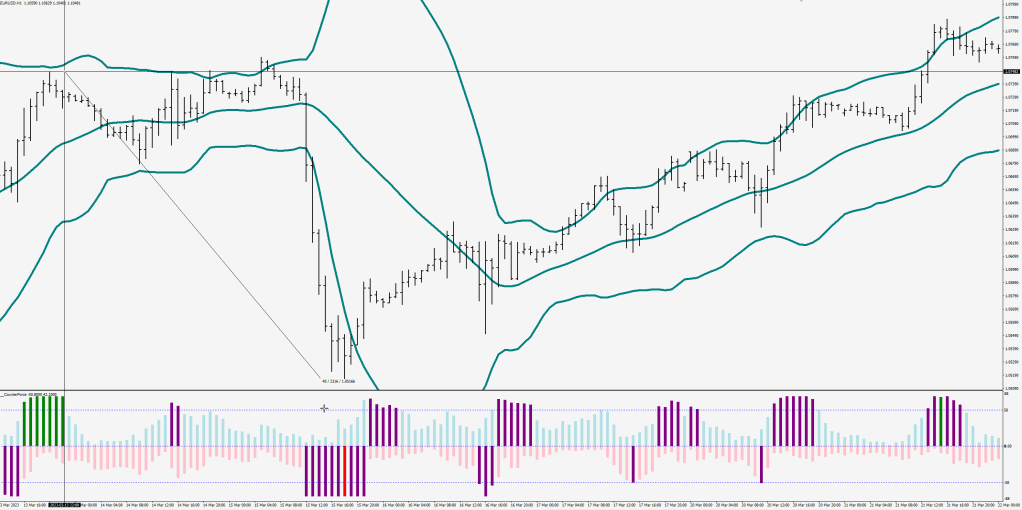
What do you see?
Can taking volatility measurements and applying some filters tell you the type of the market at a single glance? Look at the green and the red highlights. Which is more? Are there streaks of reds? Aren’ those 3 lows make up a line?
I’ve got the predicting power
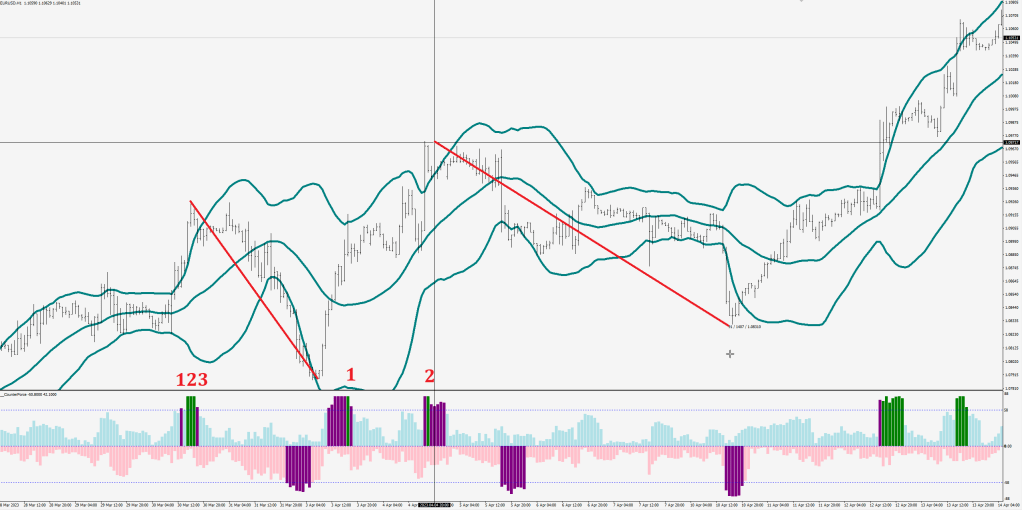
3 images to make a point about them streaks (gatherings).
The streaks are followed by a correction that is in excess of 136 pips, and may get as deep as 220.
This sounds as some rather tradeable information.
One of the ideas I introduce at this point is the need for at least 2 green strike outs where the first one cannot have the entire body of the hourly candle outside the 30 sample hourly BB (HL2).
Only one question remains. Is it not an issue that there hasn’t been a single green stick on this current run up?