The head depth is 130% (58 pips) of a fluctuation maximum (45 pips) from the consolidation mean.
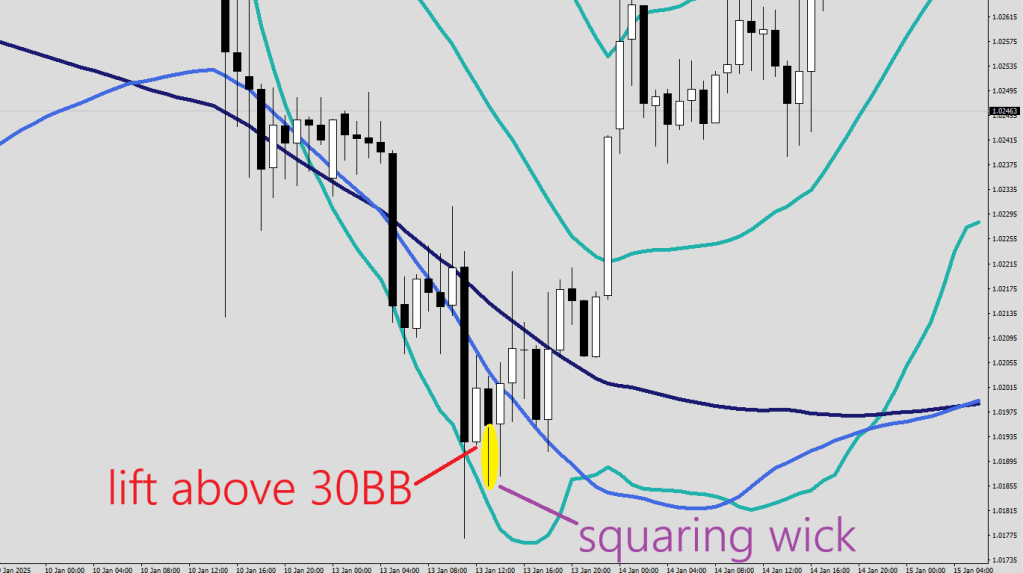
The next move based on history should be to counter this top with an hourly candle print outside the 30BB, like so:
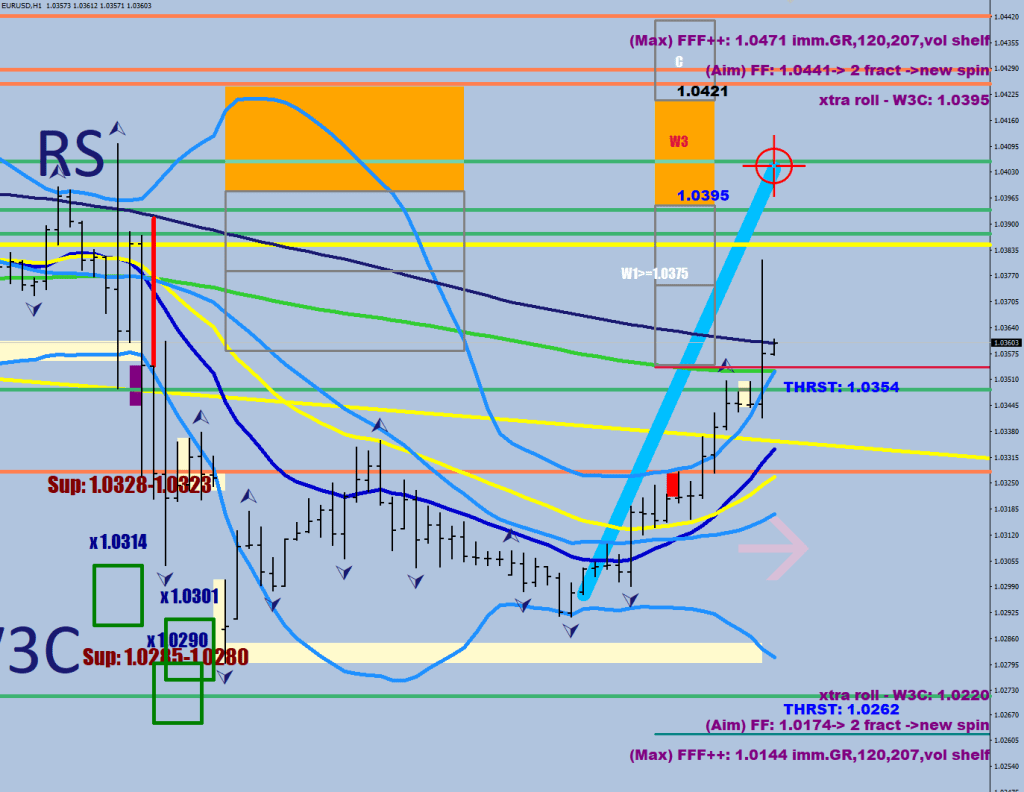
A head distance is shy of the area that comes with a new dice roll flag, not by much. Nevertheless, merely 10 pips more would have registered as a W1, and continuation would have been an option.
The one curveball in my opinion would be if they would buy the oversold level (1.0348).
Spike that is. From the green box, into the trendline… likely back into the green to rotate to the low.
Trendline resistance + E-98 8H resistance.
R1 was at 1.0378, high was at 1.0381.
I am 5 lots short. I have a sell stop at 1.0269 for a quick trade to 1.0249.
The minimum downside target matches the low at 1.0171.
Could this wick printing here be a runway for later? Certainly could, the question was the next move down.
Could they buy the no-break extension at 1.0262 and start a wave 3 up?
This was a high-volume churn up, likely the end of a leg.
It may look bullish, but the up leg has fallen shy of a W3C print or even a Goldilocks (yellow horizontal).
If the high gets taken out next, that would be bullish. Currently, this seems to be a swing high.
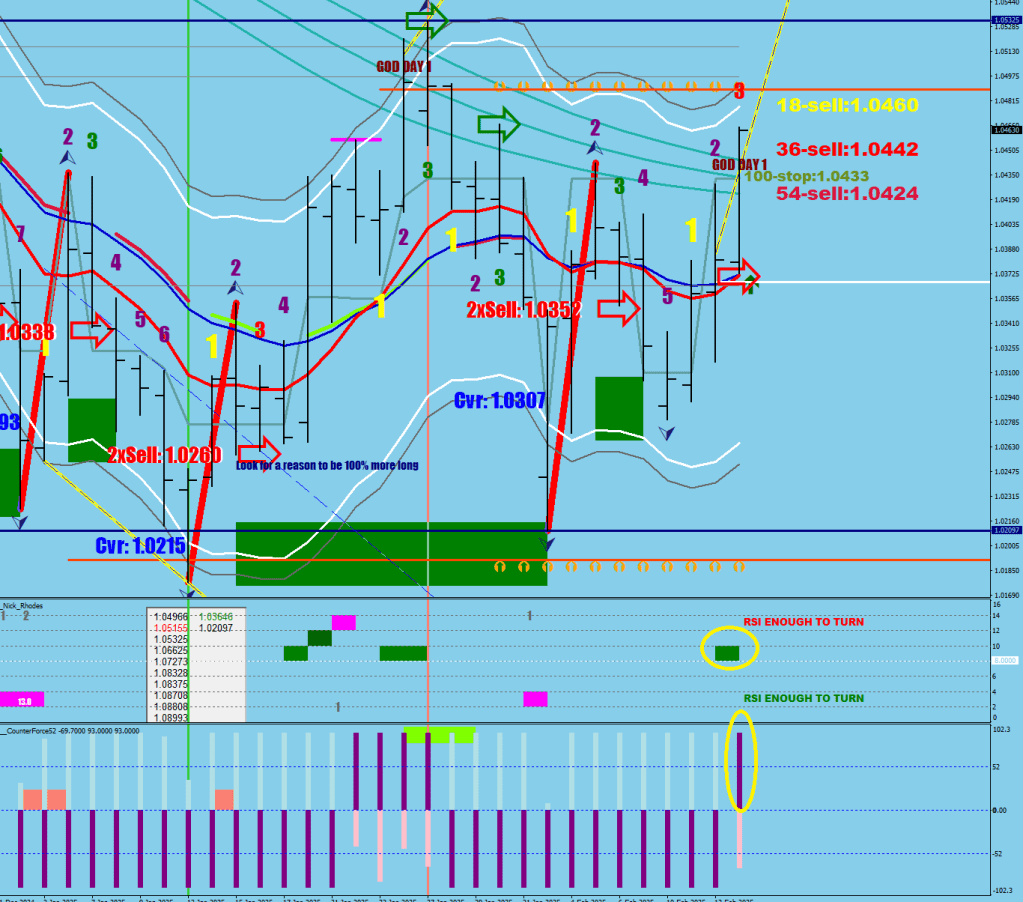
Well done, you have just built a narrative for trapping yourself, but you seem to have forgotten one thing.
The money flow.
Somebody decided to pick up the money flow weakness, the rally printed an MF high that would suggest the need for a higher high. The 120 sample stochastic has a lot more room to give on the upside before it starts to get overbought.
The price is outside the 30BB, right after a squeeze-release. That is more of an opening move if you ask me. Would I be surprised if they double down on the upside holdings at the 8 EMO and in the following 7 pips below it?
How about a 3-3-5 sequence for a finale?
They saved the longs from dipping below R3 twice (where the compression could have commenced).
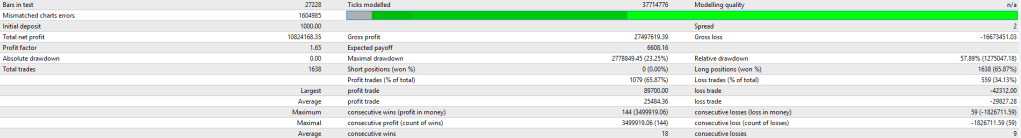
2-year backtest of the Municipal trader, long & short. Start at 1K, so the parabolic cap of max 2000 lots (max 10 positions, each capped at the broker’s individual 200 limit) kicked in a bit later.
1318780% gains.
Of course, I could make a 4k lot version to show even higher percentage gains, but if this were to be played in real life after large runs, some withdrawals should be made.
2-year backtest of the Municipal trader, longs only. Start at 1K, so the parabolic cap of max 2000 lots kicked in a bit later.
1309850% increase, virtually the same with 20% less trades. Does fine with longs only.
The municipal trader fades at the 207 EMA (30 min) if the Bollinger Bands are wide enough and also has Crown Royale fades (major reversals with a new high printed on an RSI2<50 or a new low on RSI2>50).
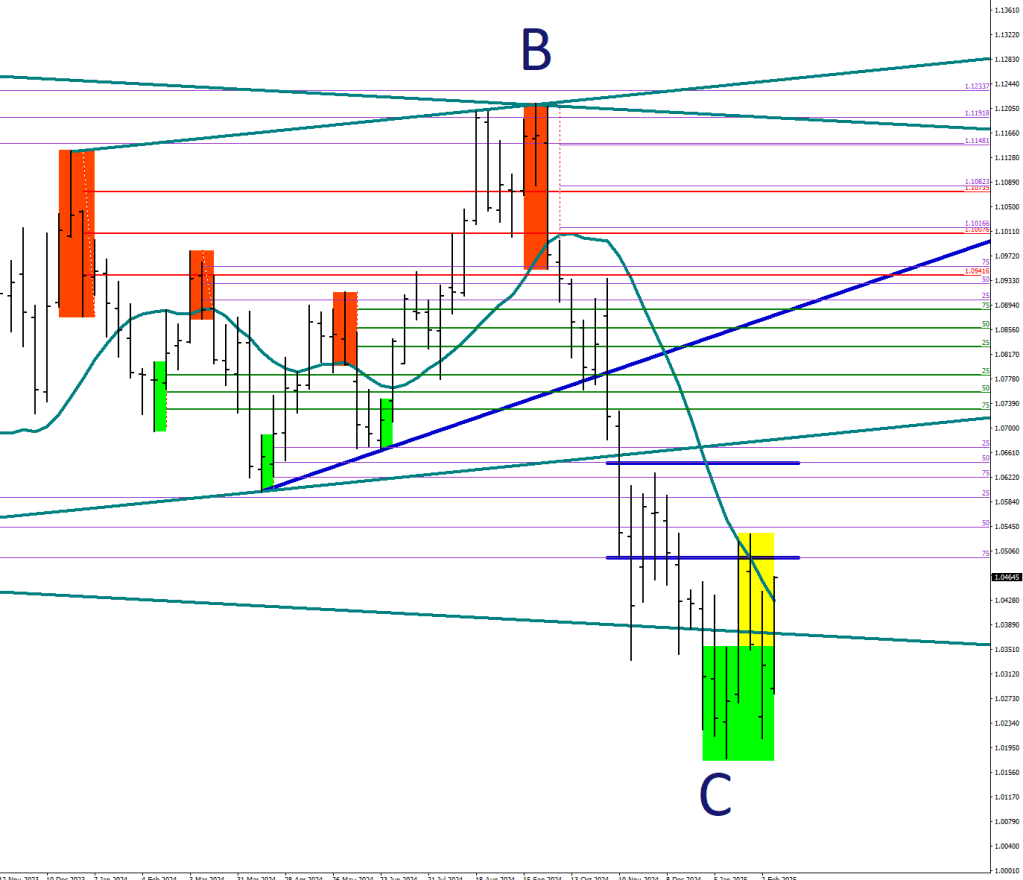
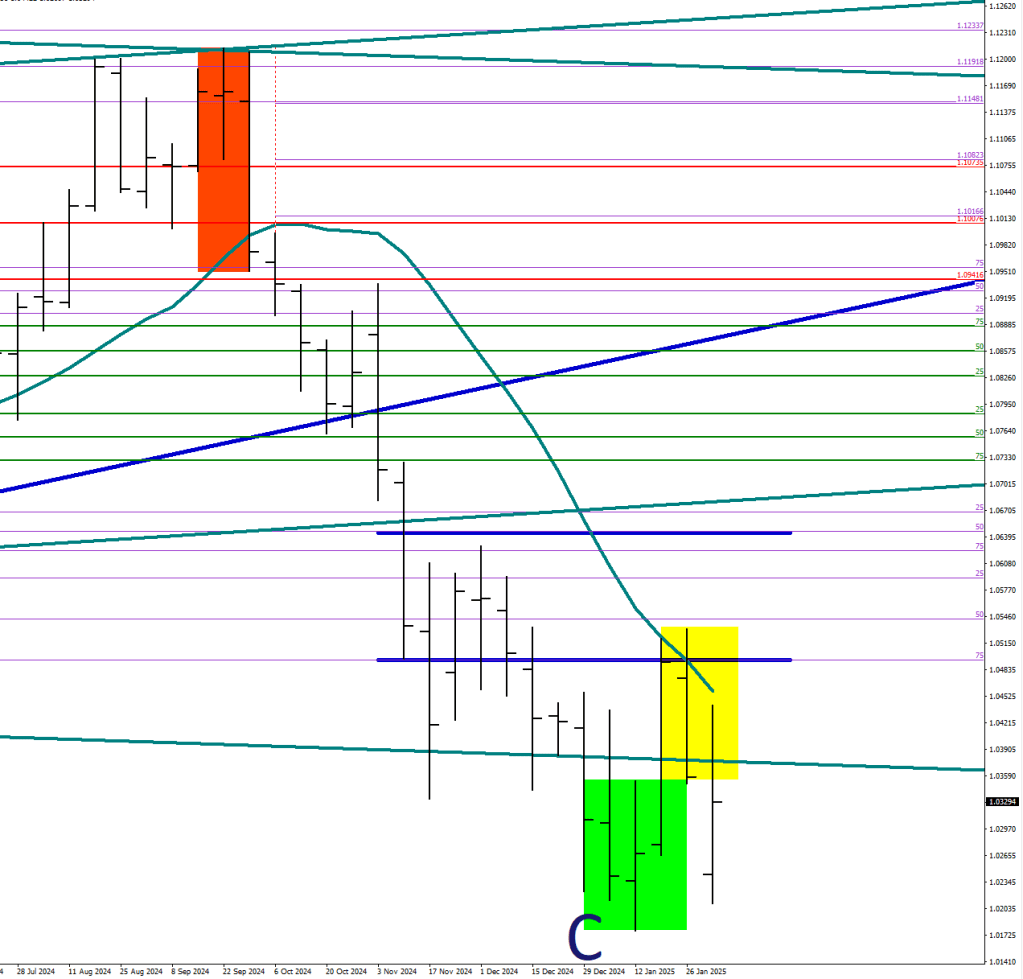
As a reminder, this was an 1100-pip range starting January 1, 2023 (arrow) and had gaps up to 150 pips on occasion. The C leg is still not completely finished.
I added the end of the pendulum fades to the W3FFF+F3 trader (450 points extra)
2-year backtest of the W3FFF+ F3 trader, longs only. Start at 1K, so the parabolic cap of max 2000 lots kicked in a bit later.
1082320% increase
No clear winner here, the two routines have nothing to do with each other, yet they perform similarly. The W3 has less drawdown but opens twice as many positions. 13 million of course is more than 10.8 million.
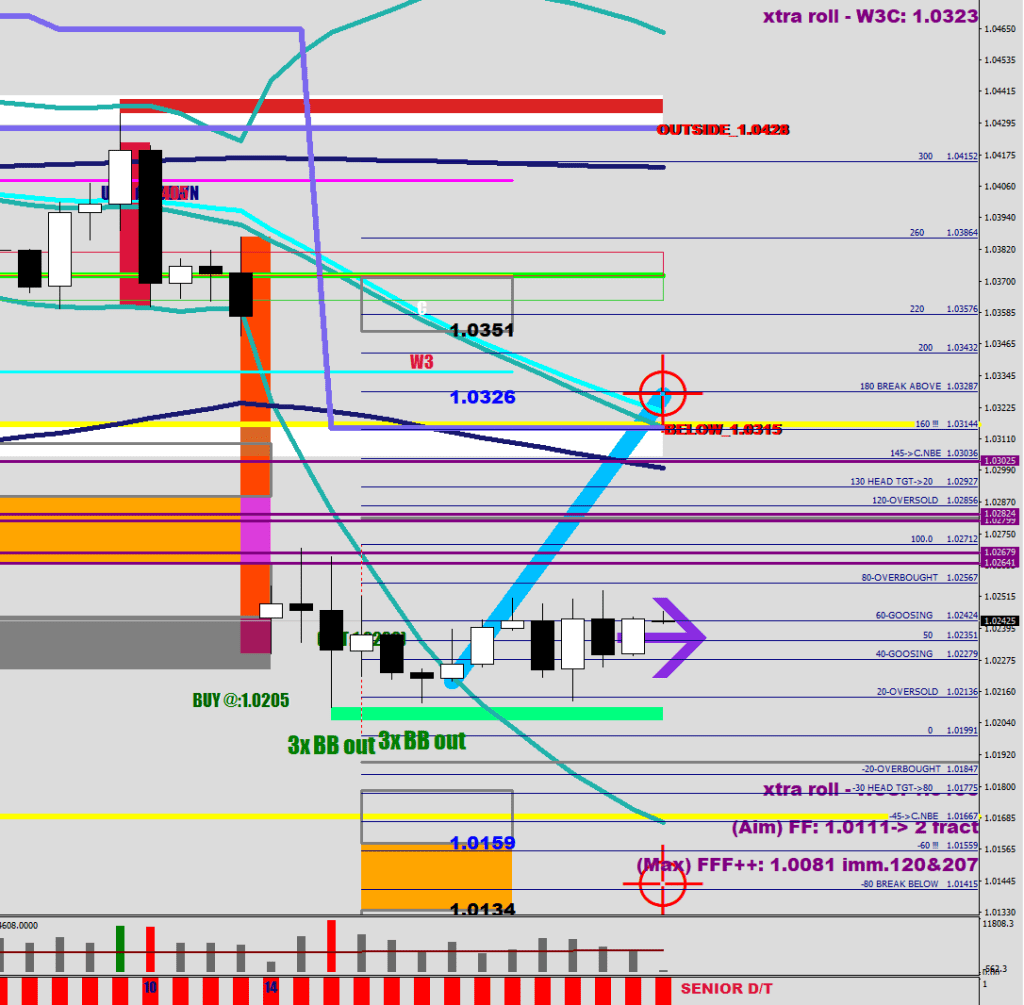
At the moment the failed move was the squirt out of the green box plotting a yellow one. Since the close would be back inside the green one, a rotation to the other side would make perfect sense.
Without further consolidation, you should be aiming your short holdings for 1.0241 at a minimum.
The yellow slanted was the neckline. It broke and was backtested.
After a new consolidation, the short exit would move lower obviously.
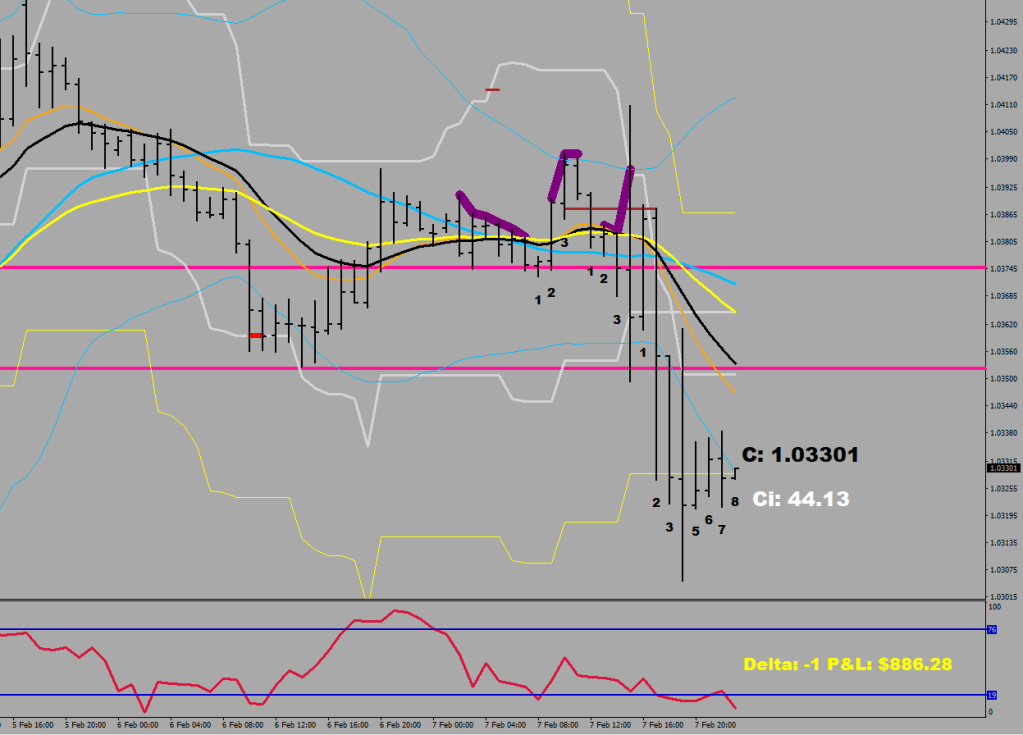
Ci is at 44, 53 is only a couple of hours away if the price does not gap away.
This is an acceleration down, so there should be a lower low (10-16 pips more) after a brief re-visit of the 8 EMO before another 21-46 pips pullback before the final Thrust.
A red liquidity break on the daily always results in a new lower low. The only exception was circled, showing the second following day making a higher low, and so the third, and so the fourth. Nothing like the current one.
Not a political album this one, but there’s one track with future Felon Musk mentioned here in the “Quest For Free Speech”
(The names have been changed to protect the innocents)

Elon Musk would be your arch-enemy
A self-proclaimed Goat of gaming
But don't hate the player
Hate while you can't debate
Lance Dagobert shall pour in some knowledge
3 minutes' worth of markets and money
Michelle Macaque will be hosting
And you will find out a lot about gold mining
[chorus]
Where dreams go crude
You beget unglued
Pick up your pitchfork
And swallow no more
Throw out the power with the bath water
Slaughter, like a neurotic robot
Kill the juice, eliminate the cast system
Free everyone, free everything, even the speech
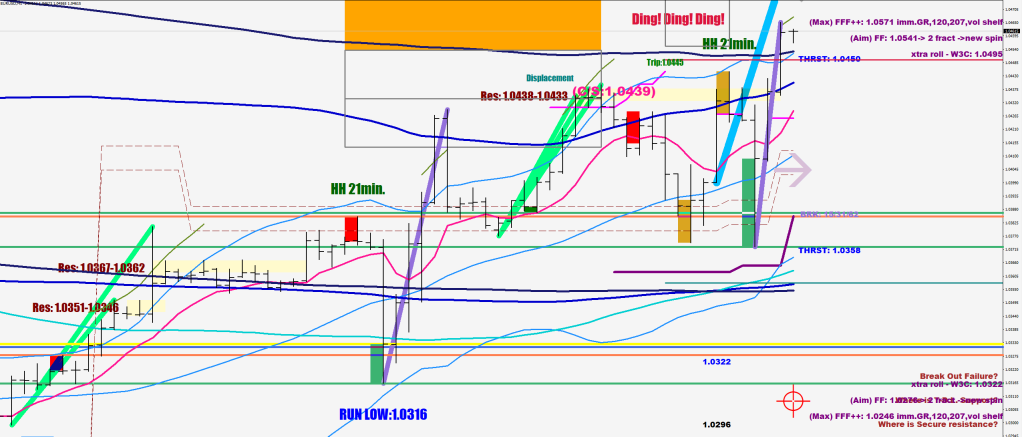
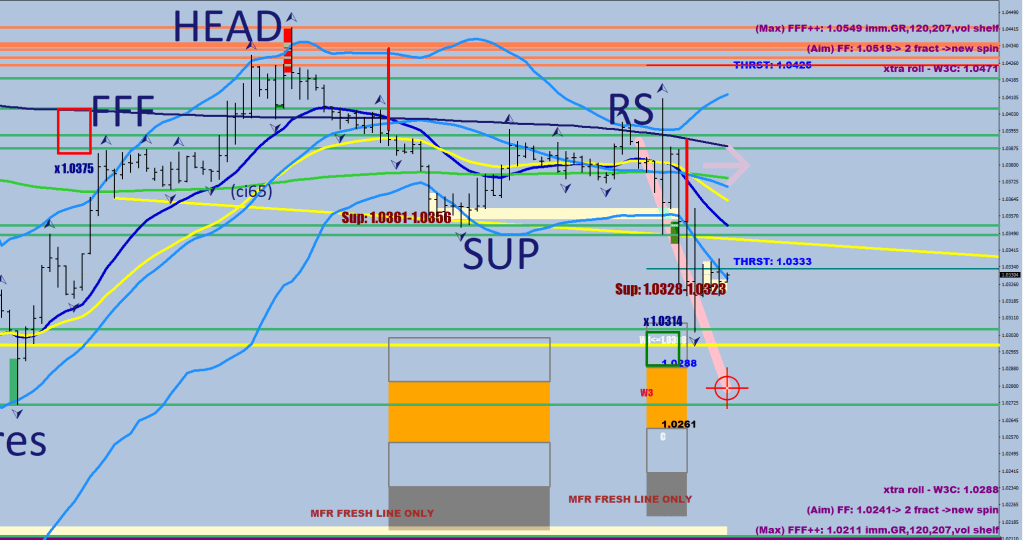
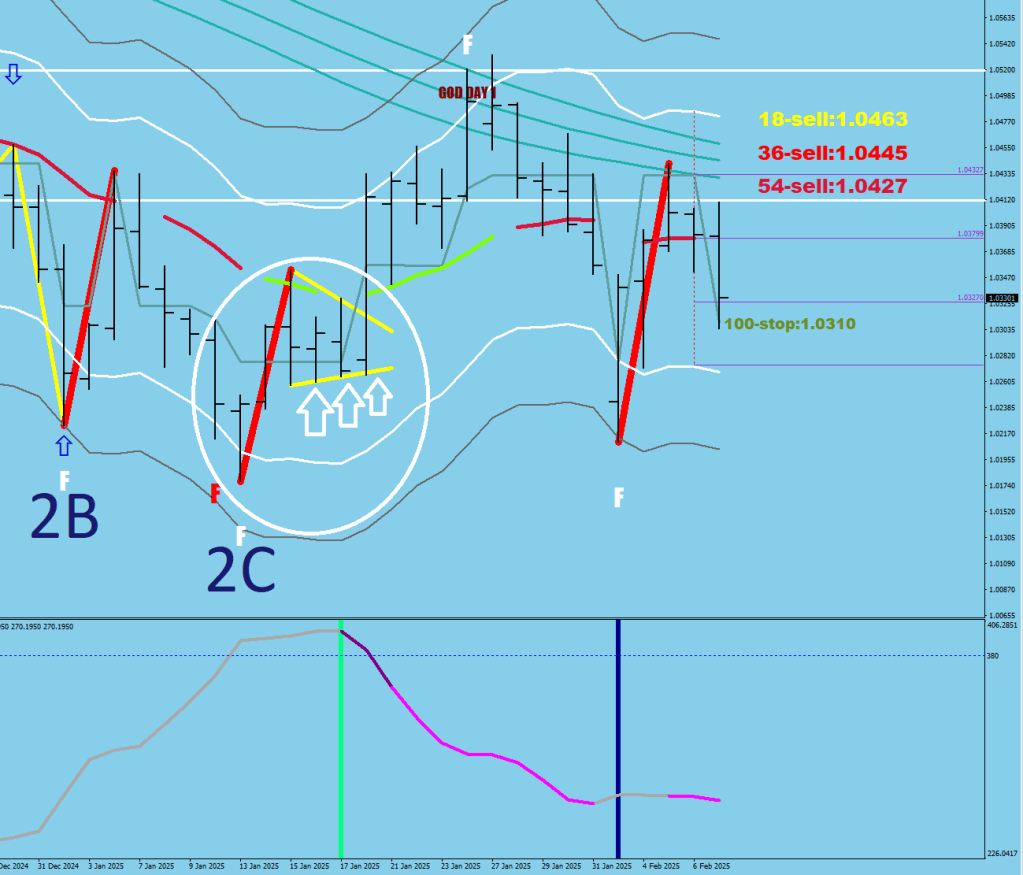
The descent is gonna be over when the market maker squares the shorts. That would mean an hourly candle with a 16+ pips wick on the bottom of it. If that does not happen, you play the bounce from the lower 30BB.
They are squaring now. T is a terminal distance, Thrust or No Break Extension relative to the consolidation mean. Since the price has been avoiding the S30, I would think that the lower 30BB would be touched at a minimum. Scale in nearby.
Once the purple line (FFF++) gets trampled on, the move is over. If it falls shy, like an FFF (10 pips shy this was), there is a free spin.
The idea of fluctuation maximum is a statistical figure. Here it is calculated as 46 pips from the consolidation mean (Thistle Arrow). I calculate this mean for better accuracy using 15-minute data and 48-sample CI. In 15 minutes the price usually does not move much, and I halve the last one where the CI went above 53.
In short, 1.0336 should be around the extent of the down move. Place orders 5, 4, 3 pips apart depending on the total size and what size chunks you’d prefer. Once you see a long squaring (14 pips+ wick on the bottom), you can add the missing size at market.
…
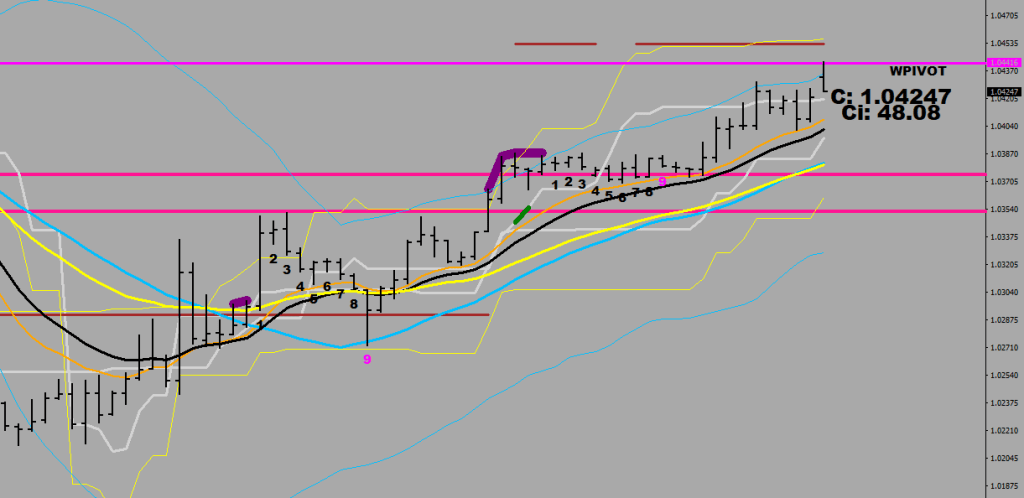
They tagged the Wpivot for good measure.
The T got rounded up to Head depth.
A high volume churn (see red bar) not reaching the yellow line (13,300) is counterproductive. It was not the market maker that dumped it.
The red volume shelf was left behind by the U-turn that kicked off the gap-down run.
…
They are now net short, so it is in their interest to take the price lower.
The lower Bollinger is still the area of interest. That’s a fixed point, even if the slow motion makes the price fully consolidated and the mean moves closer. Things have been programmed already. One change does not make everything change.
1.0160 keeps on showing up. Check where the 30BB is at now. A 3rd fractal print outside it (or a shortfall) could do it.
The market has consolidated, and the origo has moved (see arrow above).
When things go off the rails, you need a traction surface for the next push to start from.
The next one up is the inside of the 120BB, the 240 BB above. The way you keep the price outside is you reverse it when it tries to make a re-entry. 12-21 pips to do that.
If you want some help from the market maker, keep an eye out for a “lift and square” move. The last low was squared like this: