Press F3

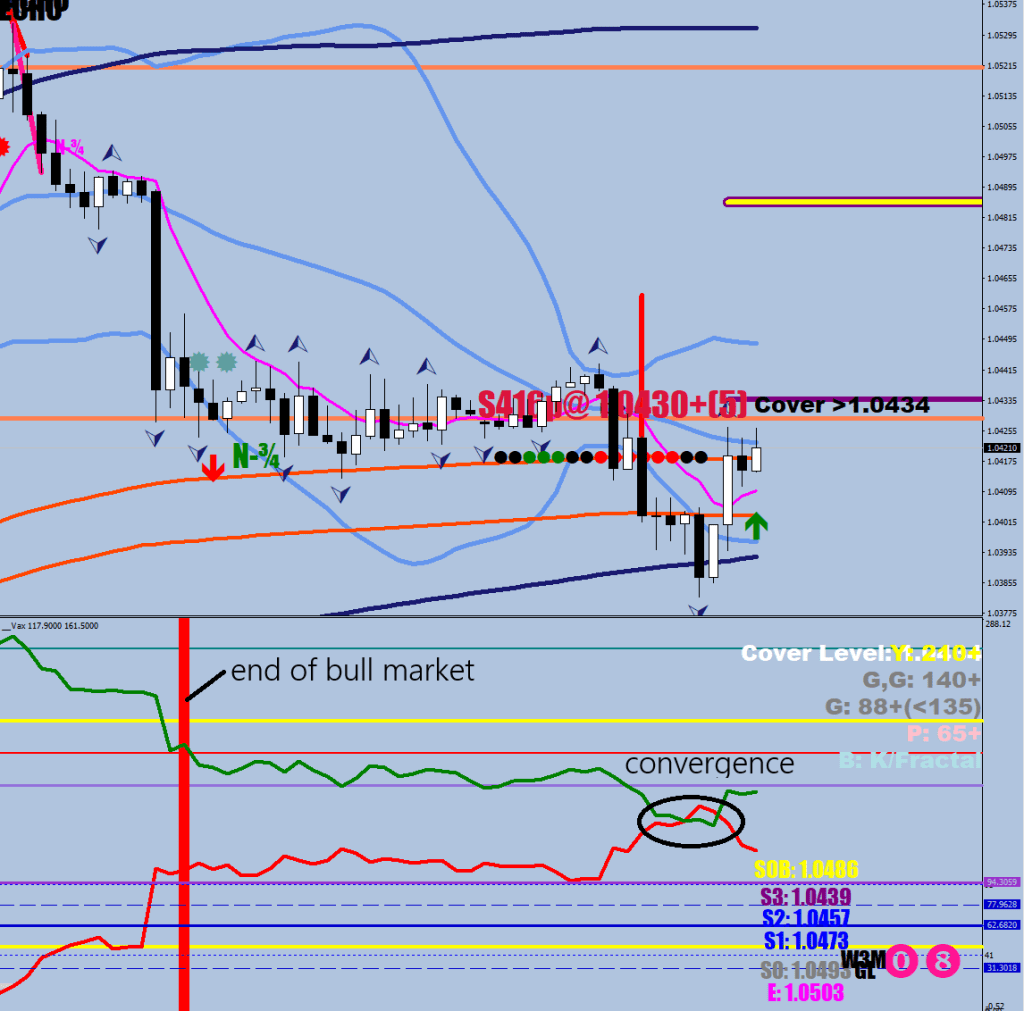
So, they flipped the boat. Too many people sat up to the Trump 1 analog, thikning Dollar shrinking from mid Jan precipitously. Market maker scored big.

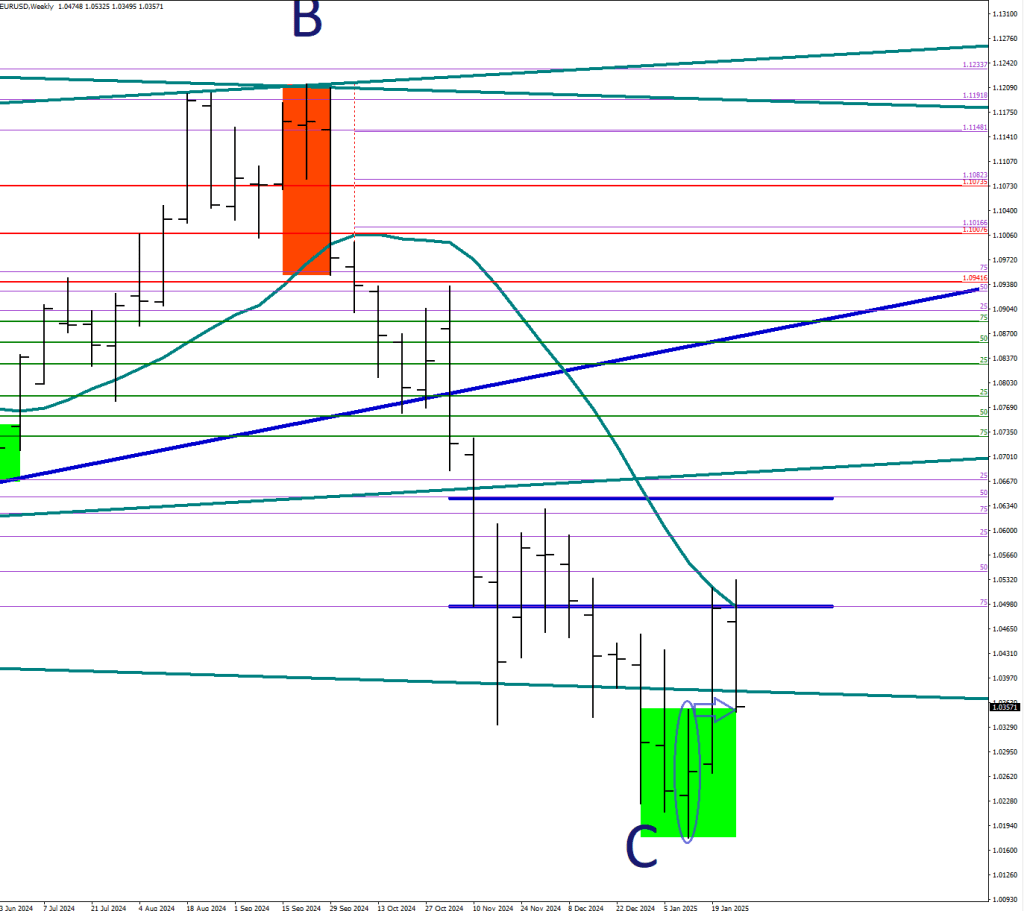
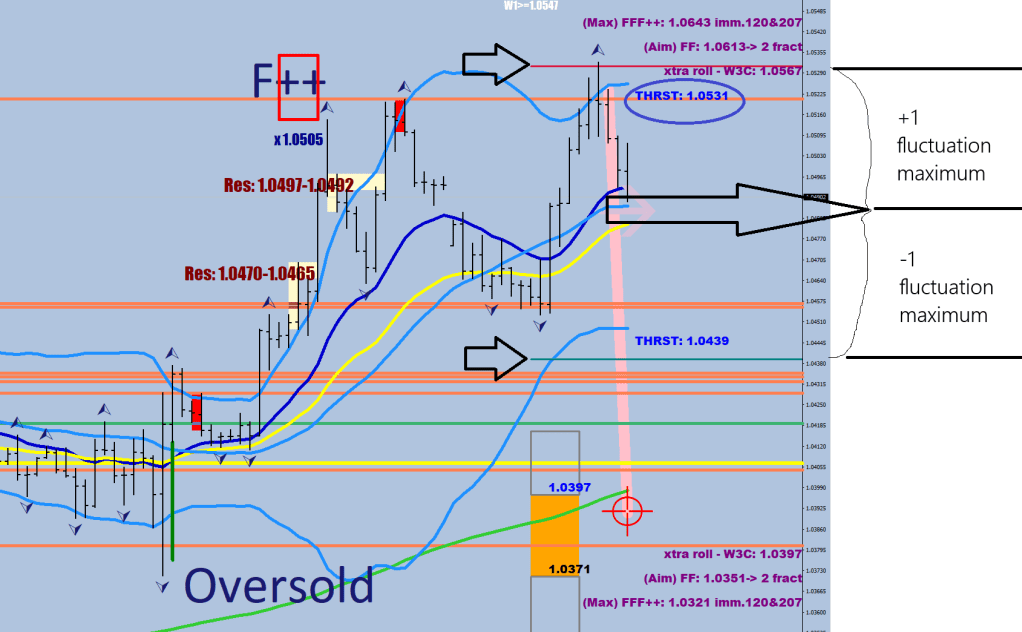
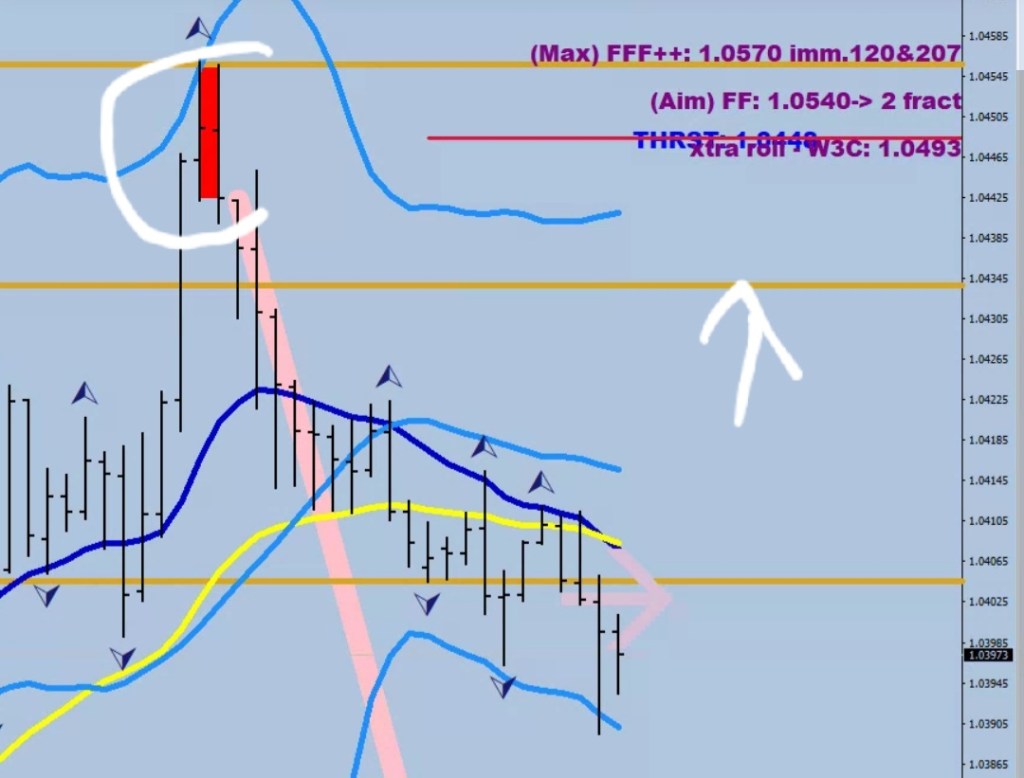
The pendulum was swung out to maximum distance, and this would mean that price is on the way back to the E9 Daily.

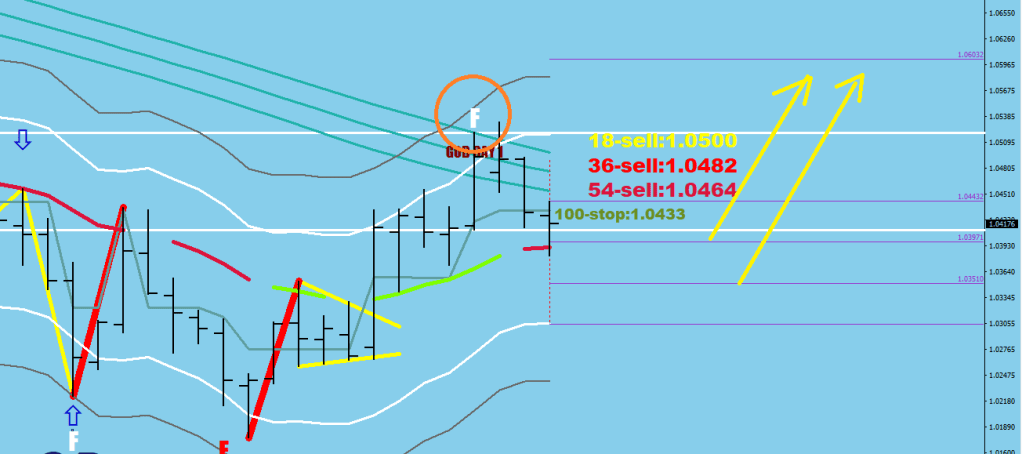
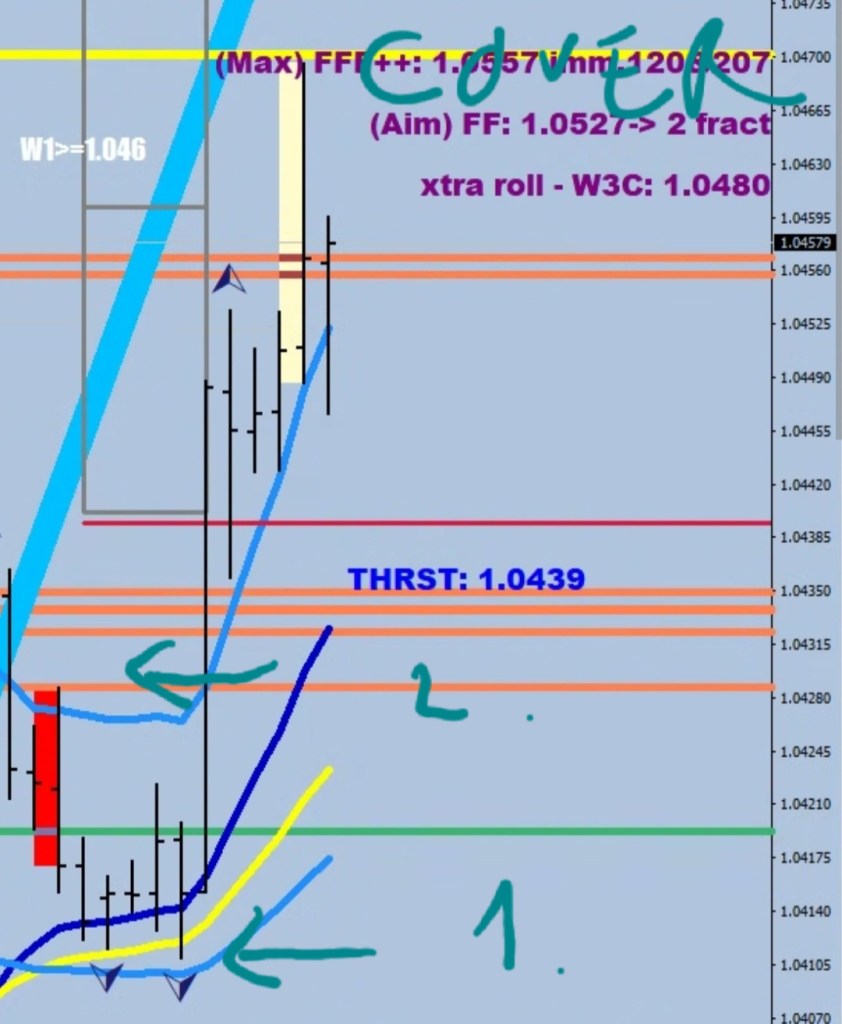
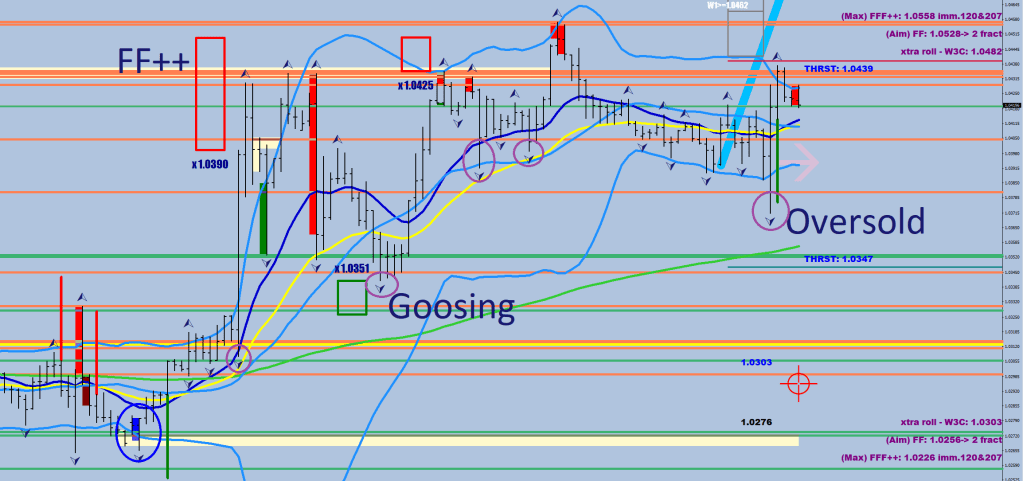
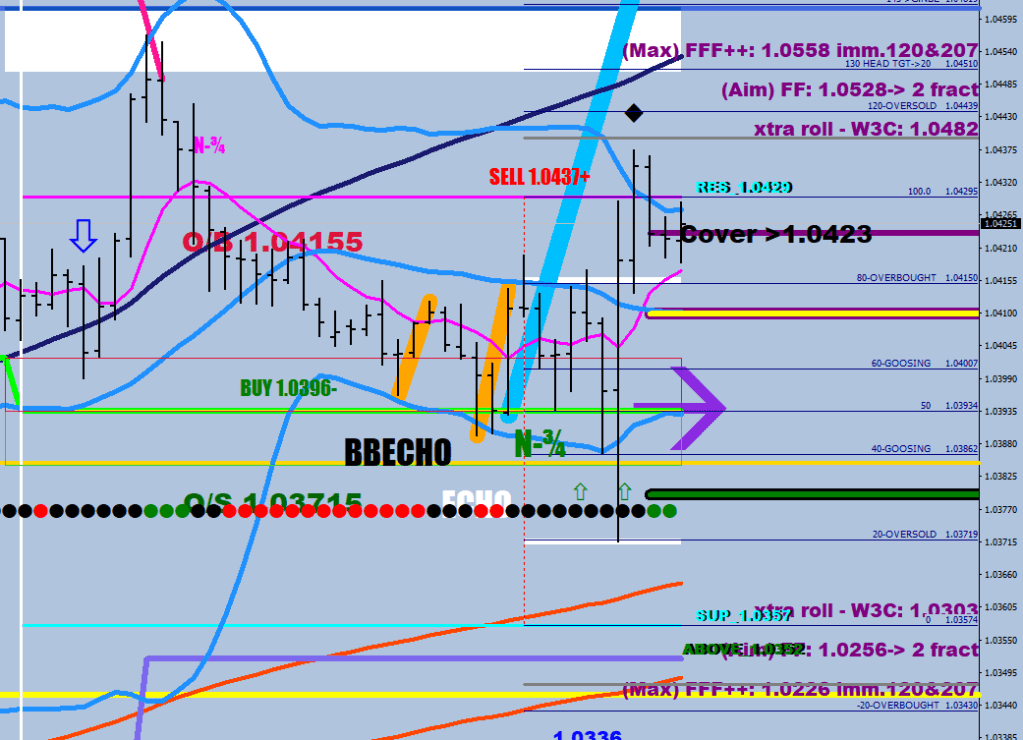
My reminders are immunity to the S120, E207 hourly lines (The S120 is too far, so I would put on a hedge at the lower 120BB (up to +12 pips inside)). Yes, that would imply not much success for trying to short before these lines are hit.

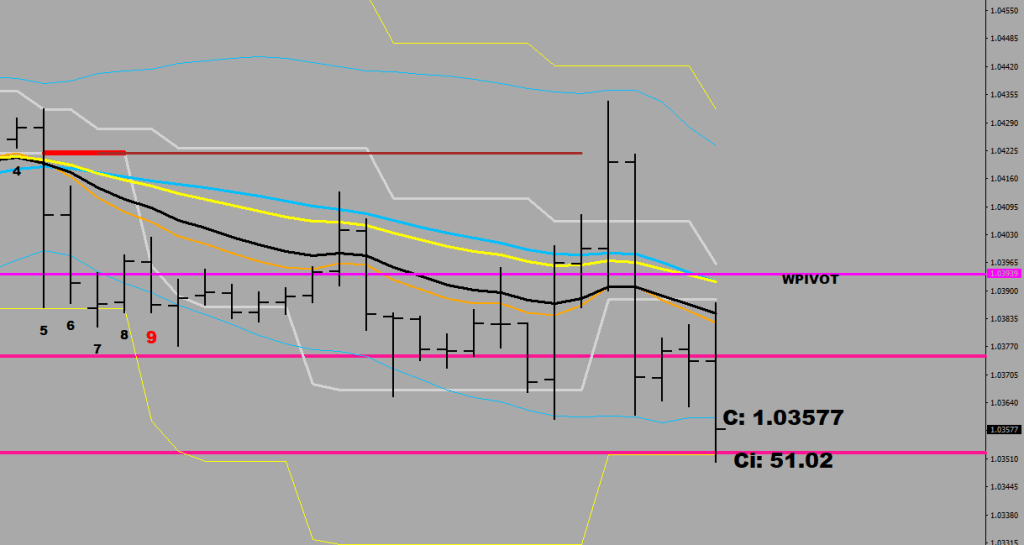
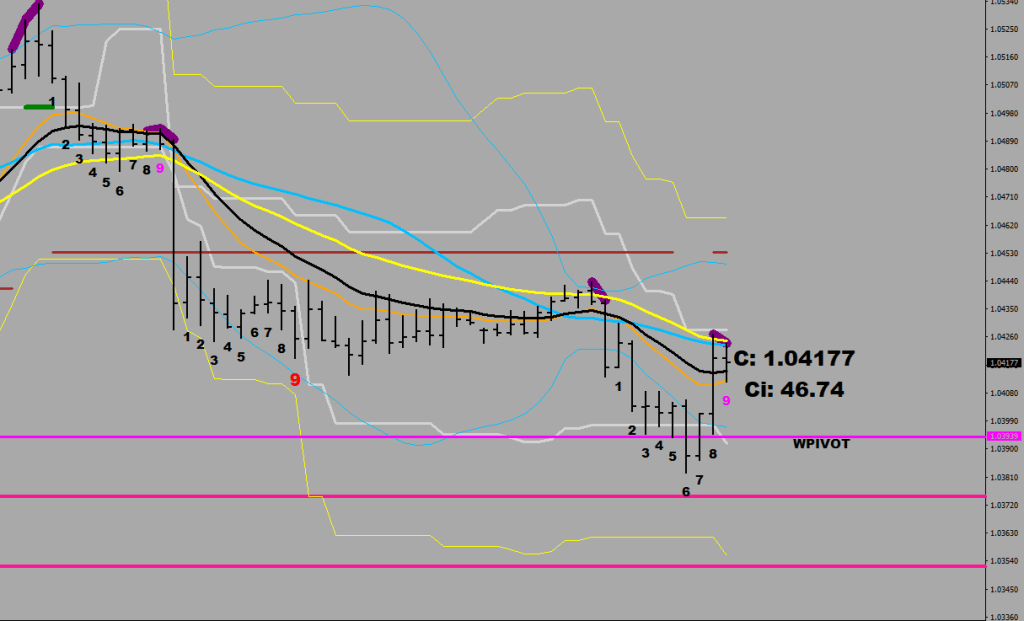
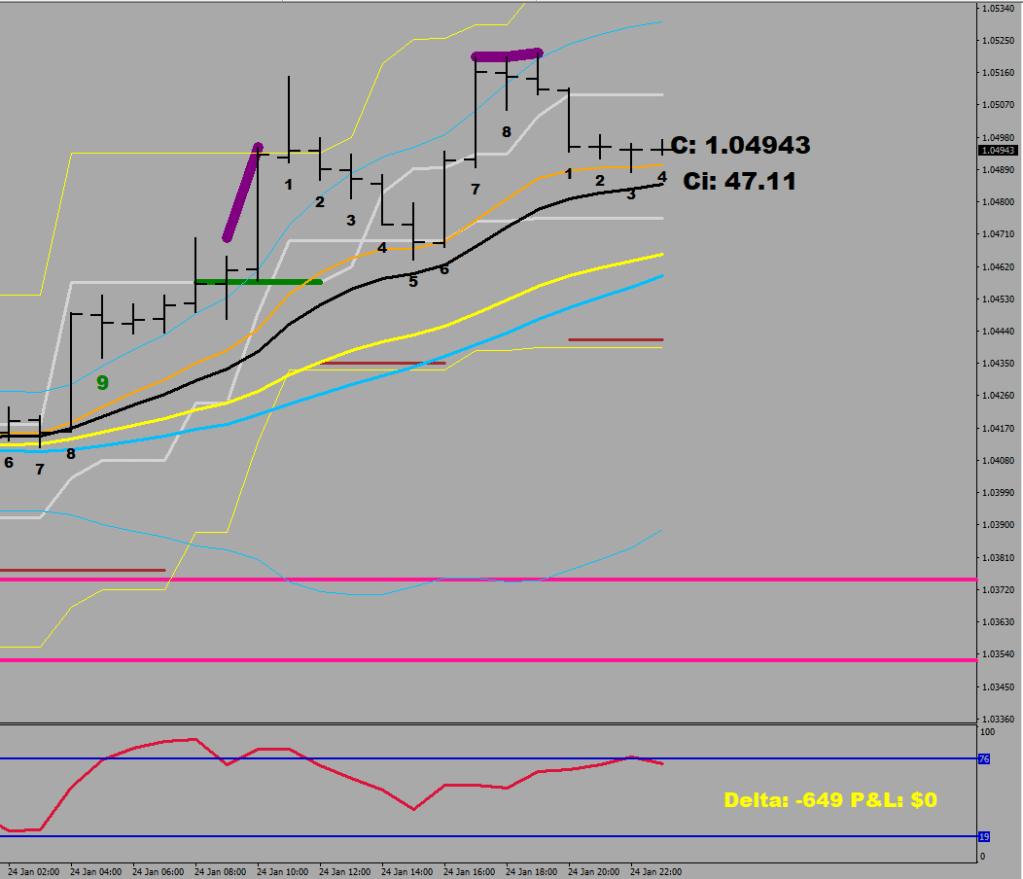
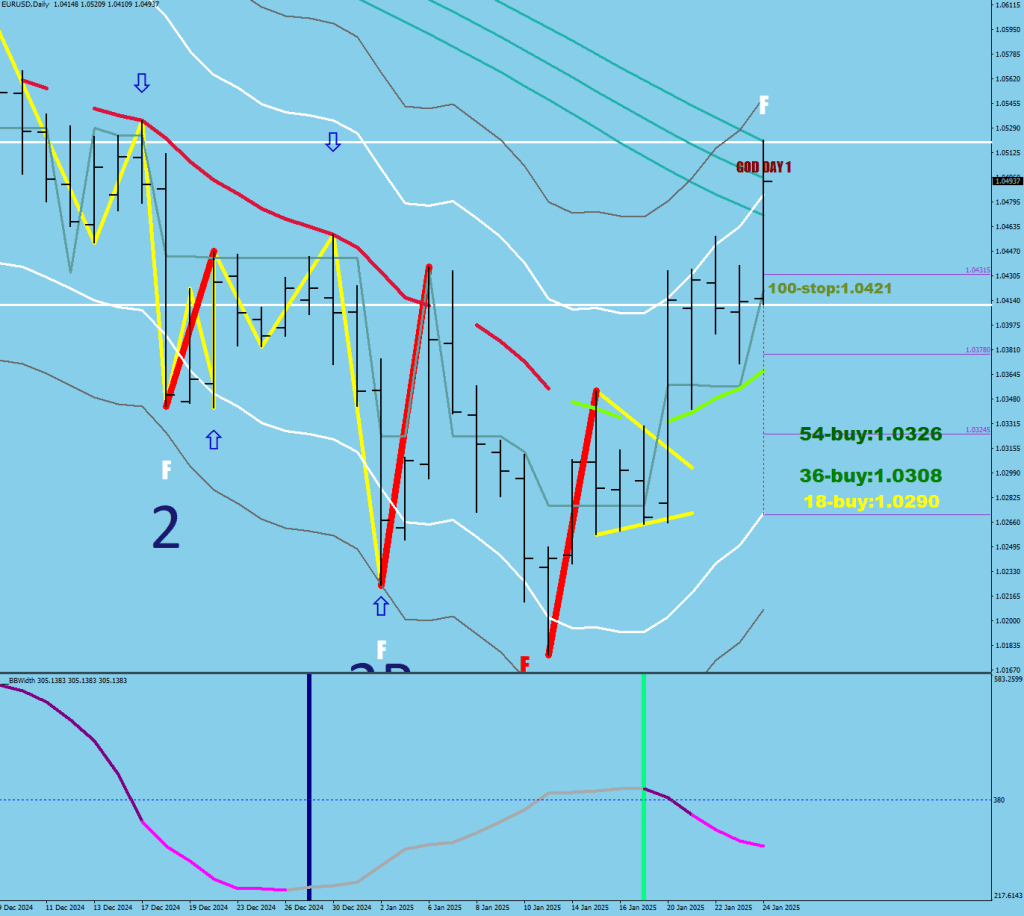
Why am I only long 2.28 lots? I am waiting for the consolidation to occur (CI>53) before becoming more aggressive. That would re-position the centre and make a no-break extension move possible (47 pips from the new consolidation mean). I have at least 6 lots of shorts I could close out deeply in the money right now.

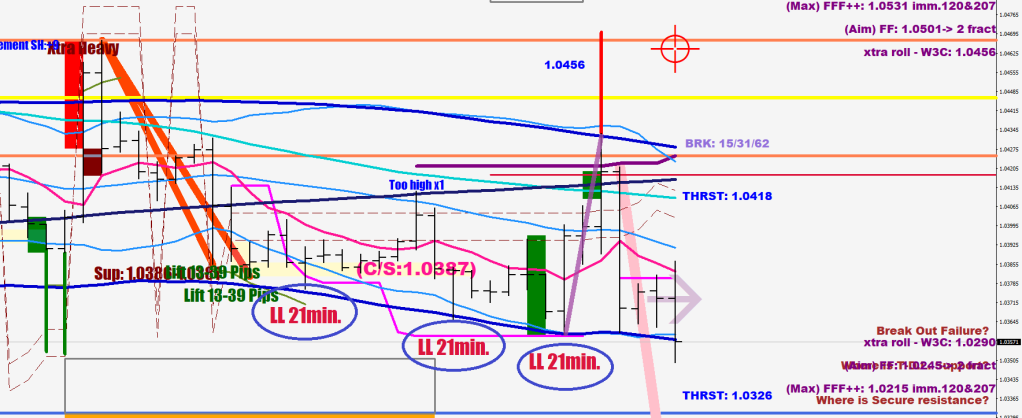
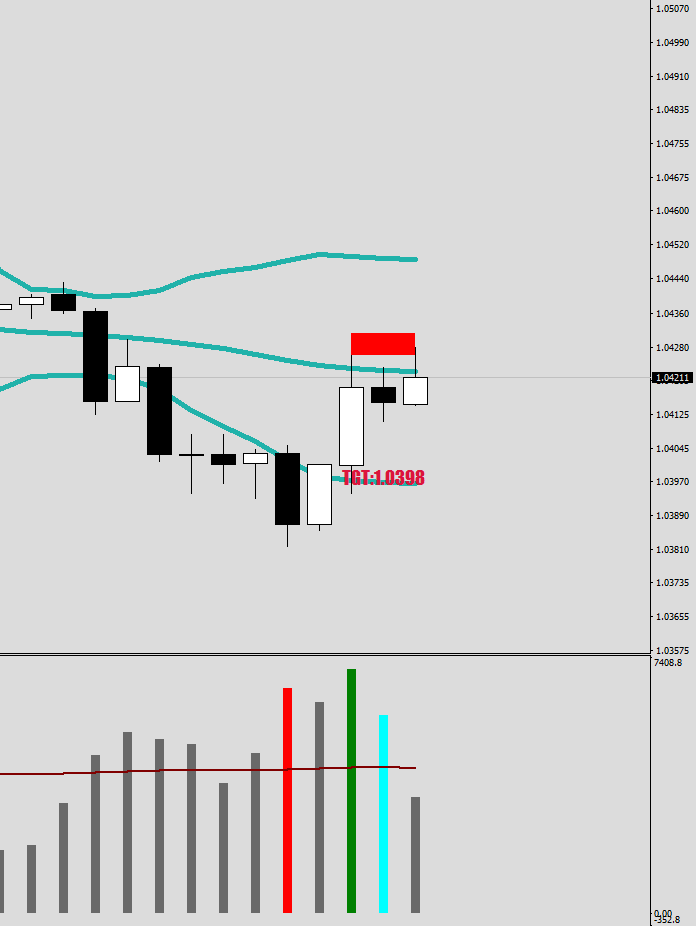
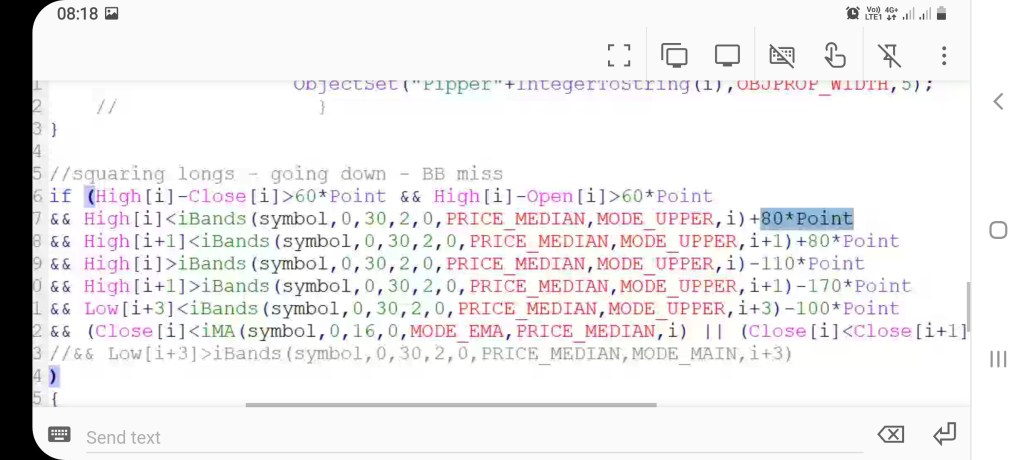
This current F print will turn into an F3 if today’s RSI2 print would be above 8.5 on the settle and tomorrow won’t violate today’s low.

Low[i]<Low[i-1] && iRSI(symbol,0,2,PRICE_MEDIAN,i)>8.5 && Low[i]<iMA(symbol,0,9,0,MODE_EMA, PRICE_MEDIAN,i)-FMax*2.4*10*Point

I believe this will be an F3, but after consolidation, the price could push the low further out a bit delaying the reversal by another day. Yes, the previous low is very tempting at 1.0175 for maximum damage.

Believe it or not, overnight there was a 1.0151 print, and the price has memory.

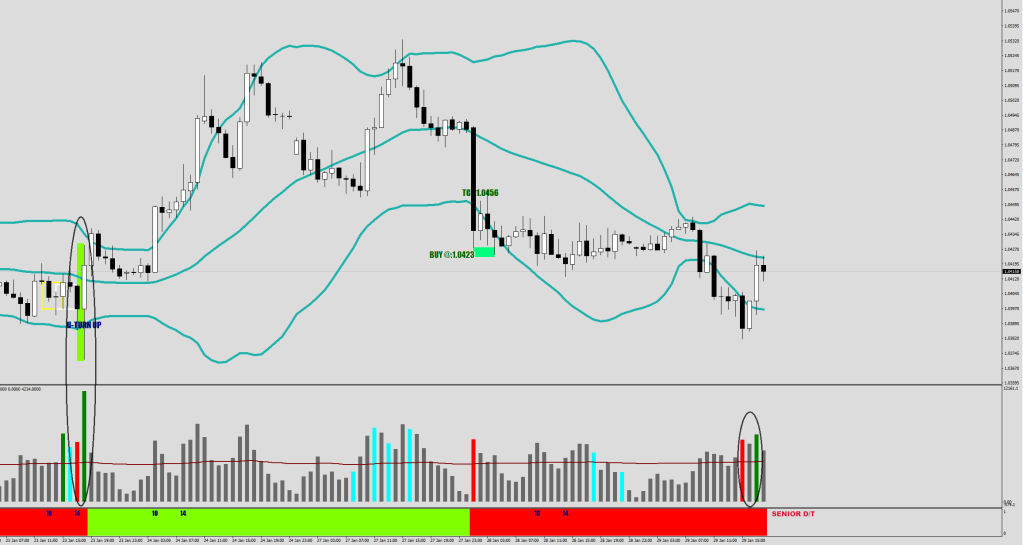
That U-turn was extra important as it turns out.


On the bright side, you can listen to The Art Of Raw Deal now, album #51 is out.

Not Hopeful For Bears

Whoever is trapped in the circled bar could be short-squeezed indefinitely. The dip into the candle did not happen until the last FX hour on Friday. Could see a major rejection here.

Do you see the 3x BB out prints at the top? Those 3 fractals were outside the 30, 120, and 240 Bollinger Bands by 5+ pips. Not exactly a sign of weakness.

It took forever to descend back into the 1.0360-1.0350 range. It almost seemed like it may not even happen.

After 3 marginal lower lows, a liquidity break was necessary first to eke out a few more pips on the downside.

This tells you that the holdings are severely short the dollar and long the Euro.

The move down was a thrust down. It may or may not have finished yet. The market maker could make this gap if on the open the order book shows having to go short, but be aware, that any more downside may be a gift.

Centripetal Market

Neutral zone. Neither side of the volatility was pushed below/above the R3/S3 level (purple line).

The champions of compression are the CTAs. Don’t seem to care right now.

The market has been finding support and resistance at the E-44, the S240 combined with outside the BB30, and outside both the BB240 and BB30 a little earlier before falling into the washing machine’s drum.

Here’s an opportunity to realize that the red and green volume bars are usually counterproductive churns, meaning, they make their own resistance zone, that usually triggers a larger reaction.

Where to from here? I would think an undercut of the lows could be bought at 1.0360-1.0350.

The bottom band (white line, 2.2x fluctuation maximum from the E9) would not be touched for several months in my opinion.


From The Art Of Raw Deal (Album #51)

Ay, amigo, the future of AI!
A shift in the direction of the air
A rapture of a buttered fly's
Left wing
The oral office remains wide open
You have some nerve with
That kind of a distribution curve
Current exchange level of the currency
A peg would surely keep it from falling
Your mouth from talking
And the portfolio from tanking
(I'm the great Cornholio!)
Make a change
Liberate your chains
Talk to the hand
I am not your friend
(I need TP for my bunghole)
The art of the raw deal
Is to shred what is confidential
Or at least take them home with you
And only sell nuclear secrets
To the highest bidder

U-turn?

It does not look good for Dollar Bulls before FOMC.

High volume churn down followed by high volume churn up. They are back to back usually.

The F on top was an engagement of the upside.

A Wave 3 up was gonna come from the middle line (just below the E-9) or a deeper dip to the lower guard rail which is about 40 pips lower.

They bought last week’s pivot so far. I have 1.0374 and 1.0353 on the downside as optional buys if it would come to that. I am not saying that you would see a lower low, that is not the base case.

At the moment the bulls hold the volatility edge after a brief convergence.

The down move ended at the Fluctuation Maximum limit (another No Break Extension).

…and now a pro volume print. If that’s a profit take, well, this whole thing has gone rather neutral.

Pro Active

Lots of professional activity today. (Cyan volume bars). Highly doubt that this was an accumulation.

Today they bought the S1 for a new high. I got out after the gap-fill reaction, leaving 3K on the table.

The move up was a thrust, albeit a slow one, 6 hours vs the typical 2.5-3 hours.

By understanding the concept of consolidation and measuring fluctuation maximum distance, you can see how far the market can fluctuate. Within this range, no breakout occurs; hence, I sometimes call this move a No-Break Extension (NBR).

The price is reacting to the 14-week SMA. The weekly S1 is at 1.0283.

The Weekly Pivot is at 1.0393

Answers

The bear market ended when there were 3 hourly closes above R3.

The start of the bull market was 3 hourly closes below S3.

A Yellow volatility divergence normally prompts a pullback to the other end of the 30-sample BB.

F3 is approximately the same as S3.

The buy zone should be around 1.0426. The 7-sample MFI should also get down below 15.

A yellow divergence does not make for a safe top. The break out must be bought once the price has consolidated (CI>53, not far now).

The yellow divergence would have been gray if it took one more hour for the price to get back below the 8 EMO. Not enough separation is the difference.

Since they have purchased every undercut of the S2 and accumulated at S3, there is no reason to think that this behavior has changed.


Album #50

Making Sense

3 things to talk about, and they contradict each other a bit.

The first thing is the driven thrust sequence. The drive part (acceleration+ HH) was made, but the thrust is missing.

At the same time the market maker has squared the longs (red box).

So, I think the thrust would come from a lower low. In fact, I want to see two hourly fractals on the downside first. Also, the S30 should be exceeded at least.

The current pending fractal would get an override on the open merely by the expanding spread.

Now, the third interesting thing is again market maker behavior. They did not square the shorts upon the price cracking back inside the BB, which would have acknowledged a prolonged stay in the new zone above the previous high.

In the previous picture, you can see that there were more than 3 candles that formed completely outside the 30 BB. When this happens, normally there would be a crack and square upon re-entry.

Two recent examples:

X marks the crack.

The fourth thing is the F print on the upside. Volatility is still on the decline, putting the low out of reach.

We should see a reaction here, but the most severe kind would not likely get beyond the 3rd line, which is 1.0330 or so.

The 5h thing is Kissing The Ring.

The 6th thing is me writing politically charged lyrics lately for album 50, called Consilium – a sign of times.

From the European Election-Season

From far left to mid right
Torys wearing wigs
Clown carnival with an opening
For a bloodhound running
Mate, you better be quiet from now on
Don't you be cute, I'll put you on a mute
Put up or shut up
Choke on that pear-shaped
Cucumber sandwich
You have tried forking
But I have developed a
Skewer skill, and I intend to stick it

From Dinsdale On The Perk

Moved by an aristocrat
You build a telescope inside
A dark-ass tunnel
To find your own living standard
You would need to probe down
Further with a periscope
Cartoon villains running
The show in this dispensable
Existence

[Chorus]
Oil up and parch
You can already guess that
The refrain is going to be
Oligarch

The climate has gone strange
It seems to be undergoing some
Change
It's wild, these fires
Losing your home -
That's interesting
At least that's the official
Stand
Before the stampede shall commence

[Chorus]
Wishing on a rainbow
You can already guess that
The refrain is going to be
Overthrow

From Transfer Of Power

[Chorus]
Pretty big heap of it
Oh how I wish for it to burn down

Cross bun on the autobahn
It is fortified & endangered
Bone spurs don't disqualify presidents
A new Chapter from Chapelle
Flush it real good
Capital capitulation
Almost on time
Meanwhile at the Capitol
In the Capital there's almost no crime 
Pip squeak on a short fuse
On seat C-4 in the stadium 
The mood is about to explode
As the power gets transferred
From Ghengis Khan to
Kuk-Lux Khan

Running The Market Maker

I have 2 recent examples for a net short market maker having to put on a hedge by traders forcing the price outside their squared longs limit.

One was at the end of a leg and yielded less, the other was at a beginning of a move with much more to be had.

Consider the following. Plot the 32 EMA in yellow, the 16 EMA in dark blue and the 30 SMA in light blue, all over median prices.

After a two-line dip put on half size for early position. The other half at the top of the last squaring.

The price has to get back above both breached lines and maintain, otherwise the attack is not working.

Aim for 16 pips beyond the squaring if the leg is coming to its end. Aim for 56, 66, 76 pips or starting the 120-sample BB if the leg just started.

Evolving Situation

First, about the blue circle. It has been puzzling from the beginning. The market maker was responsible for the gap up. But the blue thing that would be a crack and square is completely out of character for an MM, as they do lift and square when buying. The conclusion is that this was active trading, new money.

Now, with the mindset of market makers reacting and squaring, the initiating moves had to be made by non-MM players. The purple fractals seem to have one thing in common: they utilize those market maker lines that were long squaring prints (coral-colored lines) and they hold their palms out 4-12 pips lower. The traders seem to ignore the green, short squaring lines.

The other conclusion is that a top is missing. The squaring at the recent top made no impression on the pendulum, it was a divergent close to a leg. The MM stronghold would see an overrun since the oversold level was just purchased.

Particularly because of the head and shoulders looks.

If the traders are still interested, they should buy below the 1.0405 line (minus 4-12 pips zone).

The aim could be as high as 1.0528 and with the consolidation mean being moved higher a little extra on top of that.

The bottoming sequence was a W3C getting a Support beat after a new consolidation.

Never Ending Calibration

I often fall into the trap of faith I put in filters that are not yet settled (if there was no signal no change has transpired attitude). A Money flow overbought peak is not the end on the upside according to my thinking, and a divergence sequence must play out first.

I could not be more wrong. The market maker can use this luck-found pocket of liquidity to square holdings into, thus there would be nothing more to look for on the upside

The sane mistake others make with drawing lines thinking any crossing to be a break and they must be repellant, well I commit the sane ctime when I exclude from BB shortfalls where price has gone over the line a bit. So some extra allowance is a must. 8 pips I added.

So I have this coworker reciting mindless sentences like “structure is king”.

The problem with discressionary trading that it has no rules, and it is not replicable. I cannot write a binary code for “I don’t like this long” and which side of the bed you woke up on is not a valid premise.

I chose not to exist in a world of narratives, I don’t like having no definitions for things, I want computers to stay binary. Maybe is not an answer to any question.

Undestanding market making however could make you a king.

As for tangible advice, the market maker is now net short. Align your holdings accordingly. Use a move up to dump longs, i.e. towards 1.0430 or upon approaching the 30-sample BB.