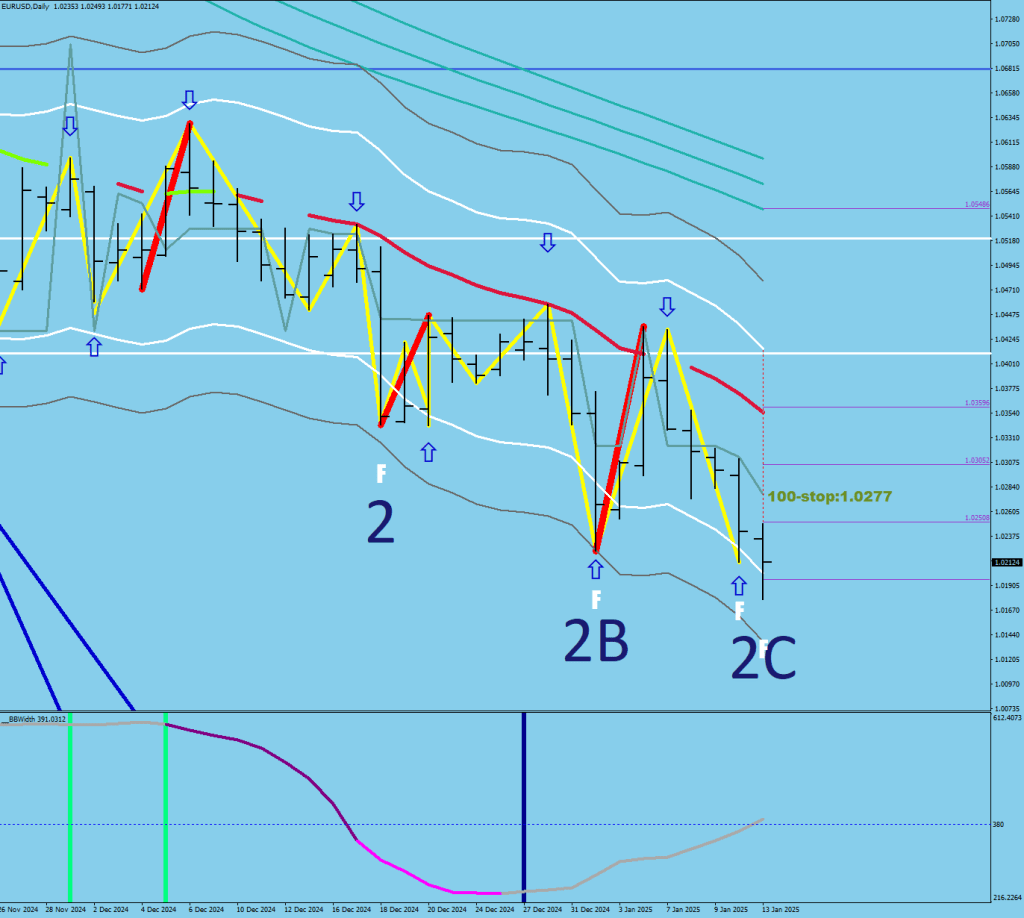
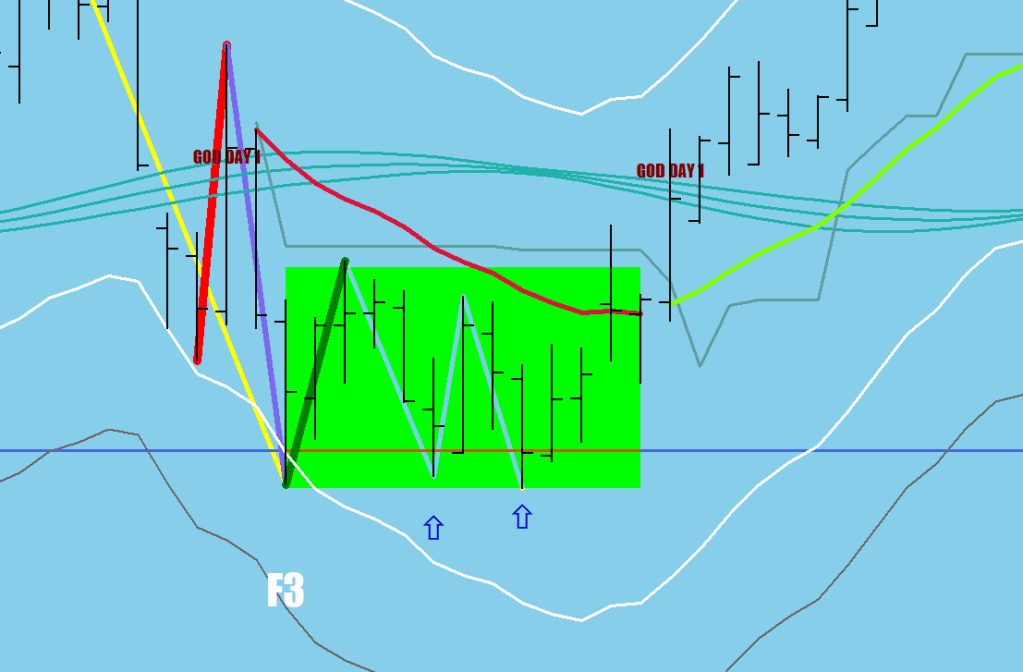
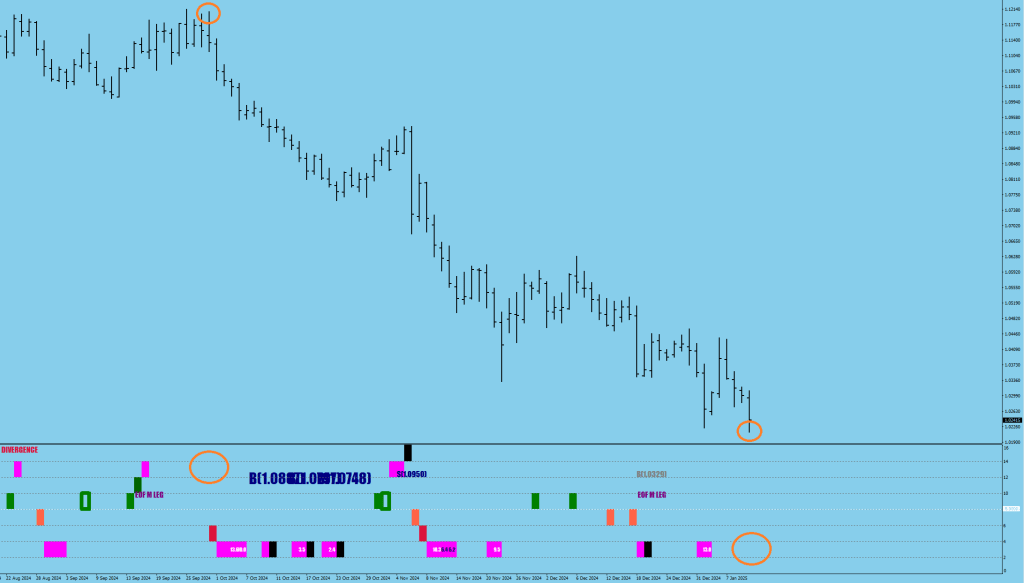
A liquidity break has finished (red line). A lower low is guaranteed. The Bollinger Bands are starting to compress (volatility will trend down – green vertical marker).
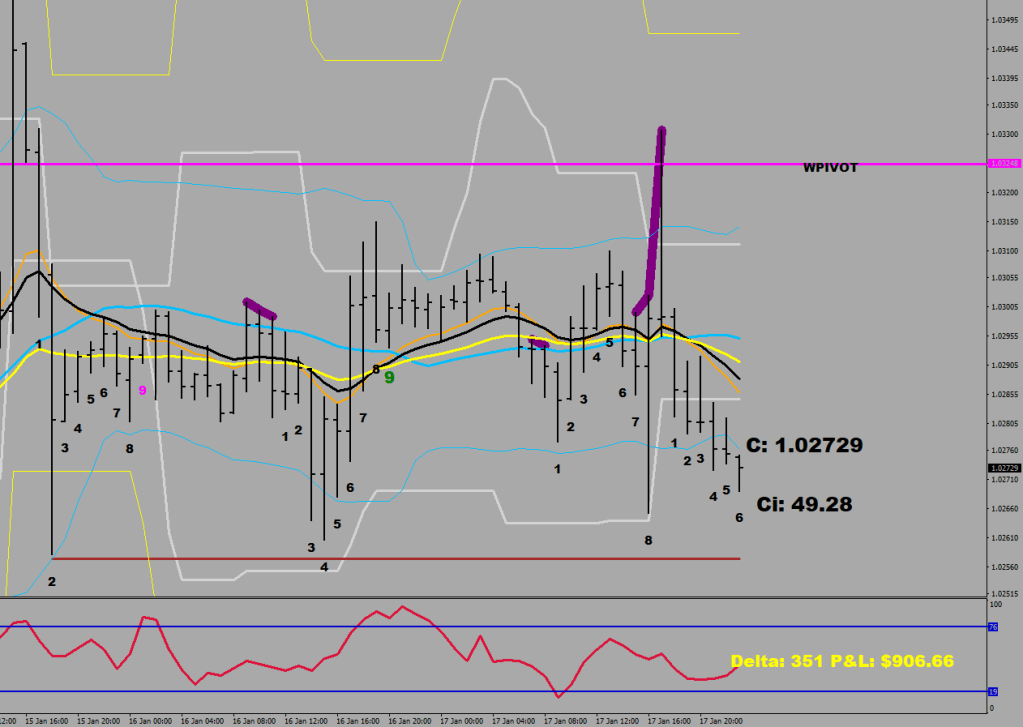
The market maker is a net short here. The thick red was the squaring of long holdings.
The week is closing more than 91 pips up, so technically a swing low is in place until the low gets taken out again.
The filters I wrote pick up this 3-hour selling as a short squaring.
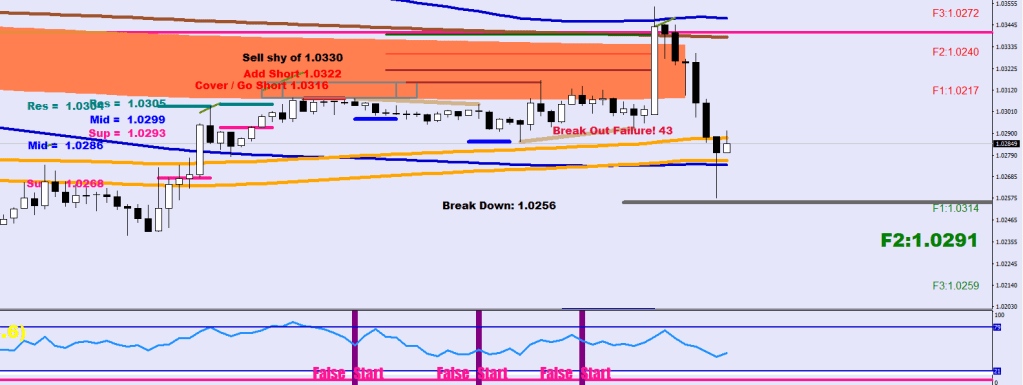
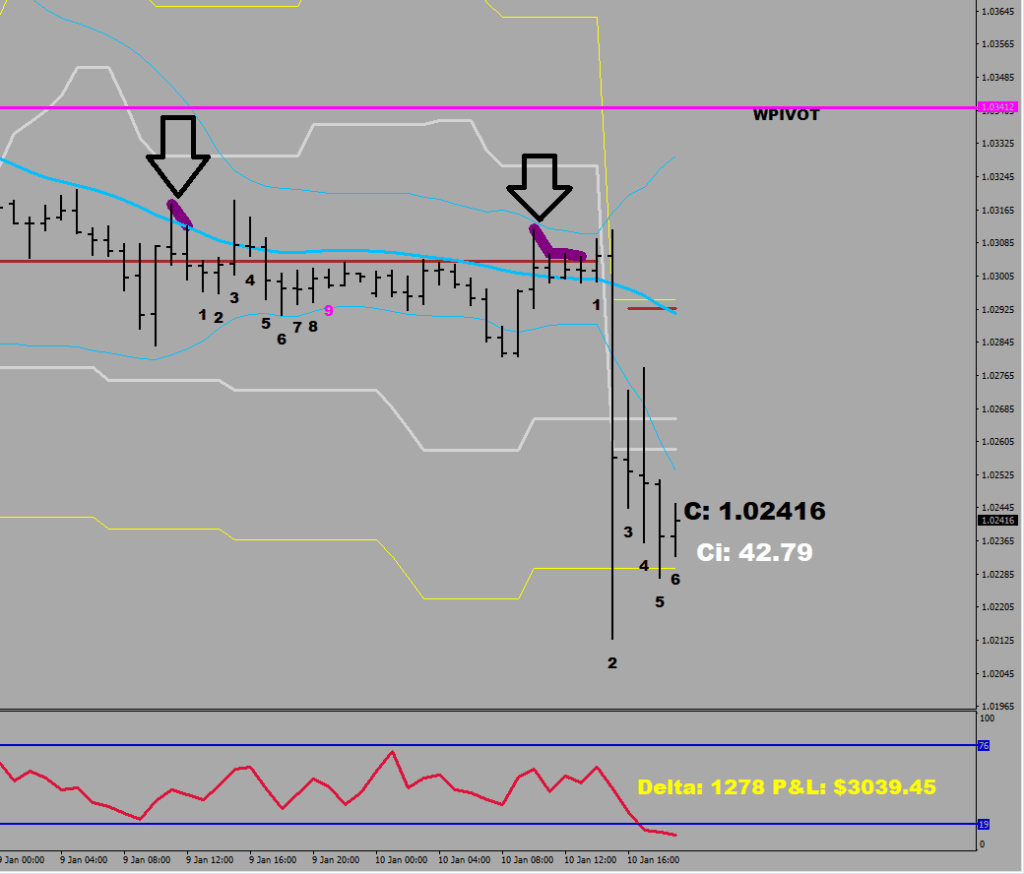
This is a fluctuation maximum (46 pips) from one side to the other side without moving the consolidation range. This move could be a Wave 2 down or a Wave B down. Either way, more upside beyond the high that was made today looks to be in the cards.
As for the CPI I knew that the Market Makers were wrong, see the green squarings prior, and also there were 3 false starts on the MFI/RSI2 combo, so I told my coworker that the upside was “prepped”, and this was going to rally.
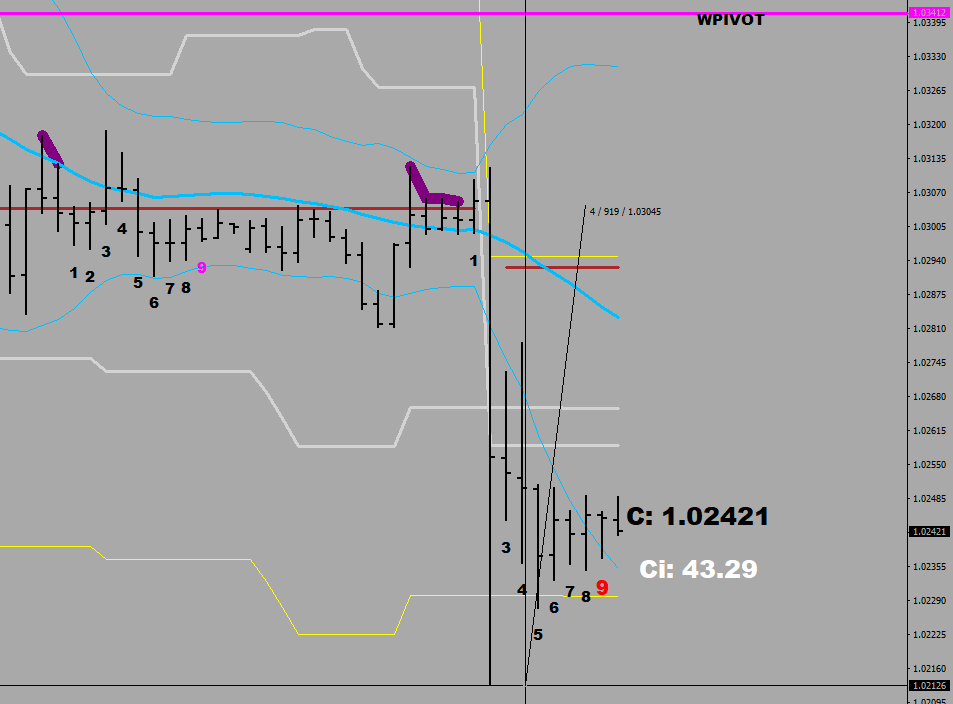
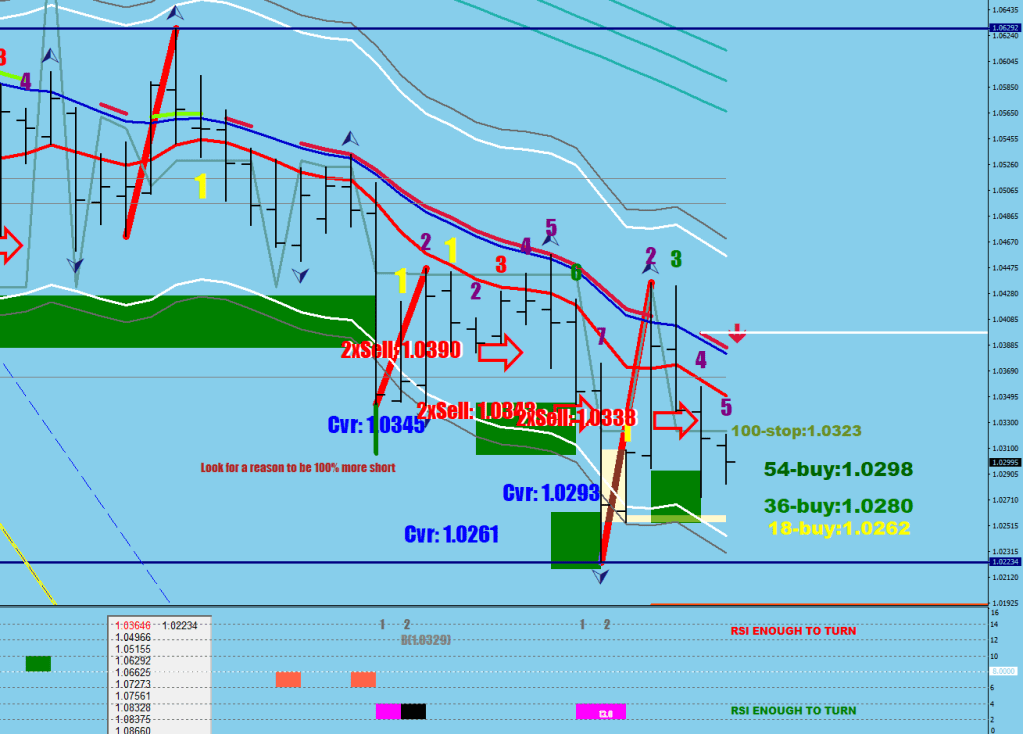
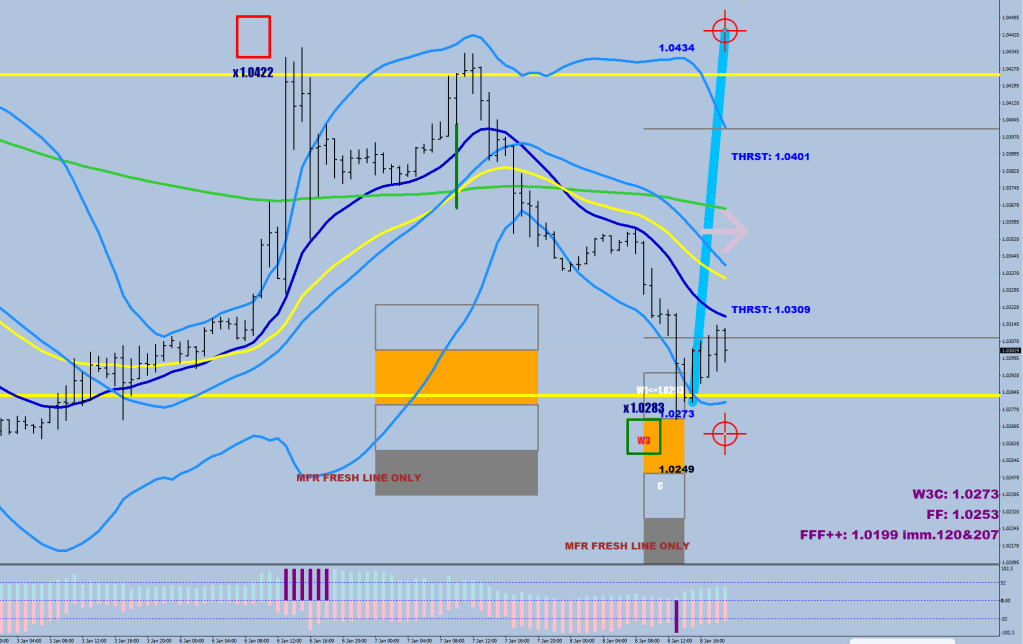
Buy 6 pips below the black candle’s close (1.0280) and add more if it moves lower for up to 16 pips.
The next three reactive lines are at 1.0381 and 1.04045 and 1.04337. Any of these could & should see a 25-pip counter move at least, but trail to be prudent.
The 2-hour thrust down took the price to the support level relative to the consolidation mean, 37 pips away (a no-break extension).
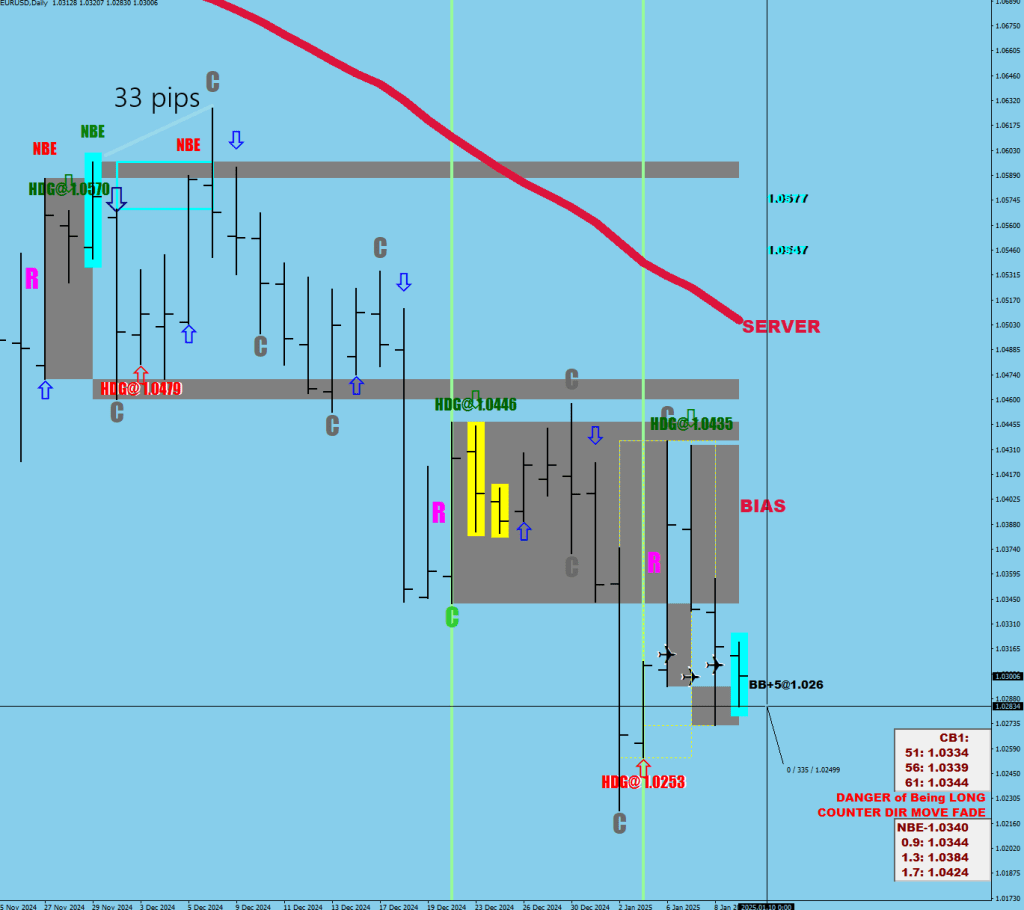
The next move should be a lift and square: a candle breaking above the 30 SMA and a consecutive candle with a 16+ pips wick on the bottom of it. Wherever that candle closes, 6-16 below would be the hot area to go long.
I expect to see a liquidity break, a rally at least 2 days long which would tackle the upper BB30 three times in a row. The 9-day EMA seems totally attainable in the coming days.
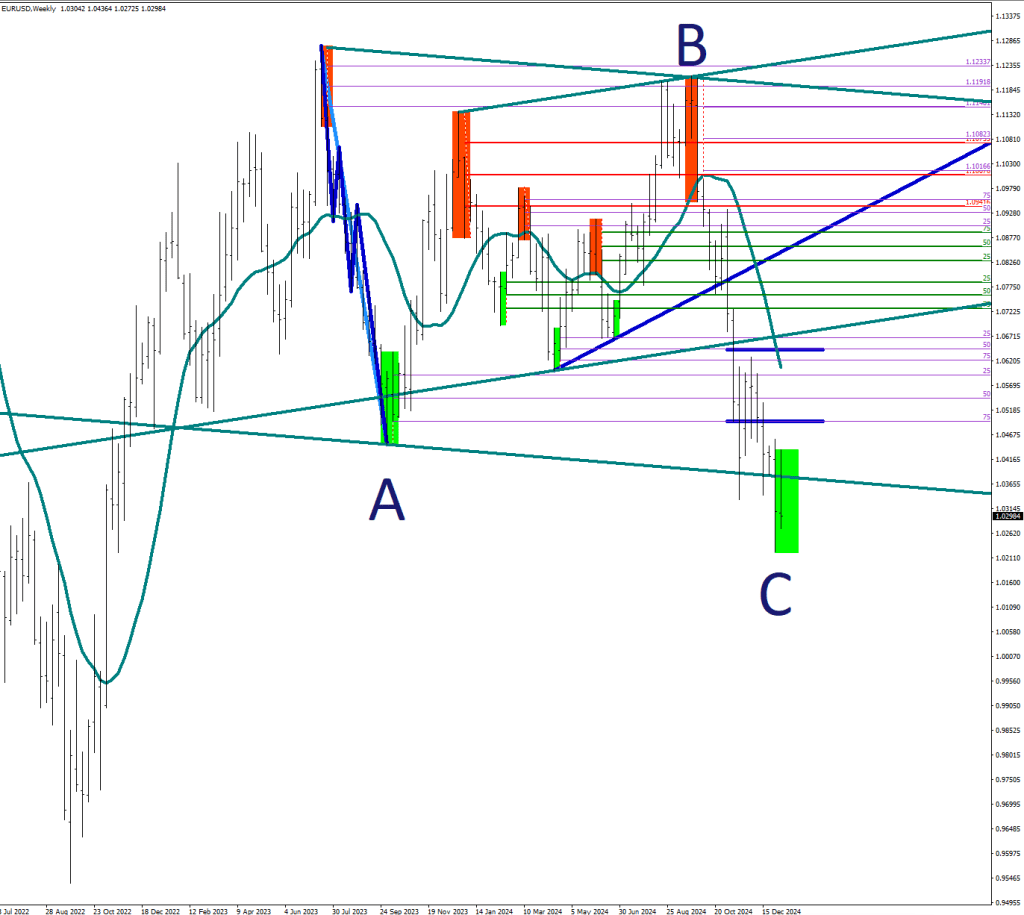
In short, 92-95 pips run up, then two bowbacks making a bid for the low, one close, the other closer, but a match of the F3 low on the second attempt, and then… it is all over.
The last two F3-s looked like this:
If you consider A and B prints, the first A would be a bit longer than the second, and the first B would be longer or equal to the second. This is a contracting pattern. Length? 3-8 days.
According to this blueprint, the first A should take the price to 1.0304-1.3010
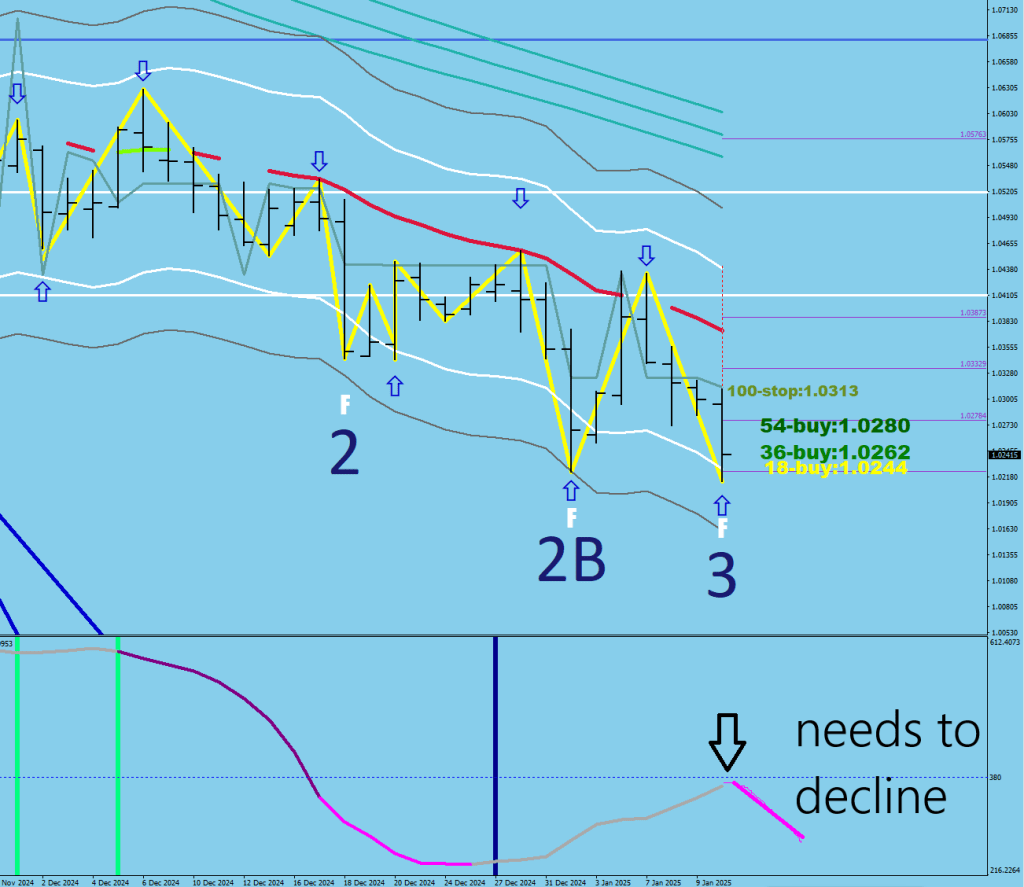
#1 When the total regime change happened at the top, the entire consolidation took place below the 16 EMA. So it is not enough to be on the other side of the 80 line, it must be high-basing to turn.
This therefore did not qualify.
The current problem with the reversal is that the volatility is rising.
The third important clue was the failure to the leg 3 (which resulted in having to rename it as a 2B) was again too much volatility. Believe it or not, a steep 2-day incline is not productive.
See those red diagonal lines? They are steep 2-day inclines that I call liquidity breaks. All of them have resulted a lower low, and only two of them had a re-visit/beat by 5 and 11 pips namely.
Two days and 100+ pips and the rally is spent.
if (iHigh(symbol,0,iHighest(symbol,0,MODE_HIGH,2,j))-Low[i]>1000*Point && iHigh(symbol,0,iHighest(symbol,0,MODE_HIGH,2,j))<iMA(symbol,0,9,0,MODE_EMA,PRICE_HIGH,iHighest(symbol,0,MODE_HIGH,2,j))+600*Point) ObjectSet("Liquidityx"+i,OBJPROP_COLOR,clrRed);
         ObjectSet("Liquidityx"+i,OBJPROP_WIDTH,9);
         ObjectSet("Liquidityx"+i,OBJPROP_BACK,1);
Other than that, the “3” did not register on my RSI2 scale which would make it equal to the one at the top. Strong divergence.
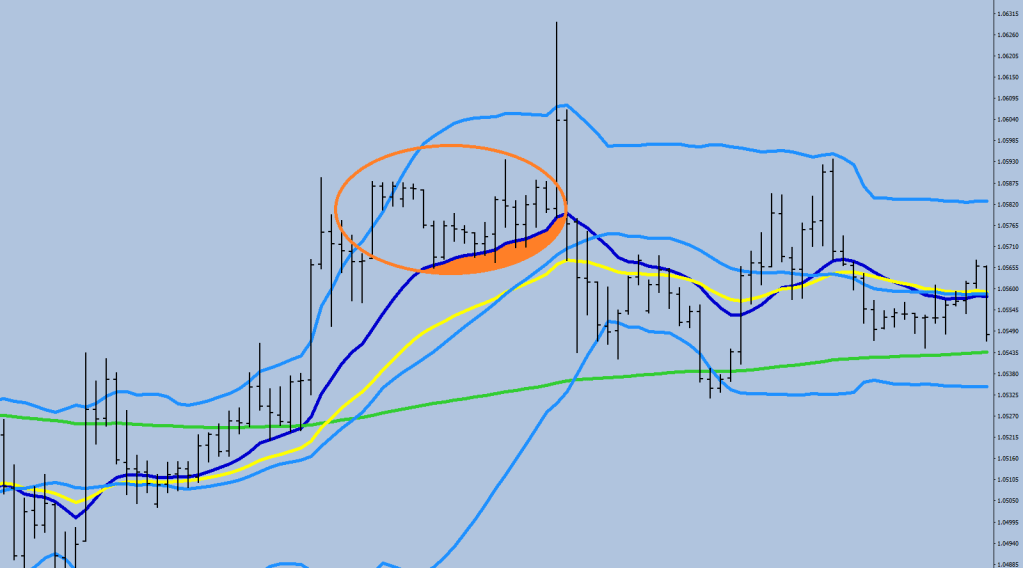
The idea is that a market maker closes out a block with balanced books (no excess holdings in the wrong direction), thus making a brief countermove. We are going to try to spot and plot these.
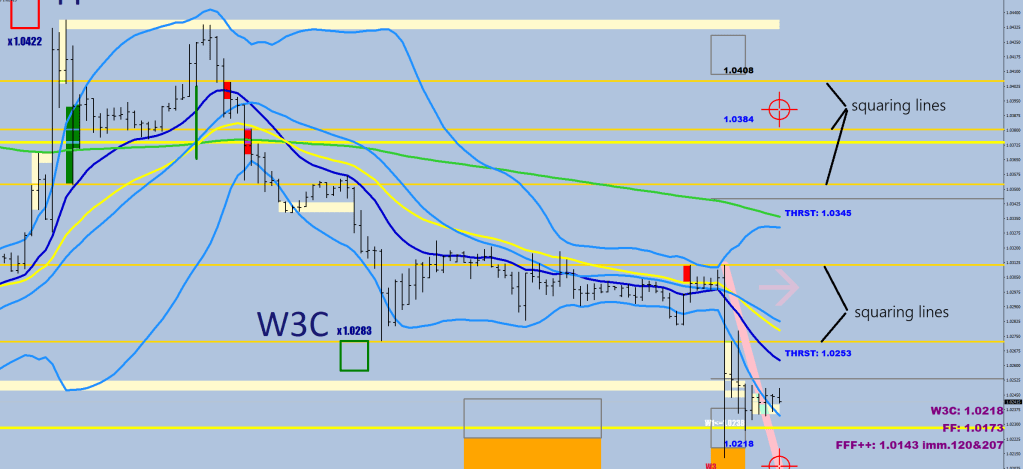
Our canes are 3 lines, the 30 sample BB Upper, Lower and Main.
On the upside: lift and square (green boxes)
I am looking for a move above the MAIN or the UPPER line on the previous 2 candles, an ascending 16 EMA, and a lower wick greater than 16 pips.
Once the plot is made, the early bird can get in on a dip below the candle close on the upper examples by 6 pips up to 16 pips.
The squaring lines are relatively safe spots to put stop losses beyond.
On the downside: crack and square (red boxes)
The downside works similarly, but instead of a separation, I am looking for a crack, then a follow-up candle that has an upper wick of 8+ pips (yes, another arbitrary number).
I added one extra condition with a combination of the 2 bands, which is a combination of the two bands when a squeeze makes a move like this possible.
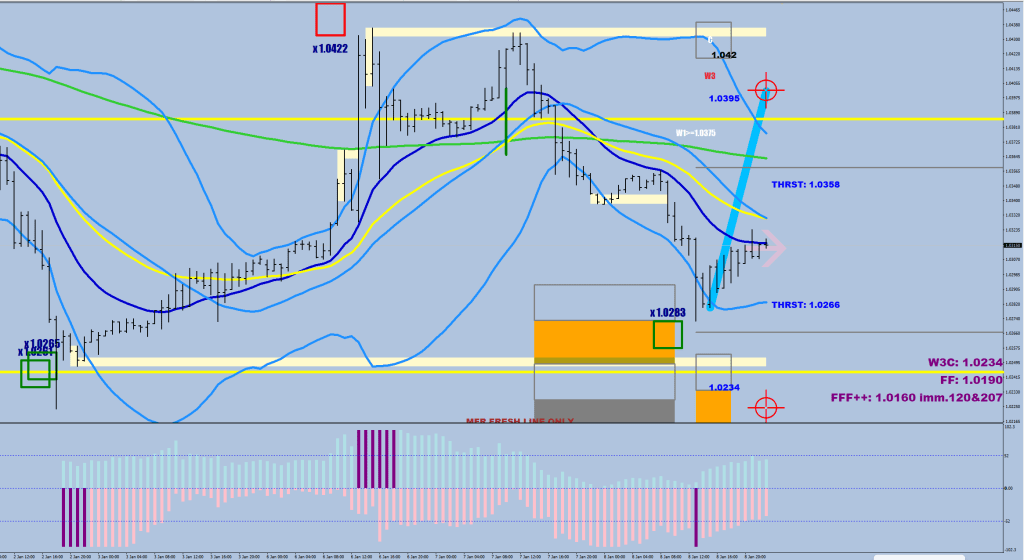
The noodles that the market could make an acceleration/thrust from.
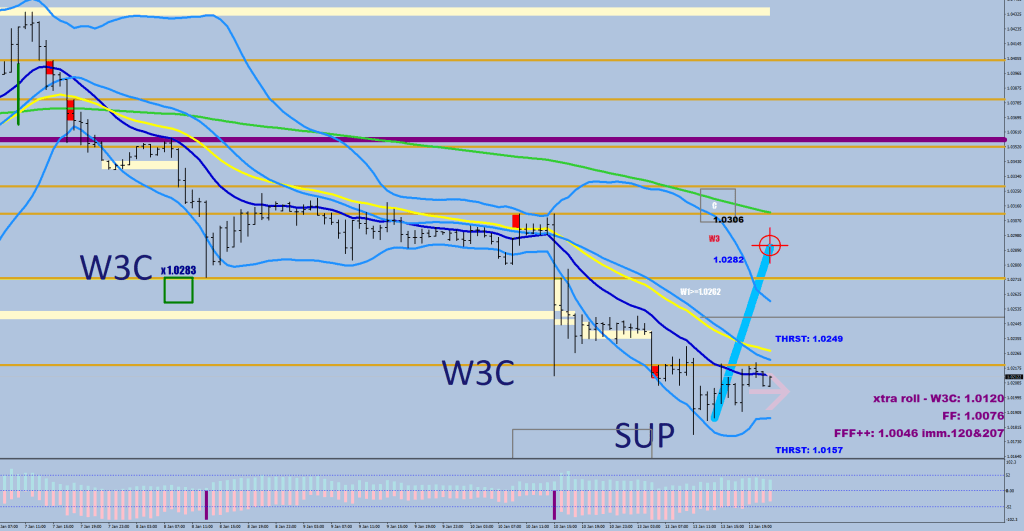
I’ve listed 3 check points that are statistically likely for a terminal move.
I should have considered having a full charge, in that case, the gray line (THRST/No Break Extension) is a slim chance.
The second down candle was a push against the weekly low. It was good enough for another pierce beyond the 1.0250 level.
Now comes knowledge. The third candle hit a traction surface (back and forth through the 30-BB).
Notice on the following examples how a bull flag cand disable this secondary entry.
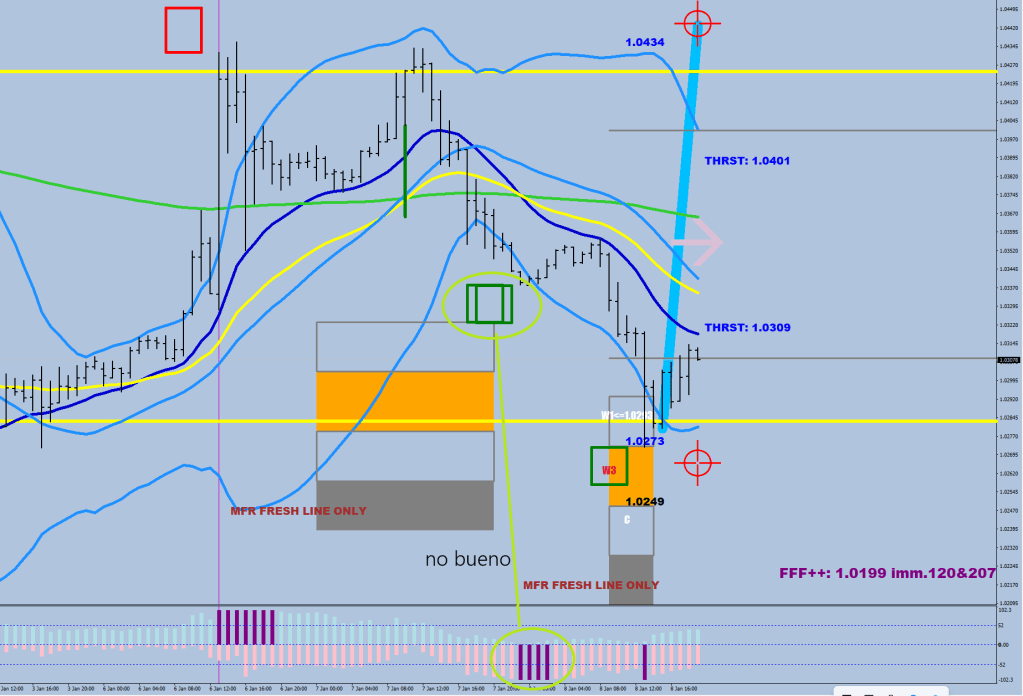
Now? One lifeline has been used; the 8 EMO should be the next to have some grip – a 3-5 hours long sell. I could picture another low that is lower than 1.0226 but would fall shy of 1.0213.
The importance of the last full candle outside the BB.
You either get a pullback to the 16 EMA for a continuation (with a break out beyond at some point), or multiple closes start to print on the other side of the 16 EMA for a reversal.
What do the Brits always say? Simples.
if ((High[i]>iBands(symbol,0,30,2,0,PRICE_MEDIAN,MODE_UPPER,i) && Low[i]<iBands(symbol,0,30,2,0,PRICE_MEDIAN,MODE_UPPER,i) || (High[i]>iBands(symbol,0,30,2,0,PRICE_MEDIAN,MODE_LOWER,i) && Low[i]<iBands(symbol,0,30,2,0,PRICE_MEDIAN,MODE_LOWER,i))) &&
   ((High[i+1]>iBands(symbol,0,30,2,0,PRICE_MEDIAN,MODE_UPPER,i+1) && Low[i+1]>iBands(symbol,0,30,2,0,PRICE_MEDIAN,MODE_UPPER,i+1))
|| (High[i+1]<iBands(symbol,0,30,2,0,PRICE_MEDIAN,MODE_LOWER,i+1) && Low[i+1]<iBands(symbol,0,30,2,0,PRICE_MEDIAN,MODE_LOWER,i+1)))
){

               ObjectCreate("KAROLYI"+DoubleToStr(i), OBJ_RECTANGLE, 0, Time[i+2], High[i+1] , Time[i+1], Low[i+1]);
              ObjectSetInteger(0,"KAROLYI"+DoubleToStr(i),OBJPROP_COLOR,clrLemonChiffon);
              j=i-1;
           if (High[i+1]<iBands(symbol,0,30,2,0,PRICE_MEDIAN,MODE_LOWER,i+1)){
              while (j>0){
               if (Close[j]<Low[i+1]) break;
               j--;
              }
              ObjectCreate("KAROLYII"+DoubleToStr(i), OBJ_RECTANGLE, 0, Time[i+1], Low[i+1]+50*Point , Time[j], Low[i+1]);
              ObjectSetInteger(0,"KAROLYII"+DoubleToStr(i),OBJPROP_COLOR,clrLemonChiffon);
           }
           else if (Low[i+1]>iBands(symbol,0,30,2,0,PRICE_MEDIAN,MODE_UPPER,i+1)){
              while (j>0){
               if (Close[j]>High[i+1]) break;
               j--;
              }
              ObjectCreate("KAROLYII"+DoubleToStr(i), OBJ_RECTANGLE, 0, Time[i+1], High[i+1]-50*Point , Time[j], High[i+1]);
              ObjectSetInteger(0,"KAROLYII"+DoubleToStr(i),OBJPROP_COLOR,clrLemonChiffon);
           }
}