No Top

While the market is accelerating, the move is not over.

An impulse wave ends in a reversal divergence. 3.98x Fluctuation Maximum was the measuring leg.

For the divergent, I placed the gray band at 3.8x.

Could take 2, or even 3 more days to set the divergence.

As for the level itself, it should be above 1.1045, the bumper line for a Shaded Powder Box to print.

1.1028 is an important long cover number – 1.0997 was used today.

1.1072 is the next weekly level – likely will not get there.


I’m getting Ashur Daved handed to me. Not entirely out yet though.

Achilles Dent: A White Shark’s Christmas

Love Changes Something

Confession time.

I get trapped badly by the very same setup over and over again.

1 The shot over the bow – 2 final leg – 3 break the bow sequence

The funny thing is, I’m the only person on the planet who made an indicator to avoid this.

 if (ExtATRBuffer[ArrayMaximum(ExtATRBuffer,45,i+1)]<50 && ExtATRBuffer[i]>50){
   ObjectCreate("Pepper"+IntegerToString(i), OBJ_TREND, indicator_window,  Time[i], ExtATRBuffer[i], Time[i], 31);
                     ObjectSetInteger(0,"Pepper"+IntegerToString(i),OBJPROP_COLOR,clrBlue);
                     ObjectSet("Pepper"+IntegerToString(i),OBJPROP_BACK,1);
                     ObjectSet("Pepper"+IntegerToString(i),OBJPROP_RAY_RIGHT,false);
                     ObjectSet("Pepper"+IntegerToString(i),OBJPROP_WIDTH,14);   
 
 }
  if (ExtATRBuffer2[ArrayMaximum(ExtATRBuffer2,42,i+1)]<50 && ExtATRBuffer2[i]>50){
   ObjectCreate("Pepper"+IntegerToString(i), OBJ_TREND, indicator_window,  Time[i], ExtATRBuffer2[i], Time[i], 31);
                     ObjectSetInteger(0,"Pepper"+IntegerToString(i),OBJPROP_COLOR,clrBlue);
                     ObjectSet("Pepper"+IntegerToString(i),OBJPROP_BACK,1);
                     ObjectSet("Pepper"+IntegerToString(i),OBJPROP_RAY_RIGHT,false);
                     ObjectSet("Pepper"+IntegerToString(i),OBJPROP_WIDTH,14);   
 
 }

Of course, I had to specialize in one single instrument first. Well, at least now I am certain that I should be looking for a Gray divergence, not a yellow one.

Achilles Dent: Love Changes Something

W5

So far it is following the script.

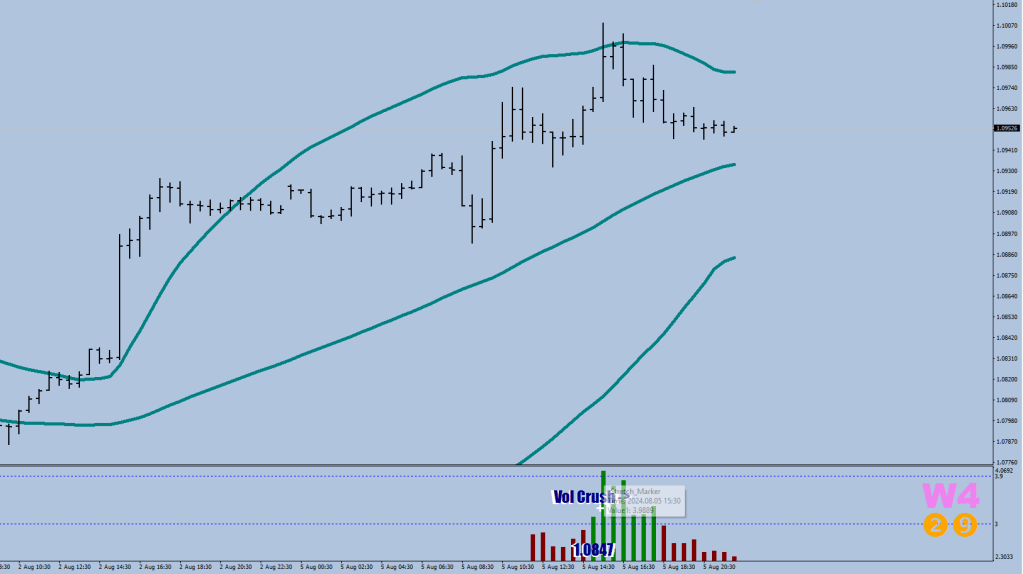
In one single day up to the 2.2 Gray band (1). 15 pips pullback by the close. 150 pips off the W4 low VS 155 in the prior example.

The next day should make an additional 15-pip dip, but the overnight spread expansion may just strip away half of that.

The extension in the prior example over the 3rd Wave’s swing point was 23 pips more, straight into the 2.8 (white band), followed by the back test of the swing high for the next big leg.

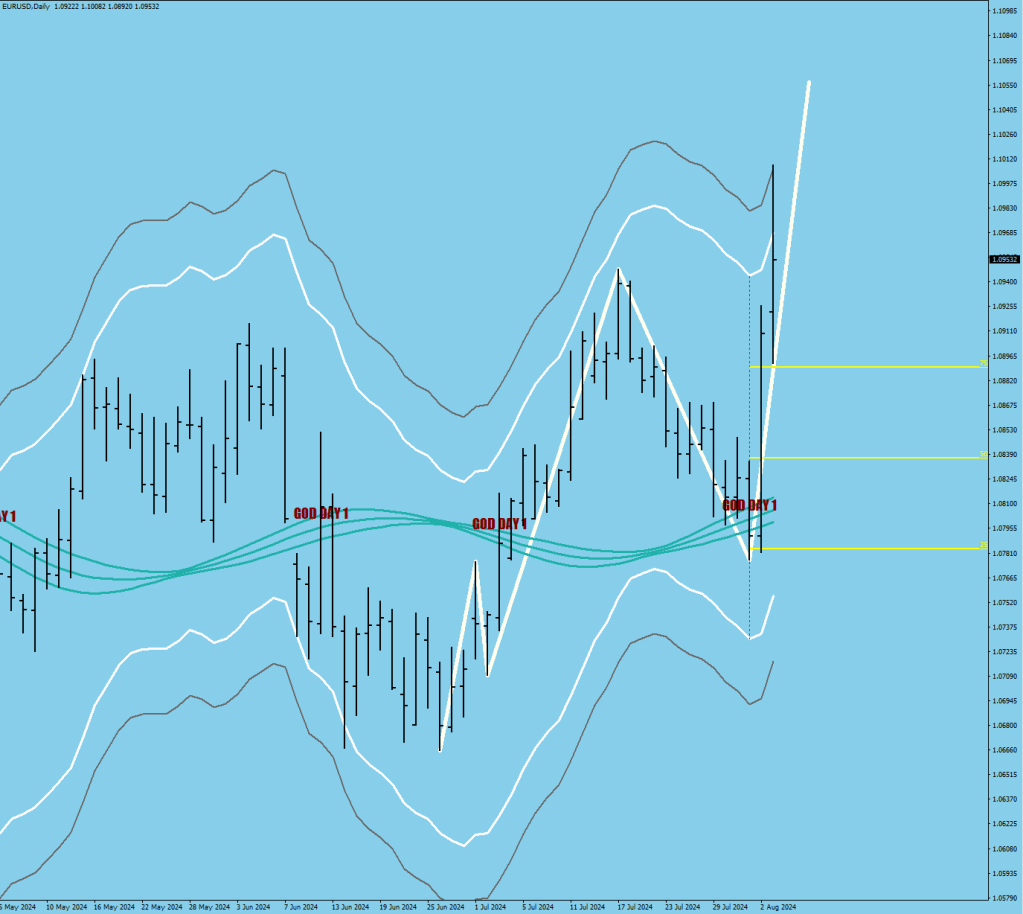
Notice the number of days. 5 to the ultimate high. A Wave 2 may only be 1 to 2 days, but a Wave 5 would take longer.

Deep W4

W1 and W4 have kissed. This looks like an expanding wedge (working up volatility).

The white brackets are 2.8 fluctuation maximum away from the E-9. The 3 lines are 25, 50, and 75%.

The deepest pullback would not make it to the band but would have a very hard time closing below the 3rd line.

The closest example to what is happening is this:

Let’s mirror it.

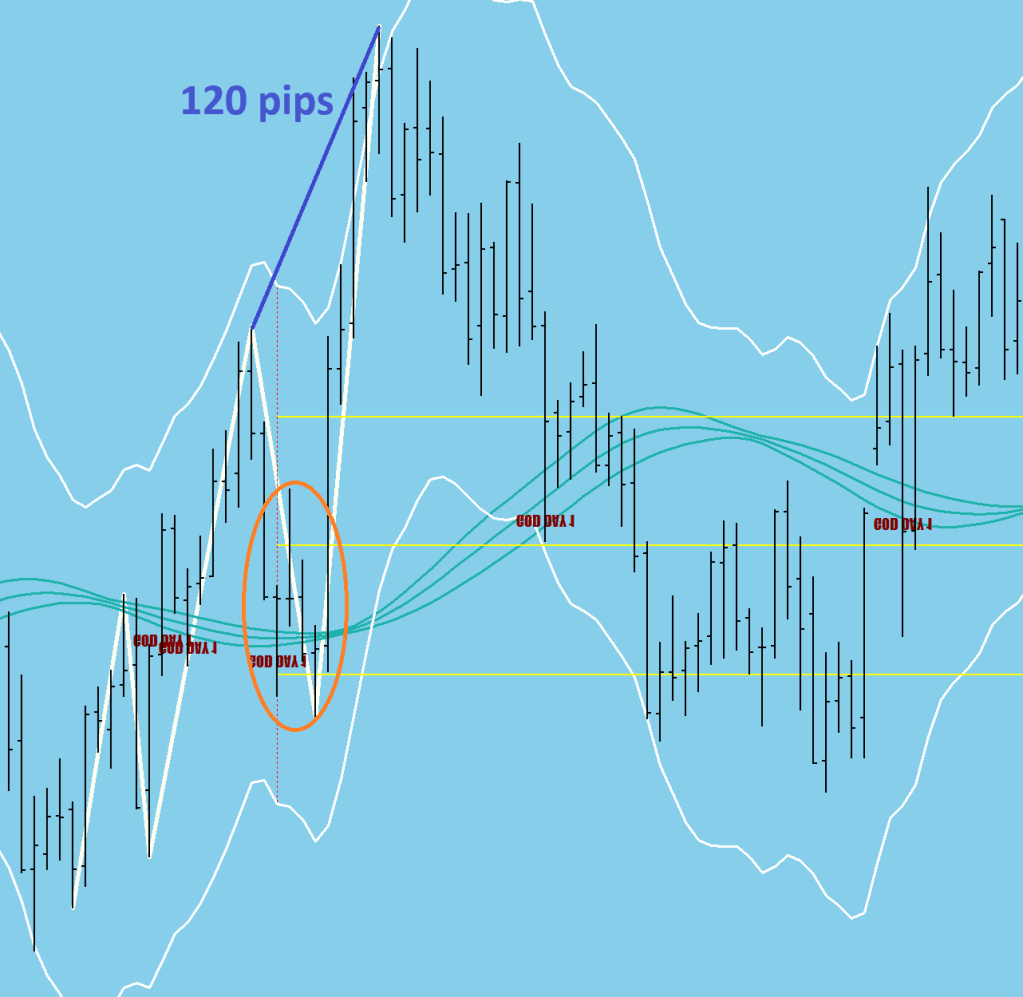
In the orange oval, there was a reflex bounce of 85 pips – this is consistent with the current Gray divergence calling for an 88+ pips correction. Then price came back once more and faked out the prior swing.

The distance from the W3 peak to the W5 was 120 pips.

Shot In the Light

I have a lecture about the structure of a swing, but it would take a lot.

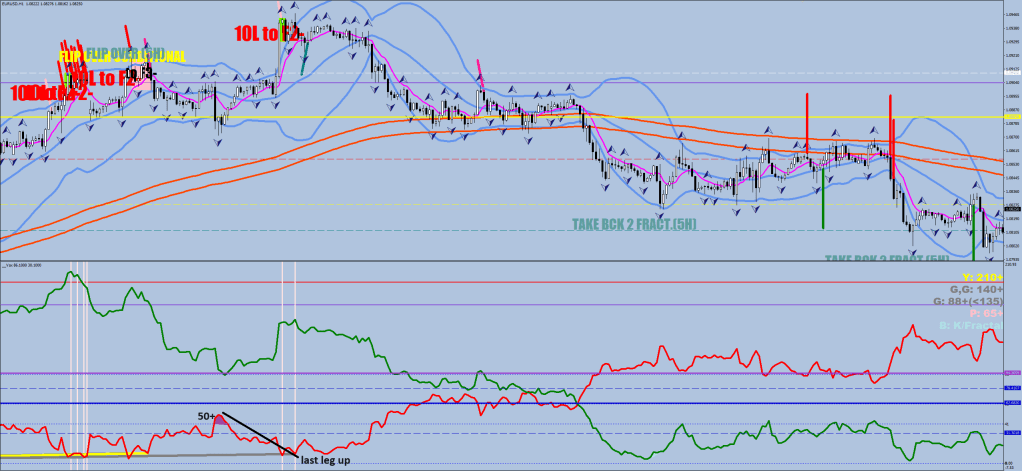
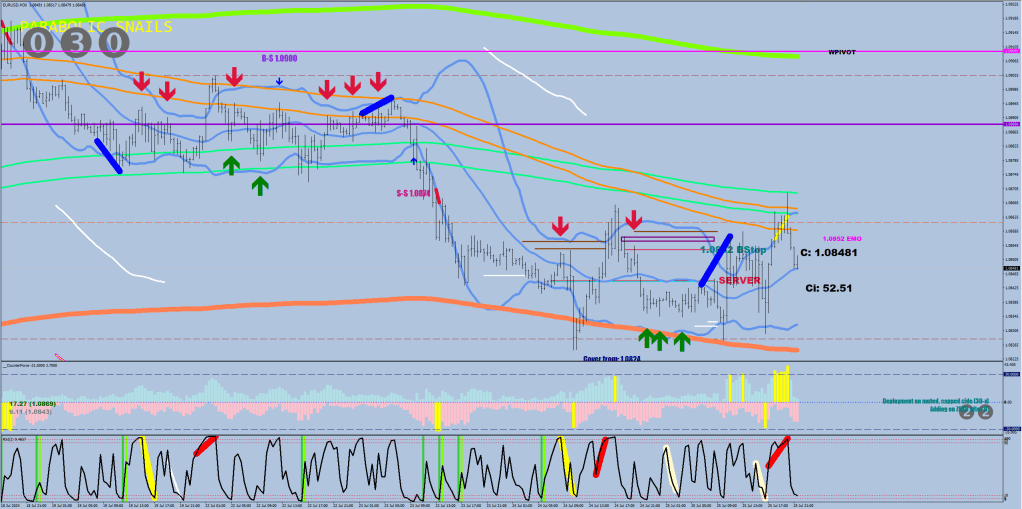
In the meantime, here’s the “shot over the bow” condition, a 50+ counter-directional volatility read (from the 20-hour lowest low/highest high) after an extensive choke.


Album #18

“When the doves try”

“Do the locking motion with me!”

“Spank for the very first crime”

“Prison break smoke break”

“I am going to bill this kill under pleasure”

“Mama, I’m subliminal”

A handful.

Money Flow Signals

These summer doldrums are low-volume days. You are trading what Hedge Funds commit to, not against CTAs and other players. It truly feels like trading Bitcoin futures.

The only signals to be taken into account are money flow divergences.

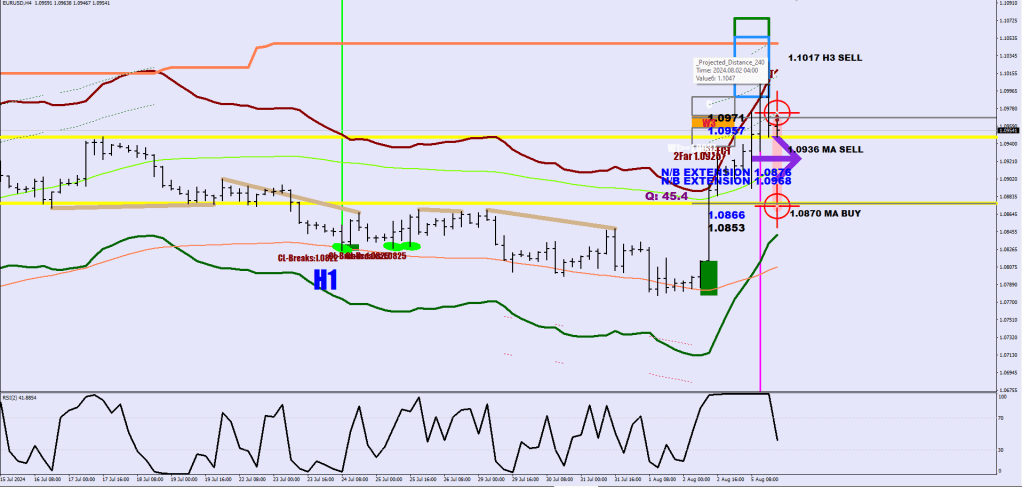
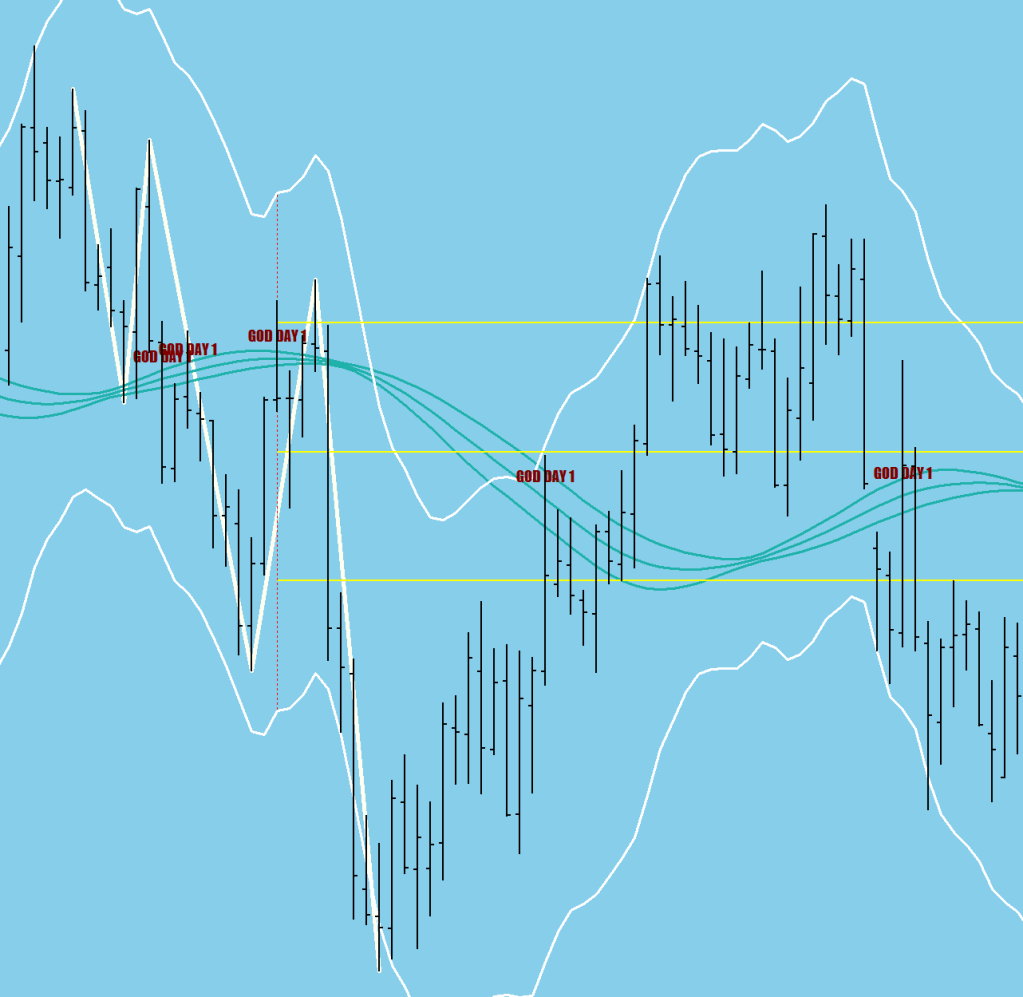
The following is a major money flow divergence – relative to the 120 sample stochastics.

The reason why this does not print as a False start is that the stochastic is diverging itself – nevertheless, this is a good divergence play with the money flow not getting even remotely oversold.

There is one more thing that can yield some security and that is the volatility reserve. The lower line is a start from a greater compression, so there is less distance to be had.

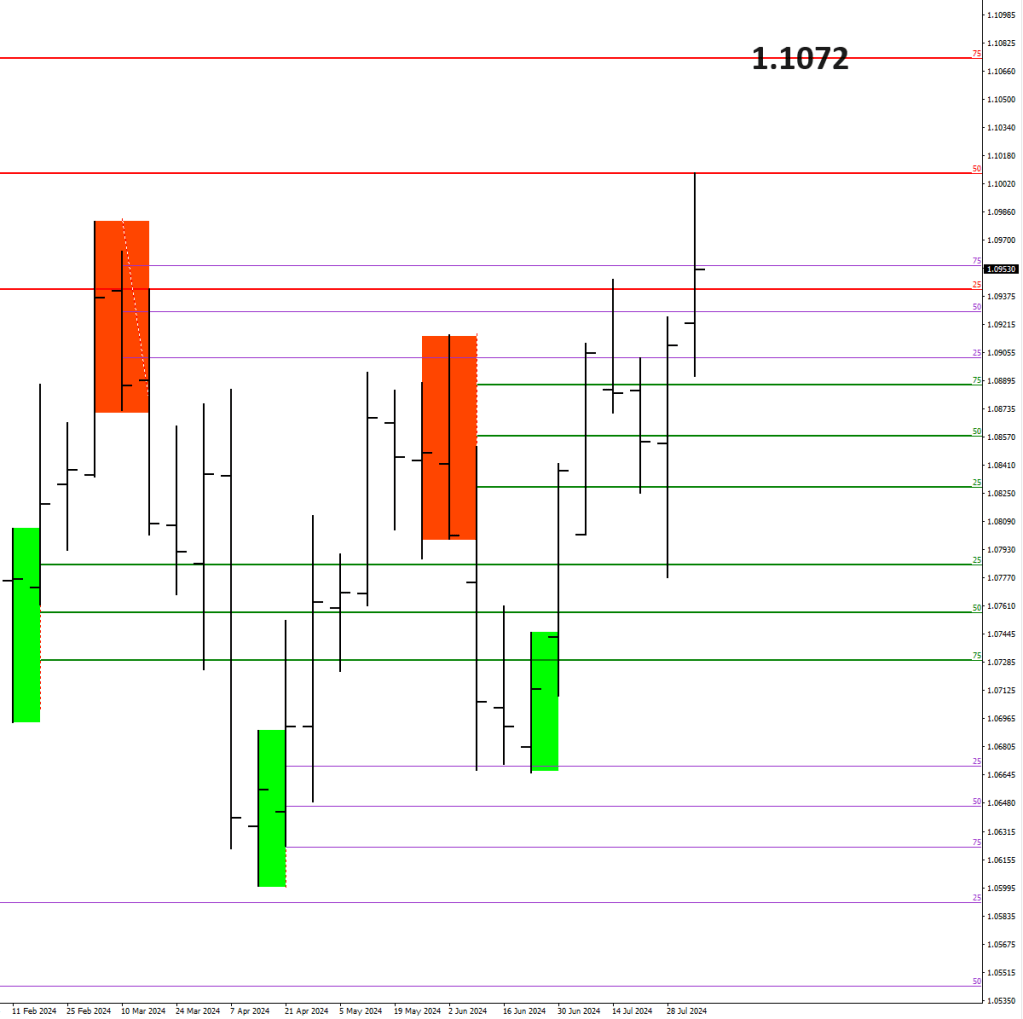
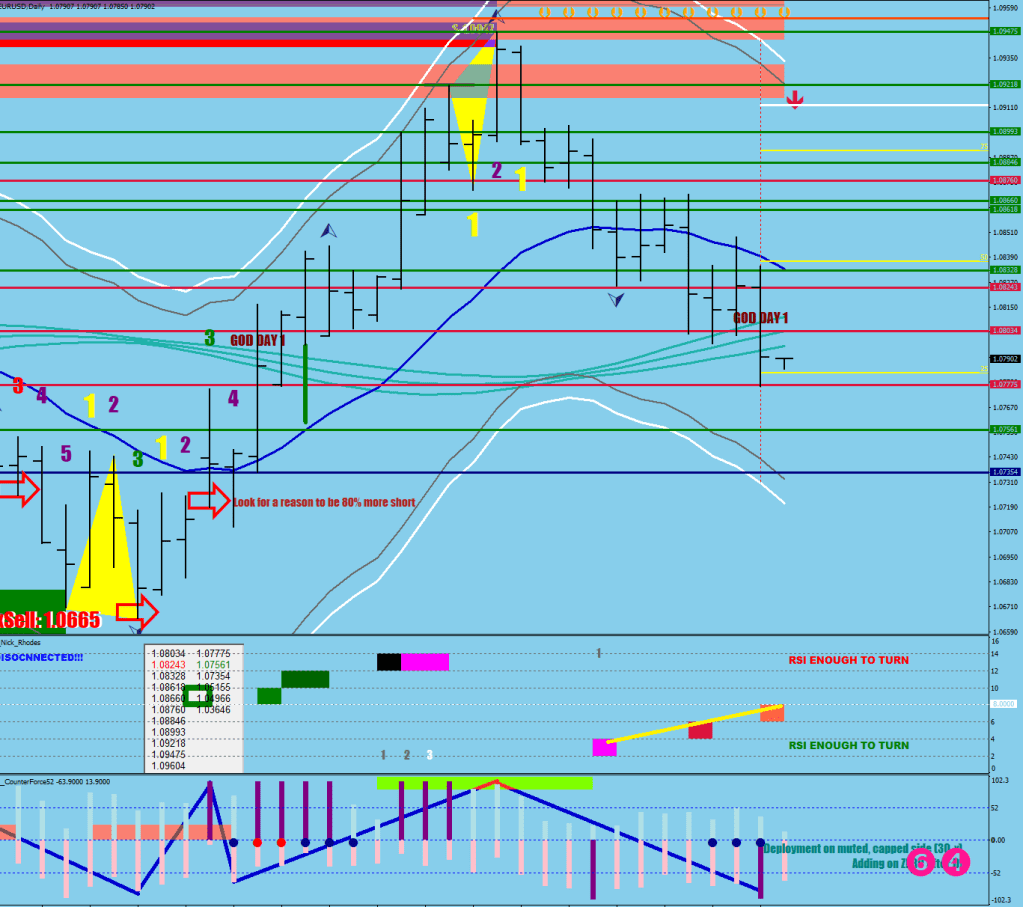
The Goldilocks is currently 1.0801

The Money Flow flip on the 4H is the ultimate control routine.

The (Money Flow) False Start is a conditional control routine. You must factor in where the market is trading and yield to the signal that is in line with the swing’s color.

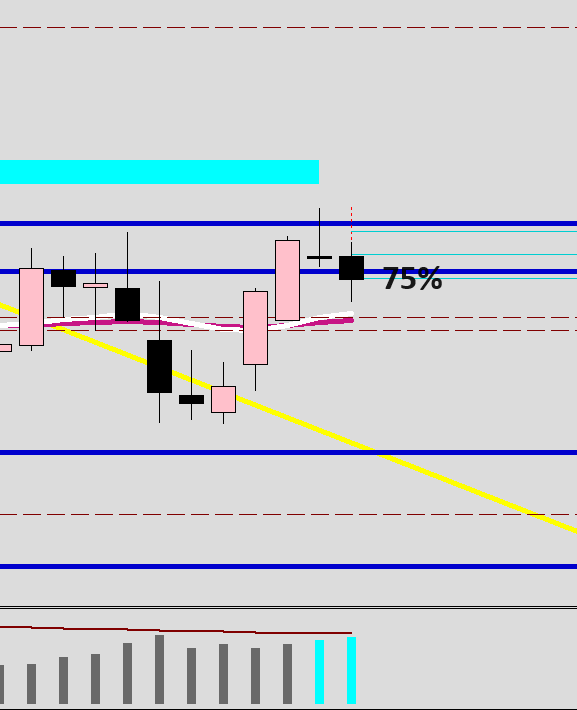
The swing that the price is currently testing is a swing high, so you want to put your faith in the false starts appearing to the upside.

Now the fake out was made as well.

What’s The Damage?

I’d say none.

The price is working inside the previous swinghigh and just came down to test the close of it.

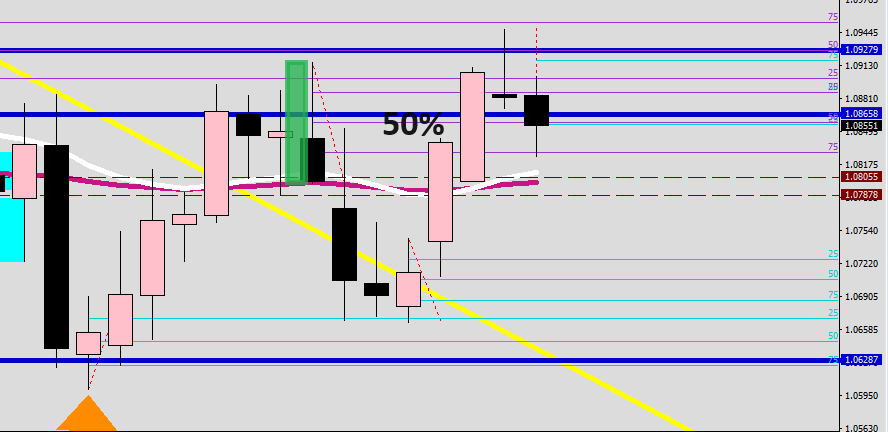
By the way, you can have the Fib tool list the price level in MT4, just put “%$” in the level’s description.

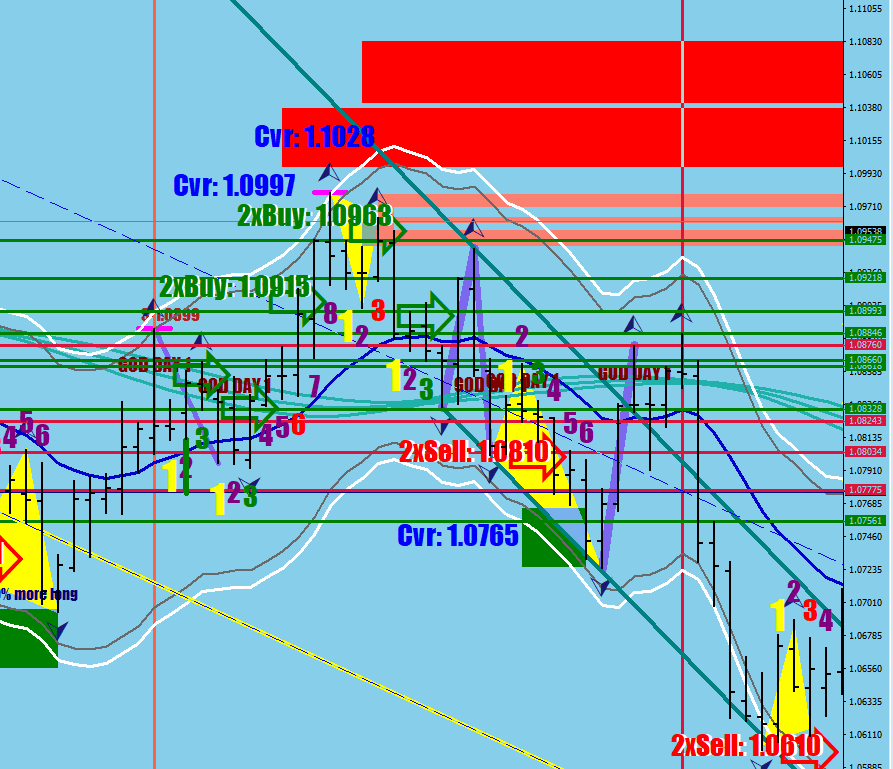
The whole story is about these pro-volume dudes.

Take these candles seriously, because whoever has assigned/parked capital in this market, would most likely like to avoid a drawdown. Doubling down is one way of doing this.

Taking back 2 fractals would put the price back to just below 1.09


We were put on this planet to make music. I know this now.

Bezos, sell some shares. Rihanna, hit it!

Achilles Dent: Umbrella Movie Time

Do We Have A Swing High?

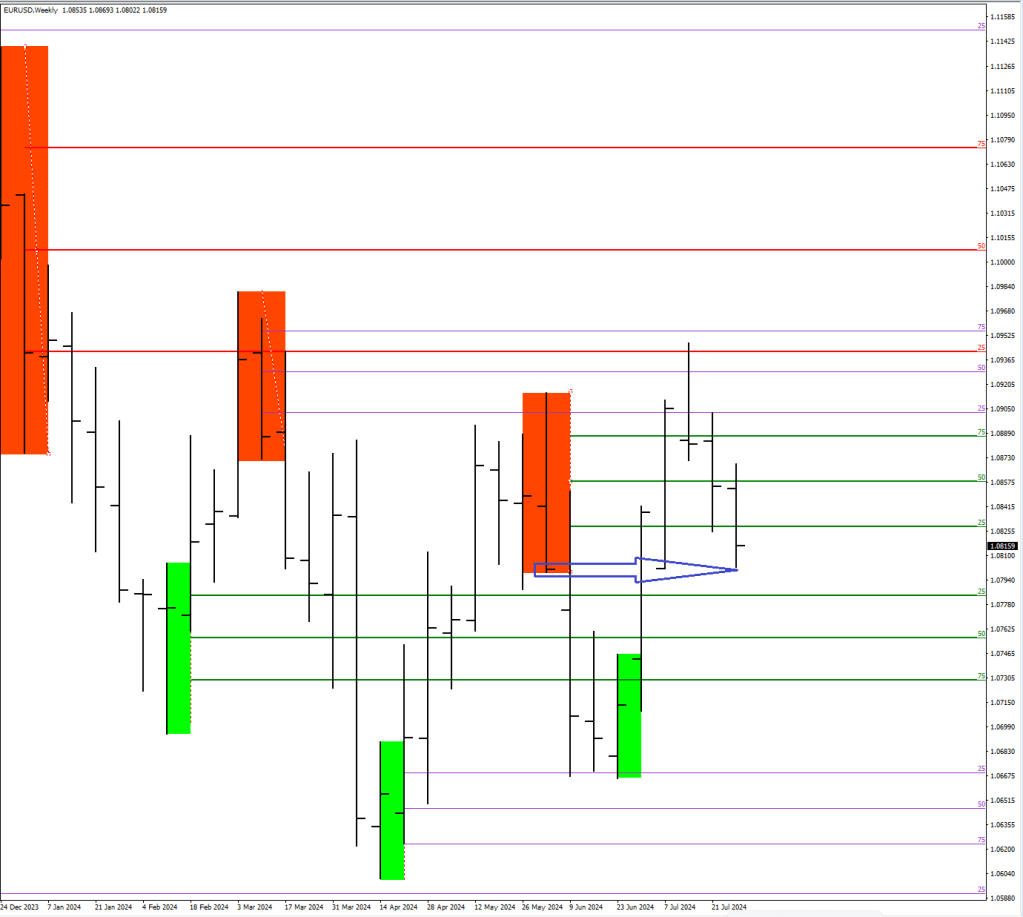
You decide. Depending on the available volatility, a weekly swing would be 266+ pips in the direction of progression or 611+ (18-sample bracket), so it is a very good idea not to fight what is going on to prevent some serious pain.

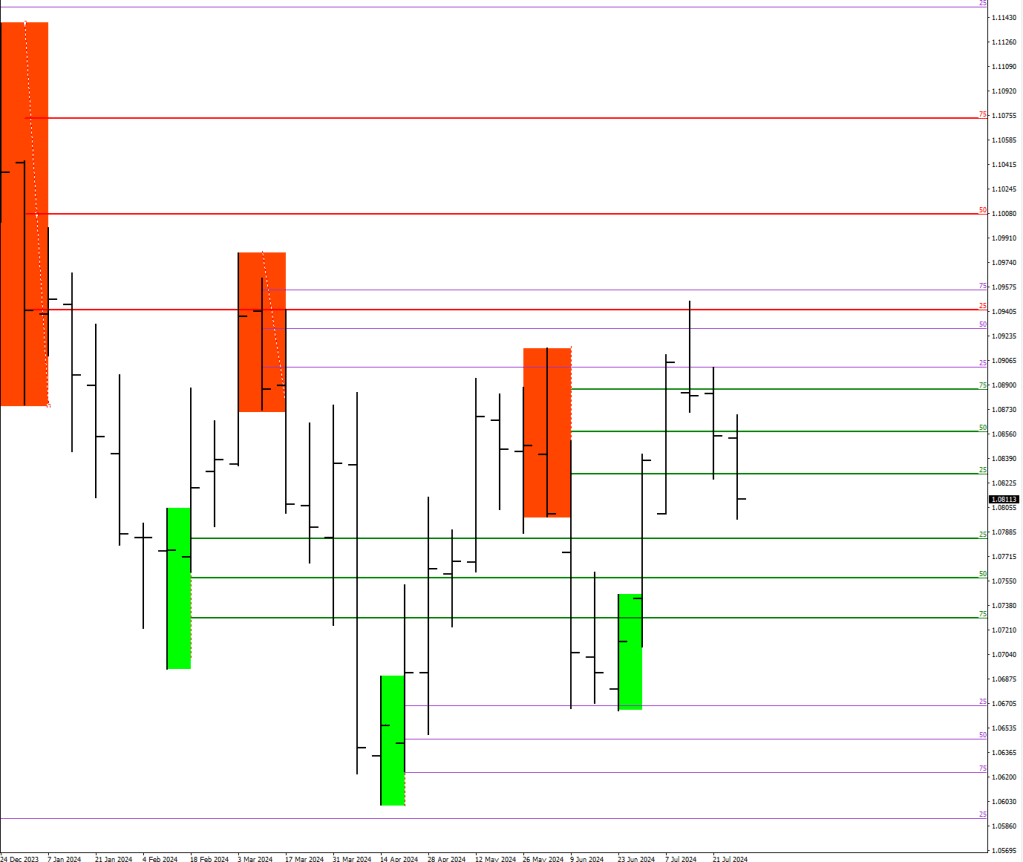
There is a checklist for a swing high (not identical for a swing low).

It involves the 18-sample volatility, a 2 or 3-candle sequence with one pink and one black candle, the close-down by 91+ pips at the first black progression candle, and there is one more thing: the close-down candle has to be below the 75% marker.

Of course, the high could have been made by the prior candle, so the next example managed to do this, even if barely.

The current close is so much on the fence, that it is ridiculous. Both by the 93 pips down close and the 75% marker.

What is even more off here is the back-to-back second pro volume week. I am biased, as you know, but I think this is all a Wave 4 accumulation before the move up beyond 1.1029, towards which they would be handing out Euro longs.

The current close is also at the previous swing high’s 50 % marker.

Heroes

So I connected the Pro Volumes -> white line.

I added a red interrupted line with the next long cover level which is approximately 1.1030.

Measured the cross-over. 3 days for the backtest.

Wednesday: US rate decision.

Hop Hip

Me monkeying around on the 30-min RSi2.

//////buy (yellow)
   if ((RSI2[ArrayMaximum(RSI2,5,i)]>92) 
      && RSI2[ArrayMaximum(RSI2,5,i)]>=RSI2[ArrayMaximum(RSI2,12,i)] 
  // && (ExtATRBuffer2[ArrayMaximum(ExtATRBuffer2,30,i)]<37 || ExtATRBuffer2[ArrayMaximum(ExtATRBuffer2,30,i)]>60)
   && RSI2[i]<14 
   && RSI2[i+1]>10 
   && RSI2[i+12]>10 
   && RSI2[i+7]<90
   && RSI2[ArrayMaximum(RSI2,4,i)]<84 
   //&& ExtATRBuffer[ArrayMinimum(ExtATRBuffer,30,i)]*-1<ExtATRBuffer2[ArrayMaximum(ExtATRBuffer2,30,i)]
   && iBands(symbol,0,30,2,0,PRICE_MEDIAN,MODE_UPPER,i)-iBands(symbol,0,30,2,0,PRICE_MEDIAN,MODE_LOWER,i)>150*Point
   
   ){
         ObjectCreate("Popper"+IntegerToString(i),OBJ_TREND,indicator_window+1,Time[i],RSI2[i],Time[ArrayMaximum(RSI2,7,i)],RSI2[ArrayMaximum(RSI2,7,i)]);
         ObjectSetInteger(0,"Popper"+IntegerToString(i),OBJPROP_RAY_RIGHT,false);
         ObjectSet("Popper"+IntegerToString(i),OBJPROP_COLOR,clrYellow);
         ObjectSet("Popper"+IntegerToString(i),OBJPROP_WIDTH,16); 
         ObjectSet("Popper"+IntegerToString(i),OBJPROP_BACK,1); 
   }  
   
   
   ////sellside (red)
     if ((RSI2[ArrayMinimum(RSI2,12,i)]<14) 
     && (RSI2[ArrayMinimum(RSI2,6,i)]>28) 
    // && (RSI2[ArrayMinimum(RSI2,8,i)]<28)  
    //  && RSI2[ArrayMinimum(RSI2,5,i)]<=RSI2[ArrayMinimum(RSI2,12,i)] 
  // && (ExtATRBuffer2[ArrayMaximum(ExtATRBuffer2,30,i)]<37 || ExtATRBuffer2[ArrayMaximum(ExtATRBuffer2,30,i)]>60)
   && RSI2[i]>94 
  // && RSI2[i+1]<90 
  // && RSI2[i+11]<90 
   && RSI2[i+6]<80
   && RSI2[ArrayMinimum(RSI2,7,i)]>16 
   //&& ExtATRBuffer[ArrayMinimum(ExtATRBuffer,30,i)]*-1<ExtATRBuffer2[ArrayMaximum(ExtATRBuffer2,30,i)]
   && iBands(symbol,0,30,2,0,PRICE_MEDIAN,MODE_UPPER,i)-iBands(symbol,0,30,2,0,PRICE_MEDIAN,MODE_LOWER,i)>200*Point
   && High[i]>iBands(symbol,0,30,2,0,PRICE_MEDIAN,MODE_UPPER,i)
   ){
         ObjectCreate("Popper"+IntegerToString(i),OBJ_TREND,indicator_window+1,Time[i],RSI2[i],Time[ArrayMinimum(RSI2,7,i)],RSI2[ArrayMinimum(RSI2,7,i)]);
         ObjectSetInteger(0,"Popper"+IntegerToString(i),OBJPROP_RAY_RIGHT,false);
         ObjectSet("Popper"+IntegerToString(i),OBJPROP_COLOR,clrRed);
         ObjectSet("Popper"+IntegerToString(i),OBJPROP_WIDTH,16); 
         ObjectSet("Popper"+IntegerToString(i),OBJPROP_BACK,1); 
   }  

What I think is going to happen next is that the swing high does not get confirmed by the price closing above 1.0870.

Vax did not exceed its potential by plotting it on the hourly. Here I went with 18-sample.

A Major Swing has 611+ pips in one direction.

If you remember these numbers:

A swing high from the peak to the first down close seems to have no less than 91 pips as a rule of thumb.

1.0949->1.0858 would be a verifying weekly close – something above would remain in doubt.

Shapak Thukur presenting Achilles Dent’s poems

Could win…