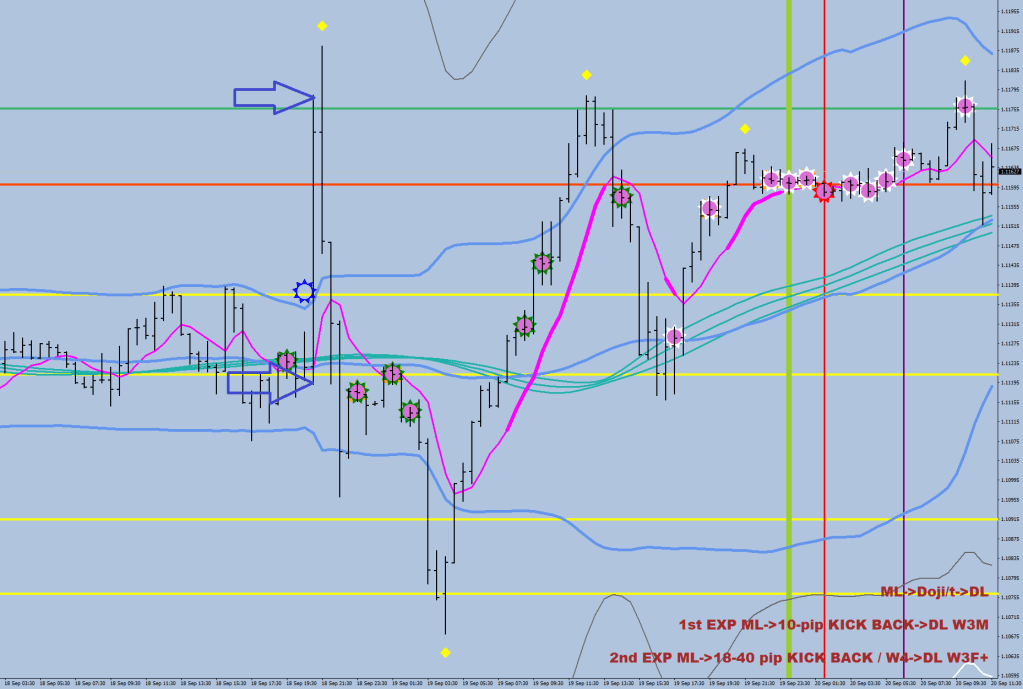
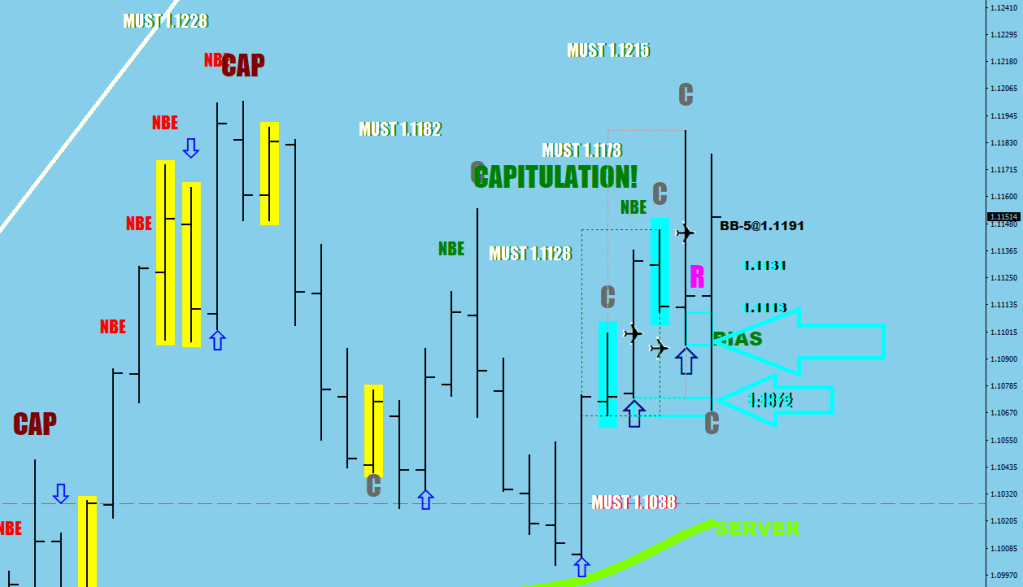
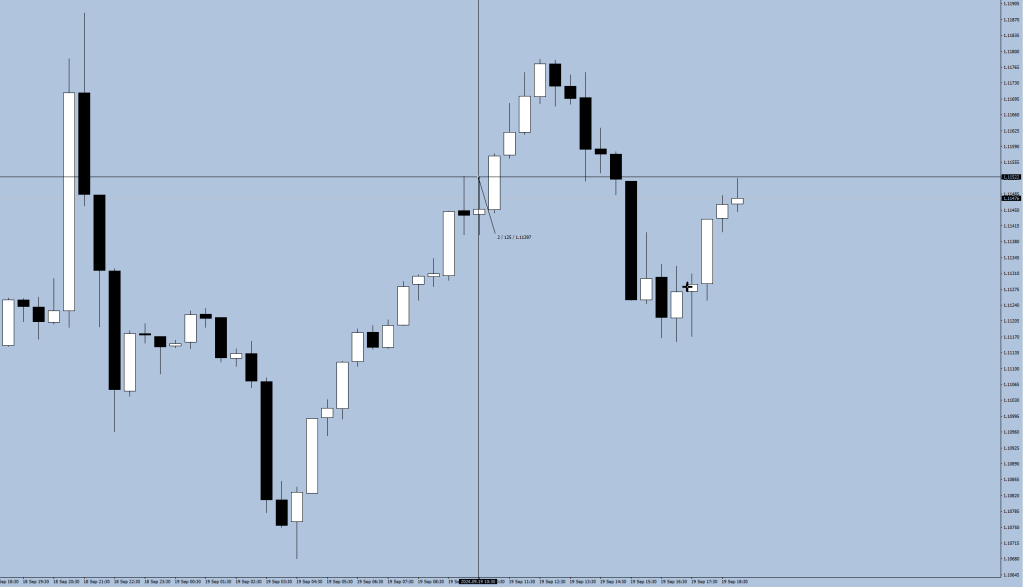
When they turn off the buy/sell program, the market – for once – gets a free, balancing move.
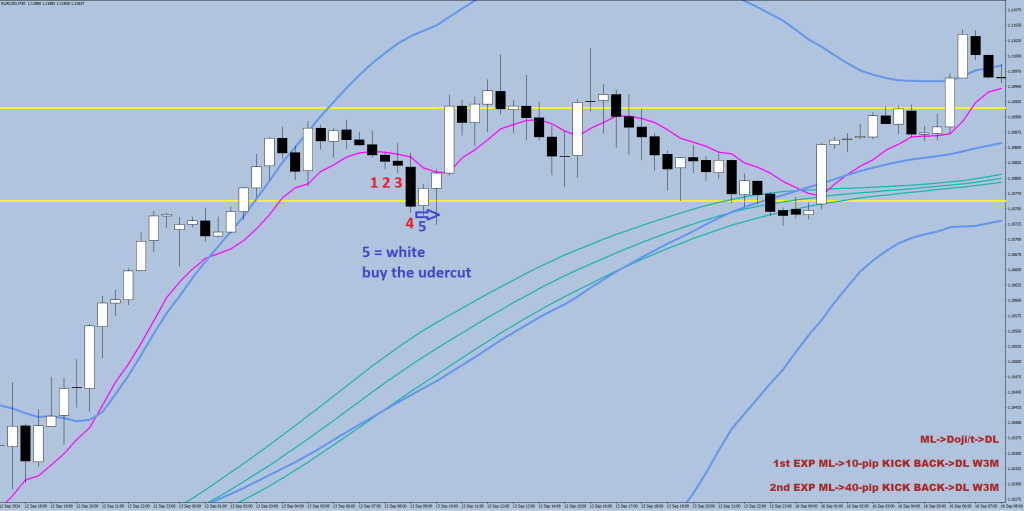
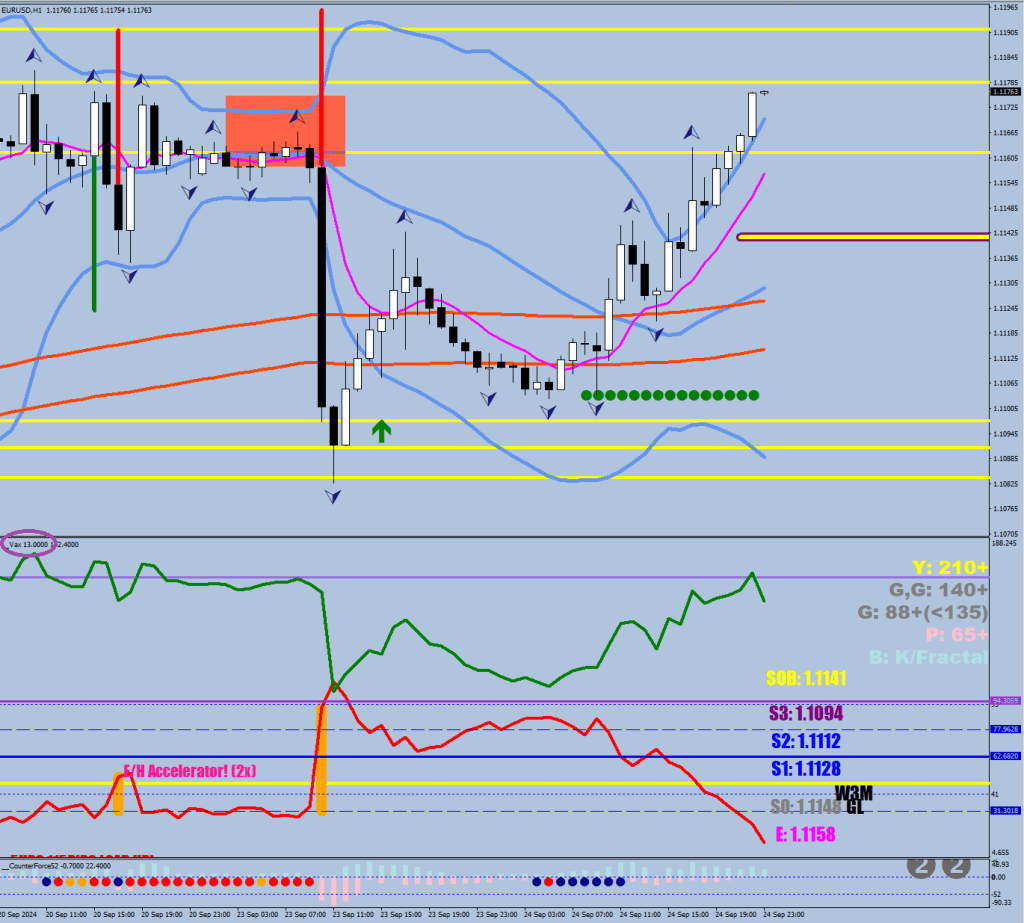
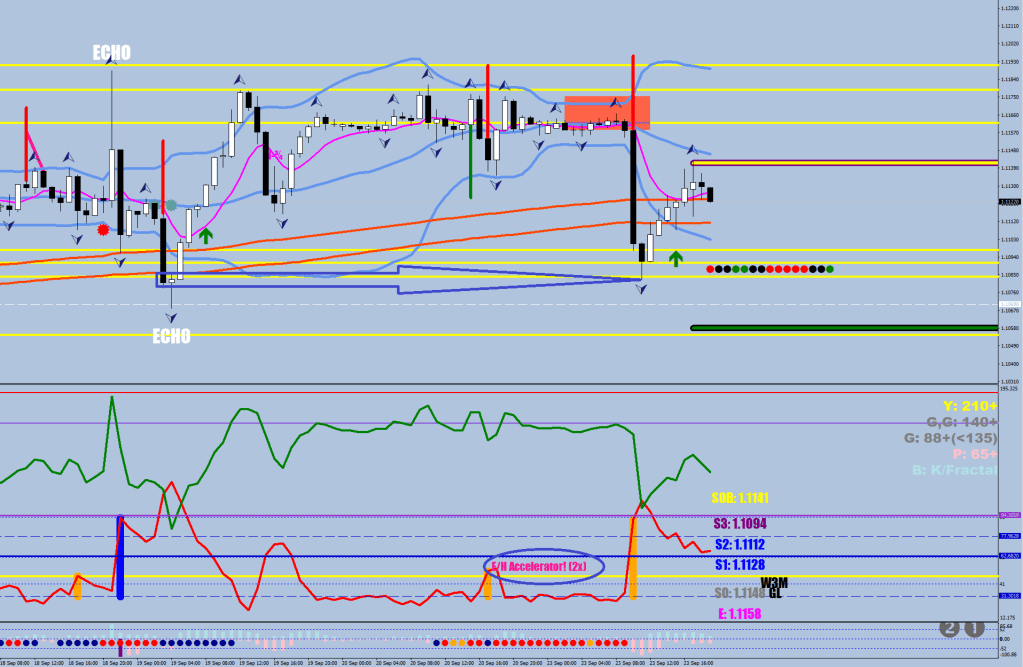
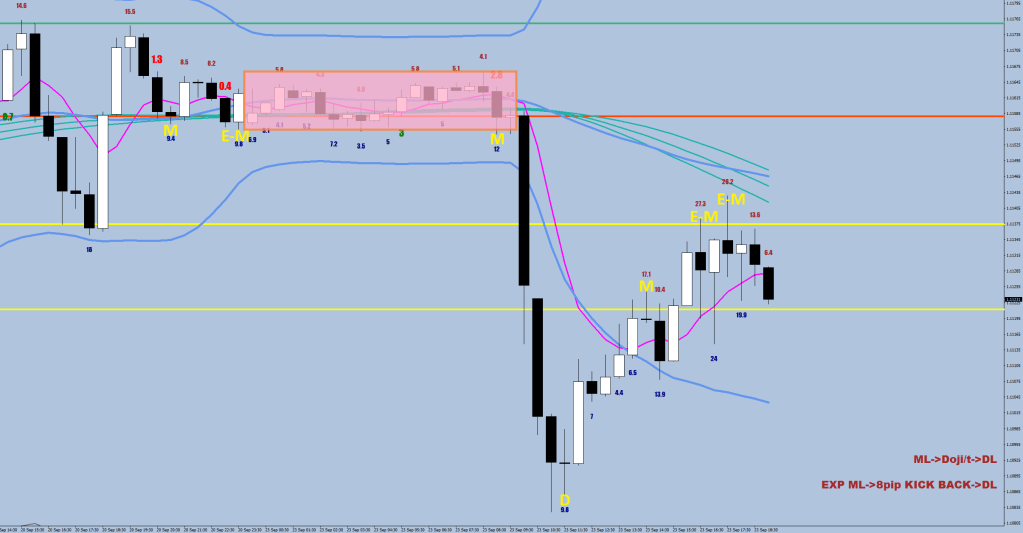
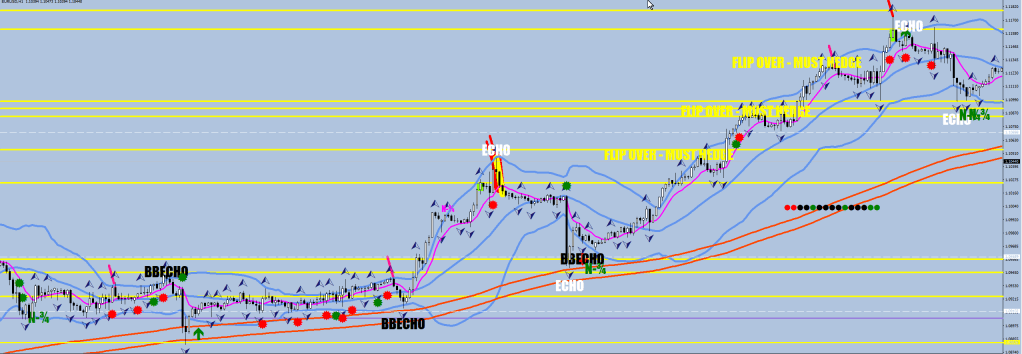
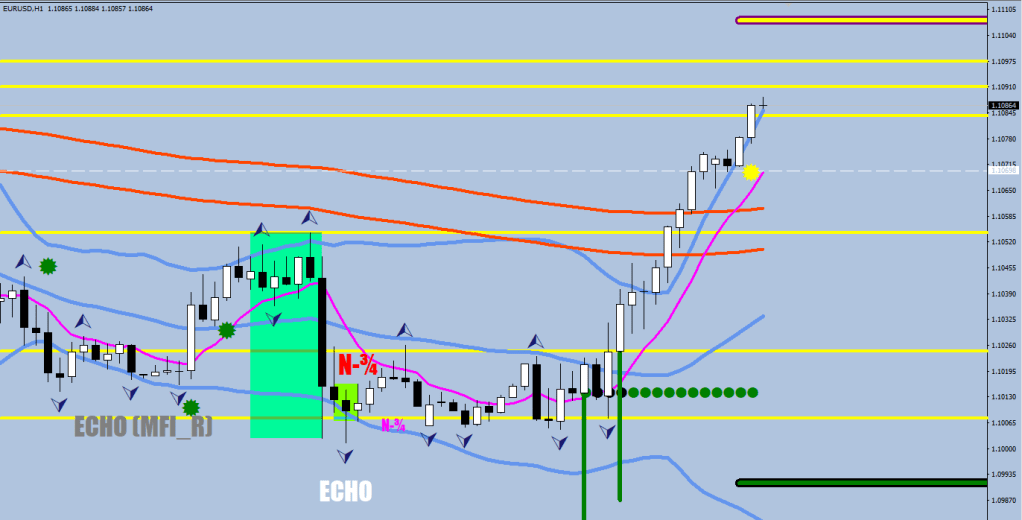
It is highlighted by my pitstop dots here. The 3rd close below the 8 EMO gets a red dot and happens to be the end of the first leg of the V, then the counter move does the same thing on the other side with the 3rd hour’s green dot being the end of the V. Of course, there is a larger version of this in the daily chart. A true market clash, a calibration and possibly figuring the right volume/distance for the next compression act.
I currently only have a pimped-out Doji version here, sorry for that. The idea of 2 and 6 dojis back provides some context for plausible support/resistance starting where. Just comment out whatever you don’t want to be plotted.
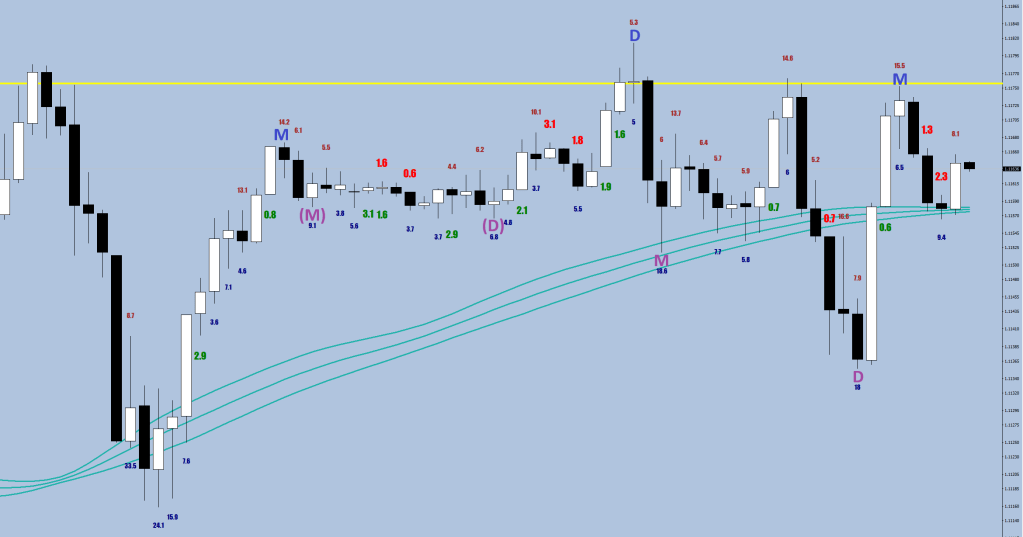
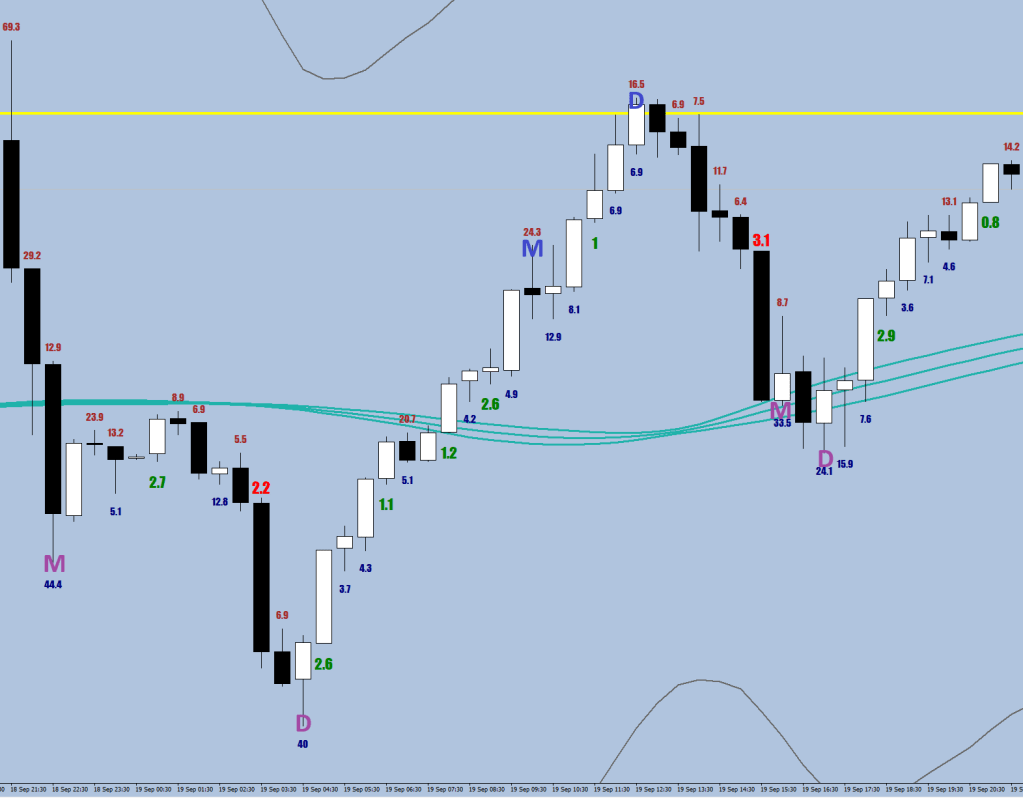
D = Divergent Leg (drop of directional volatility)
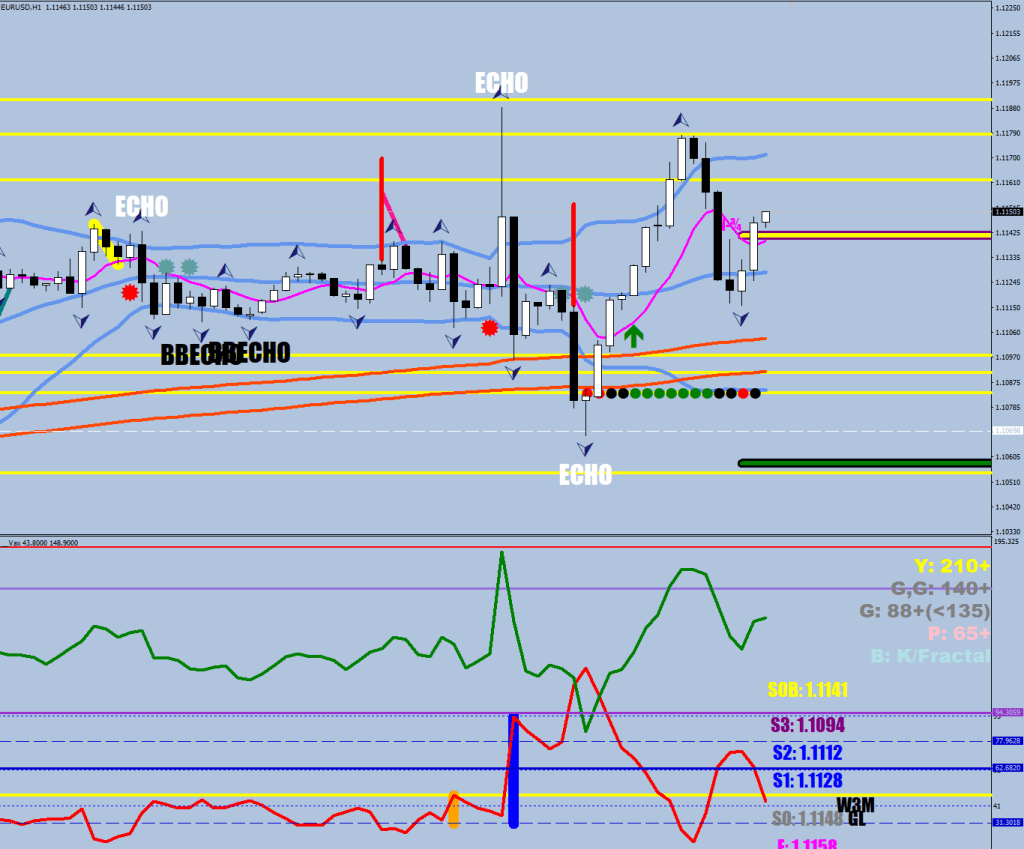
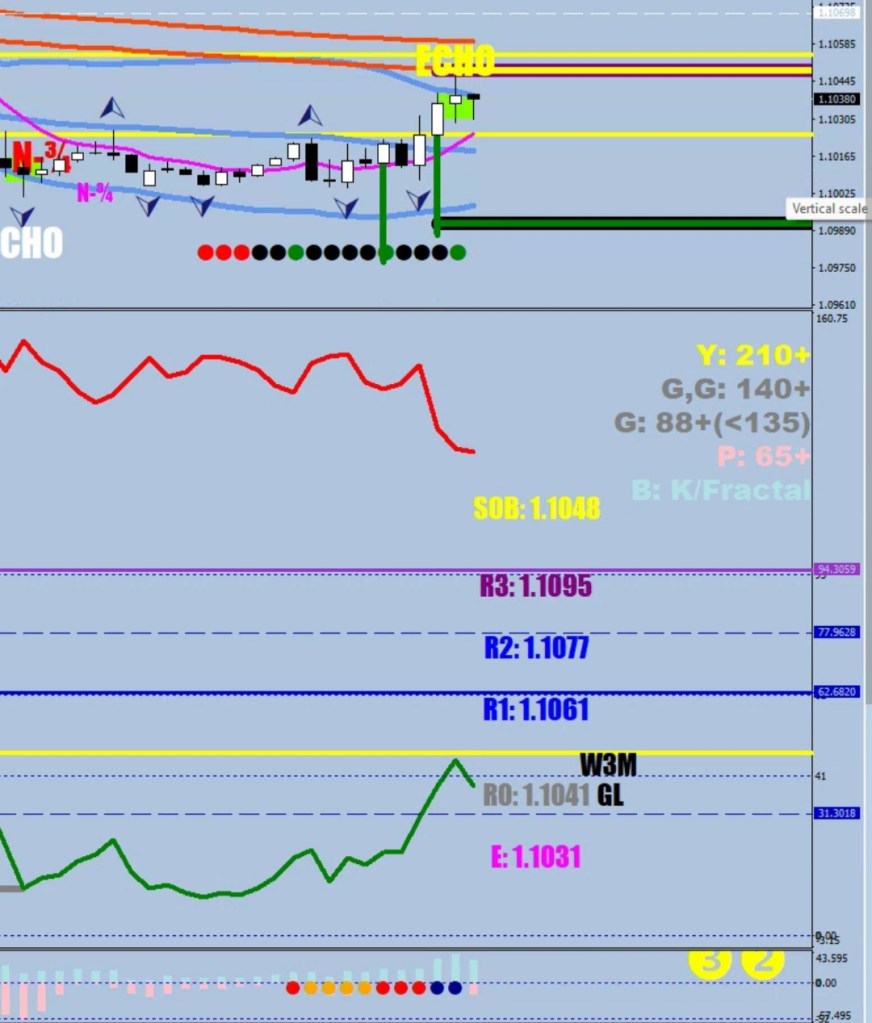
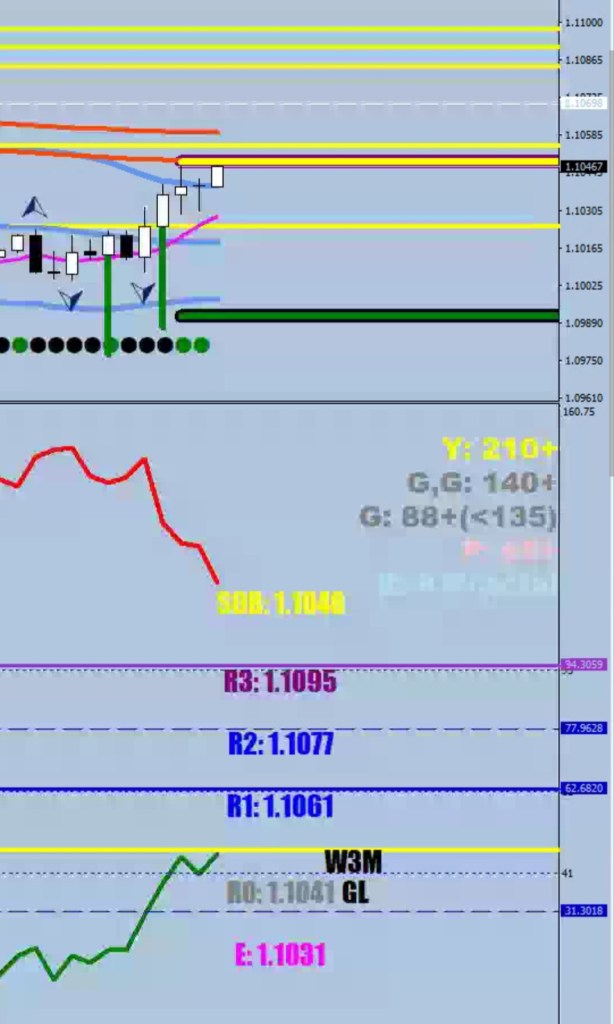
Next should be an M+D on the downside. Not certain that the price would be let beyond the SOB at 1.1141.
However, in the next leg up, the Red volatility line would be compressed below 14 (pips) and a further push higher would have to set up a Gray divergence for a peak. The brown bow is my idea of how the measuring leg would print.
…below 14 print, managed it on this very leg
After an E-M the expectation should be a W3M print. Why? Because if an E-M gets broken, you are likely in a Wave 3.
About halfway through these two numbers (W3Close and W3Far):
There was an extra high energy level reached allowing for an oversized move beyond W3D which was at 1.1088 at the time.
There was a kiss exchange between the red and green volatility lines, but overall the compression receiving side remains the downside (meaning the market is going higher).
Just like I never understand when people talk about a “structure”, I don’t ever understand when they refer to a “buy/sell setup”. Don’t even get me started on “generating money”.
I understand things when I can write binary filters for something.
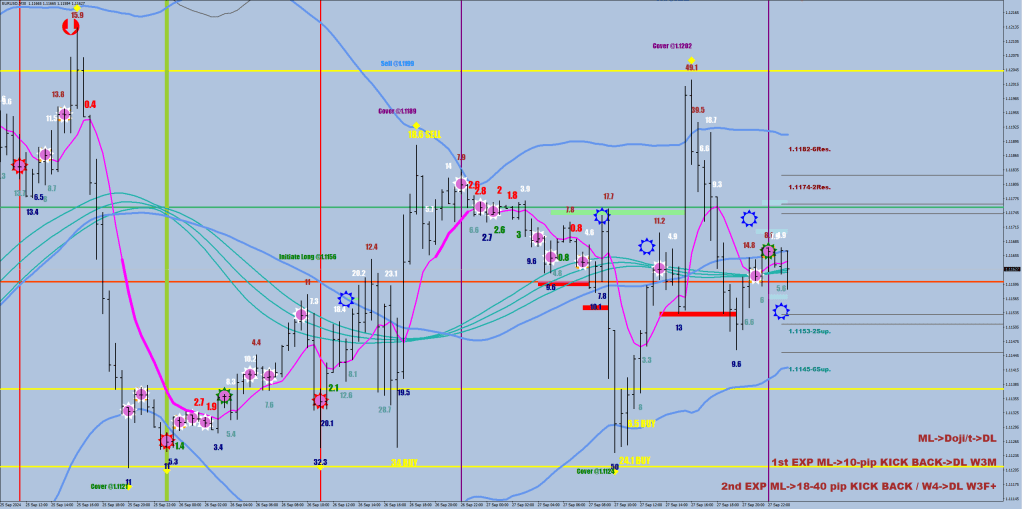
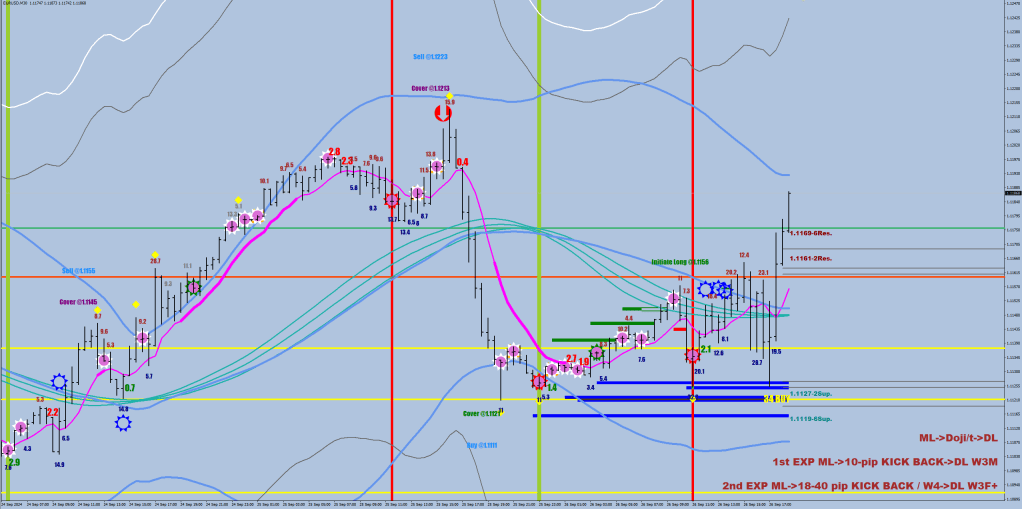
Yes, I would call an M & M-expansionary sequence a buy / sell setup but only because I have tangible proof for increasing directional volatility with an expectation of a break out with a kickback zone of typically 12 pips to accumulate in and add the remainder fancied size upon the violation of the E-M.
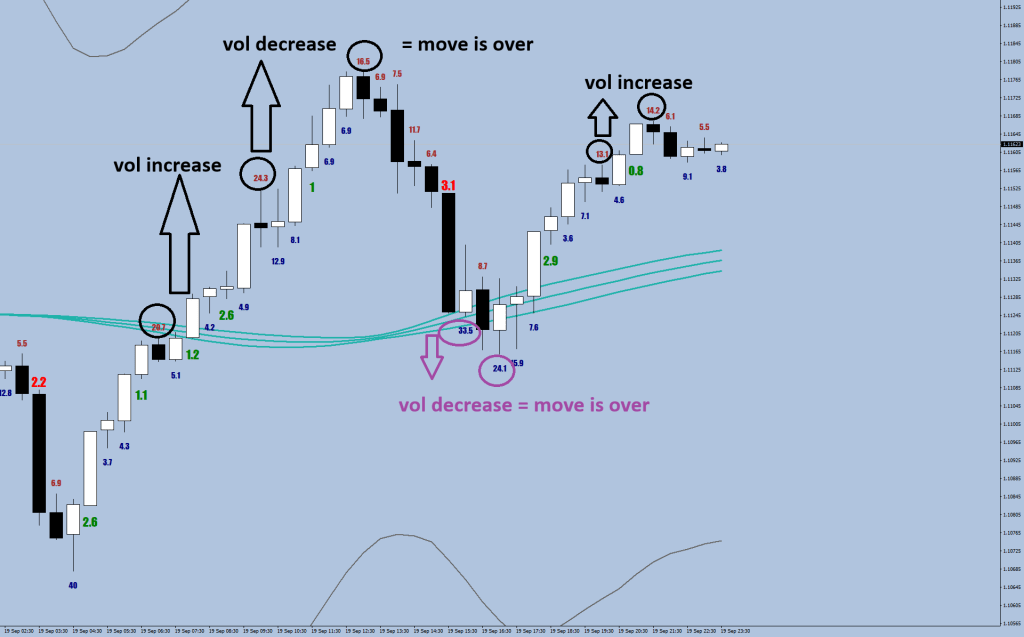
The directional volatility has to stop expanding for a wave to end. On the way up the pullbacks are greater than usual, but the directional volatility has not stopped expanding yet.
It is sheer luck to be born in this era when people are enabled by AI.
I made this entire album with all of its contents in 3 days. Not because I was rushed by anything, but I was in a creative enough mode to make 16 new tracks.
The Measuring leg is where the directional volatility peaks, the Divergent leg is the higher / lower close made with a diverging directional volatility peak.
The two sides work independently, so there may be overlaps.
Some people are talking 1.1380 already. We shall see. One step at a time. The current consolidation level would allow for 1.1250.
Now, how would I go about compressing counter-directional volatility, if I had to write a routine for it?
I cannot see the order flow, but here’s what I think.
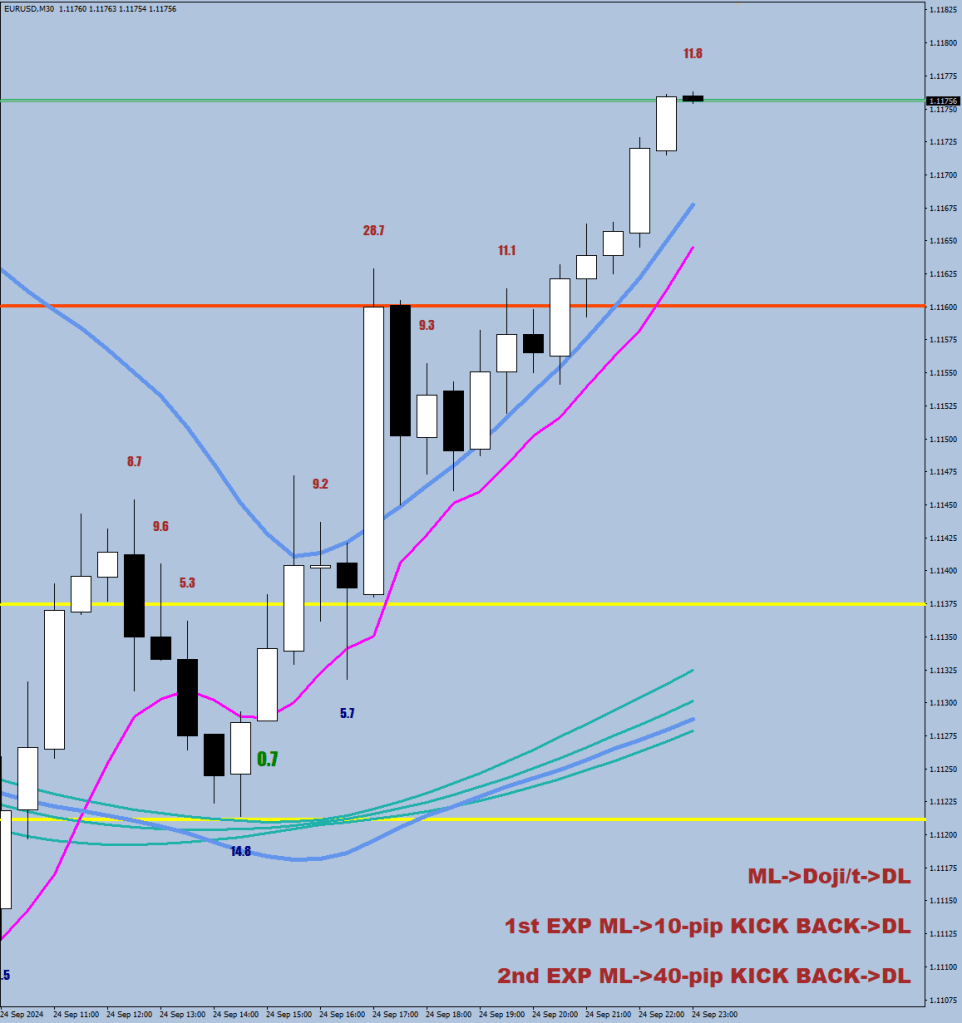
If they want the market to turn back up every time it has gone 10 pips away from the most recent 30-minute high, I would put out orders with some gap between and in increasing volume.
For instance, for 9 hours (18 candles) the program gets turned on, that says: buy X lots 6 pips out, buy 2x lots 8 pips out, buy 4x lots 10 pips out, and put out an 8x order 12 pips out.
Above the strongest 9-hour compression ever. 12.5 pips was the maximum counter-directional move.
Of course, you cannot do this indefinitely and you must dump your collection onto a larger order area. Say where someone got trapped and has their stop at break-even or where they have trailed their stop loss to.
Now, the flip side of volatility compression, is that when the market breaches, there will be no stopping in the other direction for some time. I.e. the correction went to an RSI2 below 5 reading.
Album #25 as promised.
deletetxt1("Citera");
if (Period()==30){
for (i=lookback; i>=0; i--){
       if (Open[i]<Close[i] || Open[i+1]<Open[i+1]) {

         ObjectCreate("Citera"+IntegerToString(i), OBJ_TEXT, 0, Time[i], Low[i]-20*Point);
         ObjectSetText("Citera"+IntegerToString(i), NormalizeDouble((iHigh(symbol,0,iHighest(symbol,0,MODE_HIGH,2,i+1))-Low[i])*10000,2), 11, "Impact", Navy);
       }
}
}
When the matket has not failed the upside yet, buy the bang!
The bang is an unbroken hourly RSI2 move from overbought to oversold or the other way. The high/low to sell/buy would be pointed out by the sharp end. The bang would be confirmed by a fractal on the next candle (or second). The bang has to be of the directional color or a bodiless doji.
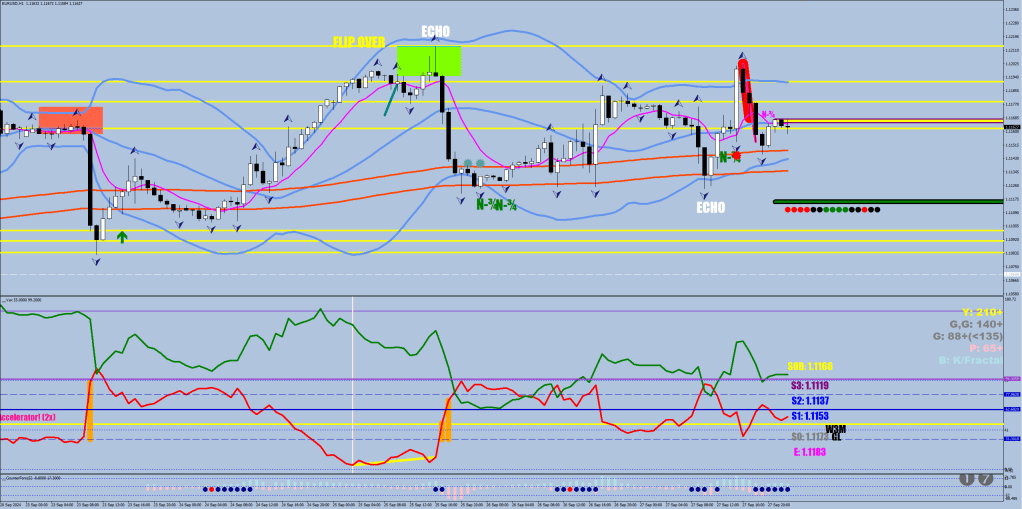
3 bang examples since the last Echo print on the downside.
RSI2 is placed over median. The draw downs would have been below 5 pips, and pyramiding would work too.
Remember where volatility compressors have been active. They are fading a Wave 3 20-pips out.
Go oversized in the current direction.
The difference between the last effort red and yellow highlight is that the red returns in 1 hour to the 8 EMO (not enough separation) whilst the yellow goes the optimal 2 route.
Playing ping-pong between the two highest swing highs.
After the End Of Wave 5 (green double divergence), there was an impulse Wave 1 up (red double divergence).
I would prefer Wave 2 to reach beyond the Municipal trench (orange bands).
1.1050 (S.O.B.) should receive a back test.
How high? Ultimately 1.12889 should receive a beat.
The base case is 5 waves up.
The twist?
A push-down first. The only clue here is the Pro volume reversal print on Friday. I almost missed this.
The money flow was severely oversold at the close. The next professional stronghold is the 1.0945-1.0936 zone which could receive a backtest. For this path to play out, an Echo would need to be printed on the upside, which would mean a 2.5 to 3-hour rally. Motoring up (and making a higher high) would be a clue. Going down to the lower 30 sample hourly BB would mean a fresh wave (Wave 3) up.
[Verse 1]
Quarks, gluons and somersaults
Juggling with your twin
Coitus collaboritis
Spooky pension in the distance

Double slit while the pants slit
Hard hat and potato nose
A picture of Neutrino
When he was still tiny

[Chorus]
There is no compensation
For some intermittent condensation
Life is  perpendicular I'm afraid
In a Bozo-Eintstein Condensate

[Verse 2]
Winning the dancing
And the pissing competition
With entangled shoe laces
Tickle-tickle particle
Partake in the para-normal
ESP is taking charge

[Chorus]
There is no compensation
For some intermittent condensation
Life is  perpendicular I'm afraid
In a Bozo-Eintstein Condensate

[Verse 3]
Being poor comes standard
Being funny does not come easy

The hardest life is the clown's
They have to give away with all values
Until they are left with nothing
They are right with nothing

I you have a sixth sense for nonsense
Hand it: the small things
Have nought to do with the big picture

[Chorus]
There is no compensation
For some intermittent condensation
Life is  perpendicular I'm afraid
In a Bozo-Eintstein Condensate
In trading, you never have any use for a why. You just need to notice when it happens and act accordingly.
How does it happen?
There are two factors, duration and location.
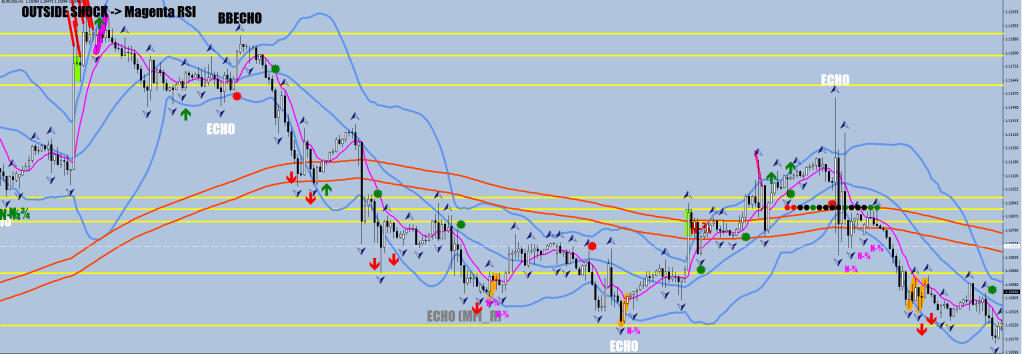
As for duration, the great majority of these runs is 2-3 hours in length. The zone to fail is typically a 21-pip range where the third candle should print a high/low and retrace more than 1/3rd of the current hour’s action. The zone itself is most often from inside the 30-sample HL2 hourly BB by two pips to outside by 19.
The failure high/low is often final but allows for a fake out for up to 10 pips. This displacement I call the moratorium zone. I don’t have any examples where the market managed to walk into the zone by more than 7 pips before reversing for good.
You would likely find that the first hour spent at least a little time on the other side of the hourly 8 EMO.
Confirmation
An ECHO is still pending upon the 3rd hour’s failure. The 4th hour closing towards the 8 EMO is the first confirmation. The second confirmation is not taking out the high/low made by the 3rd candle in hour 5. At this point, confidence is in. Further confirmation would be starting to print closes on the other side of the 8 EMO.
The one disqualifier (muter) I have is if the 30 sample BB width is less than a fluctuation size or 32 pips. In this case, I gray out the Echo print.
The Black or BB echo is a version where the 8 EMO is out of reach. This move also starts from inside the BB, the failure zone is the same as well, but it requires a print outside the BB right before the Echo count starts in exchange for no 8 EMO.
I also implemented an early “heads up” marker with the same system of Yellow for pending and Green or Red for some directional confirmation, but one hour earlier. The rugged edge circles I’m talking about. Some of these never turn into an ECHO.
I did invent the Push and Echo coupling for the Weekly chart. Over there a Push is defined by a move outside the 14-sample Window Envelope with a week-on-week progress being at least 50% more and the time limit for an echo is 2 Weeks (2 more candles), but can happen in 1.
As you can see, the hourly Echo definition is different, it can happen almost anywhere and does not represent more than a turn. It is not necessarily a major swing you are looking at, but a failed auction nevertheless. A trade that would be on until a Black or White Echo prints in the opposite direction.
There are very simple mechanics at play.
Here the market is trying to fail…
…but it does not get confirmed in the first following hour.
Now an Echo is out of the question, but a BB Echo is a possibility 2-3 hours from now or it would have to reconnect with the 8 EMO first and start a new count.
Album #24 up to listen
…potential BB Echo, will know in 3 more hours for sure. The current candle would have to close down 1/3, the next candle would have to be red and the candle afterward would not be allowed to take the high by the settlement.