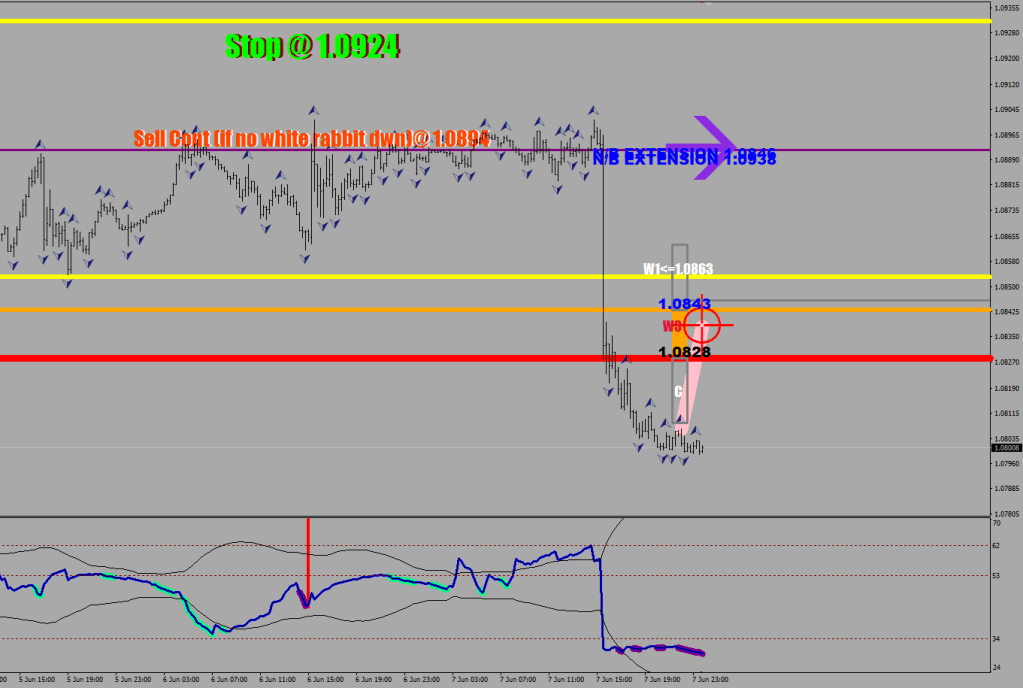
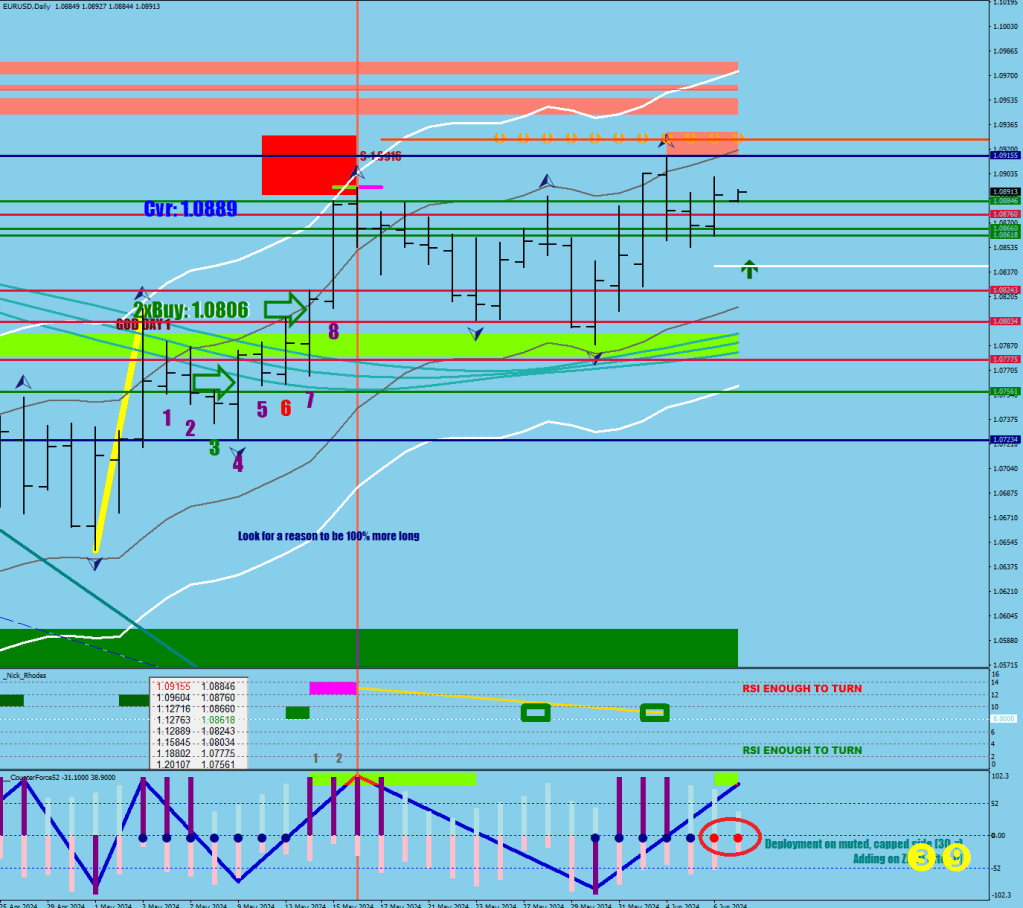
I missed the top because I made a dangerous leap in my thinking from a thesis to secrecy.

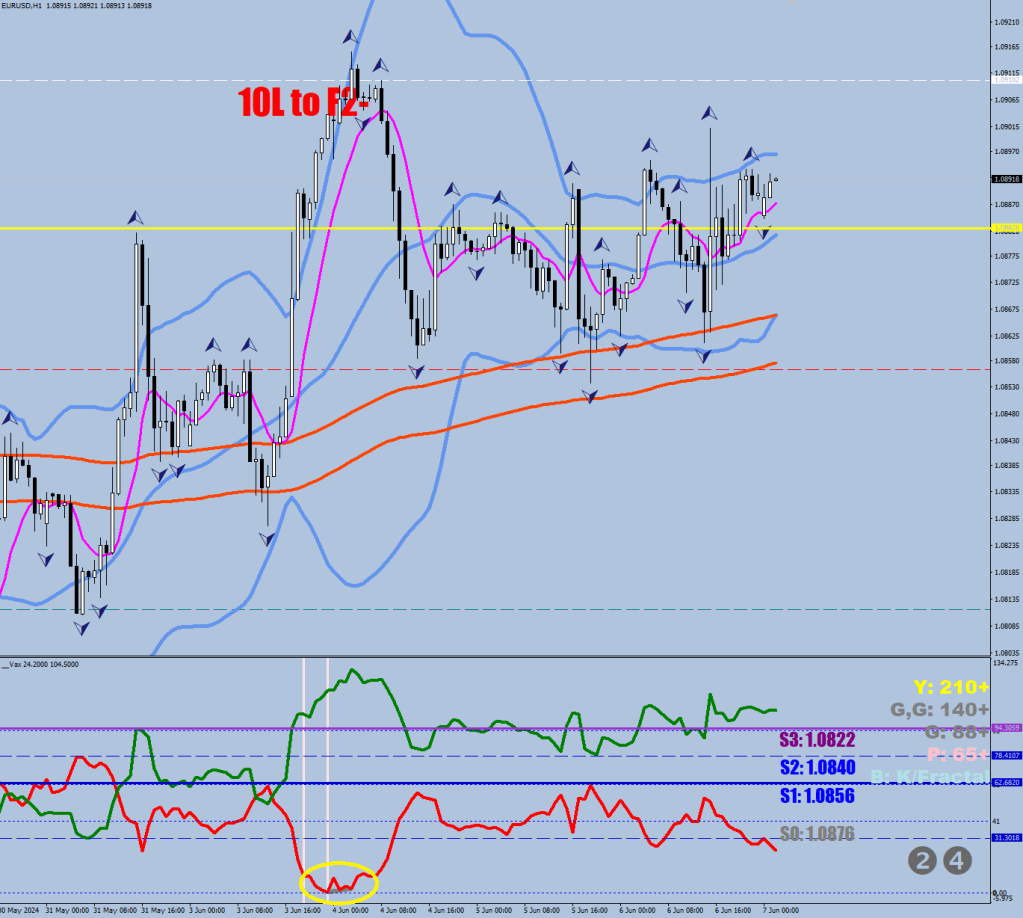
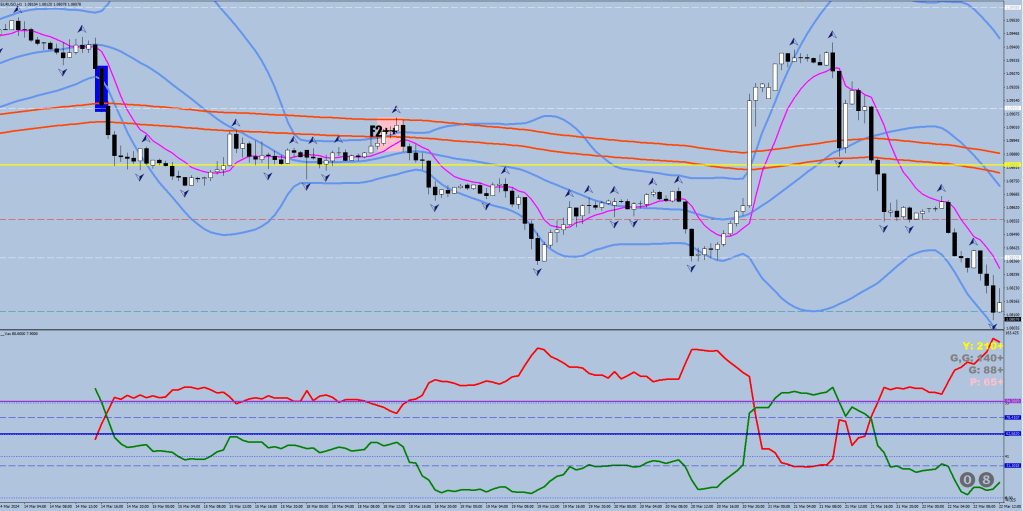
I accepted a Yellow divergence as a must, and there was only a Gray one.
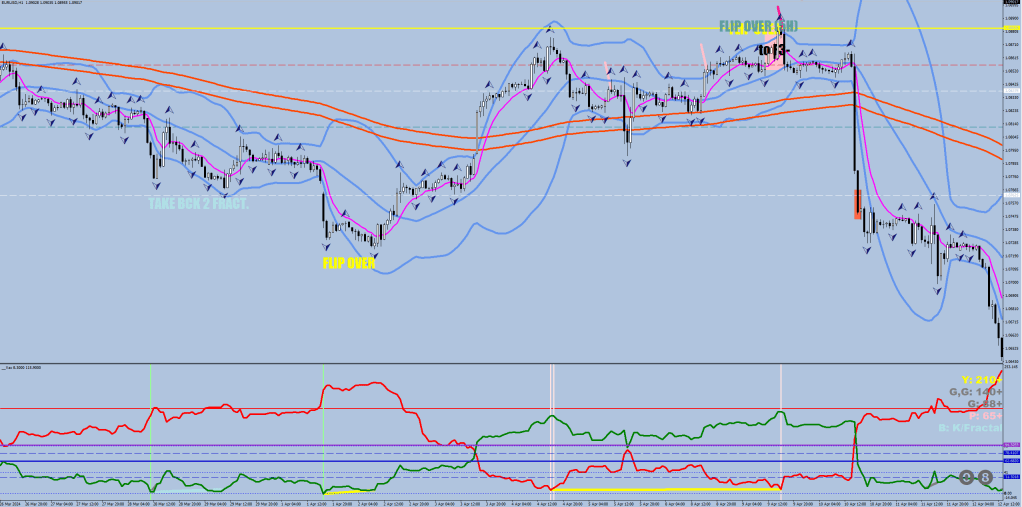
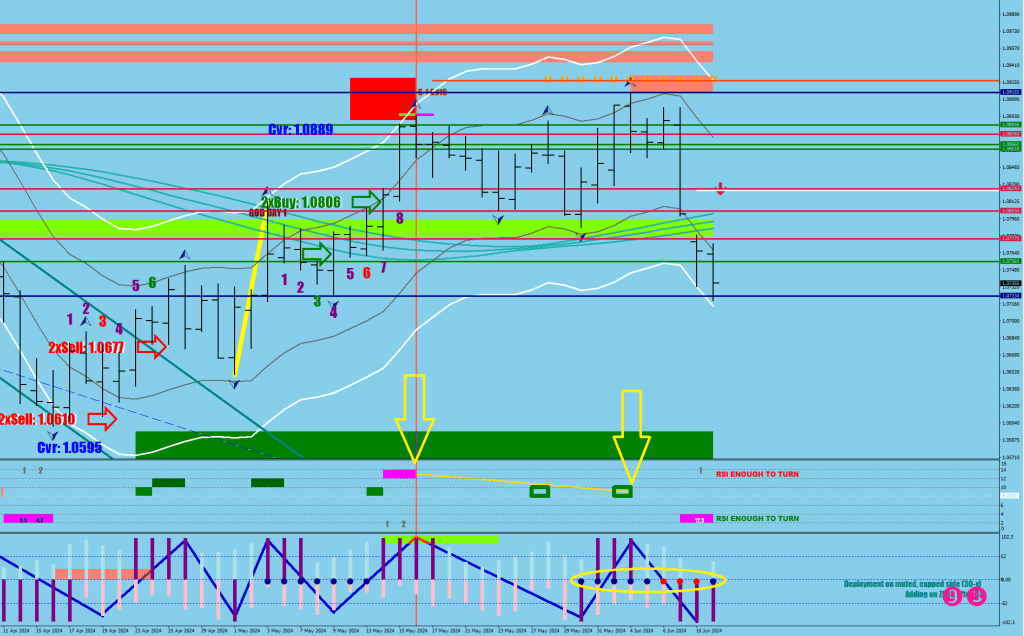
A volatility divergence can only be yellow if the next hourly candle after the divergence ending fractal print manages to close back inside the hourly 8 EMO (magenta).
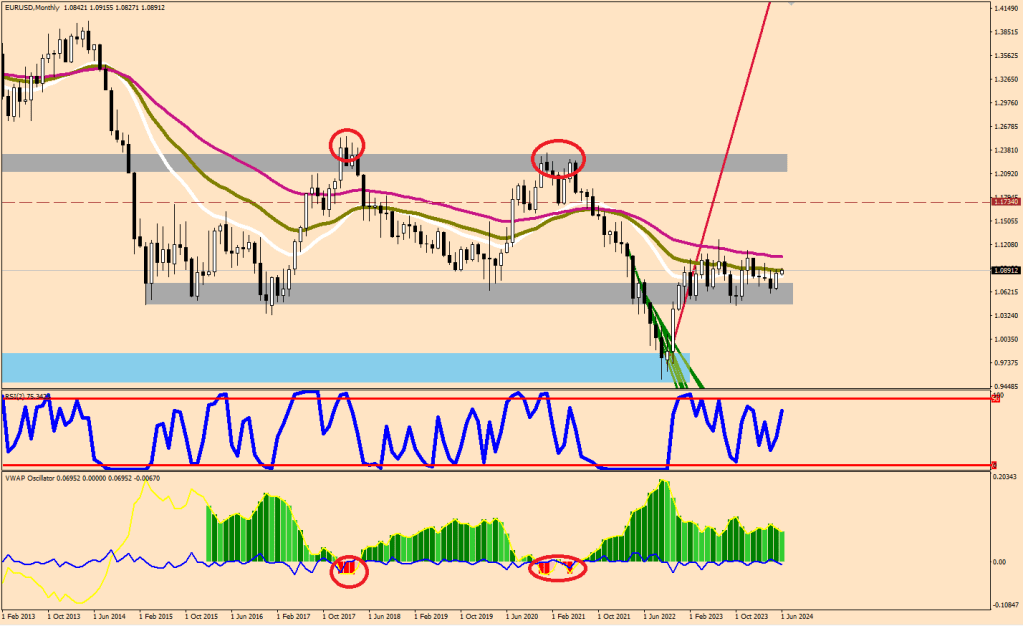
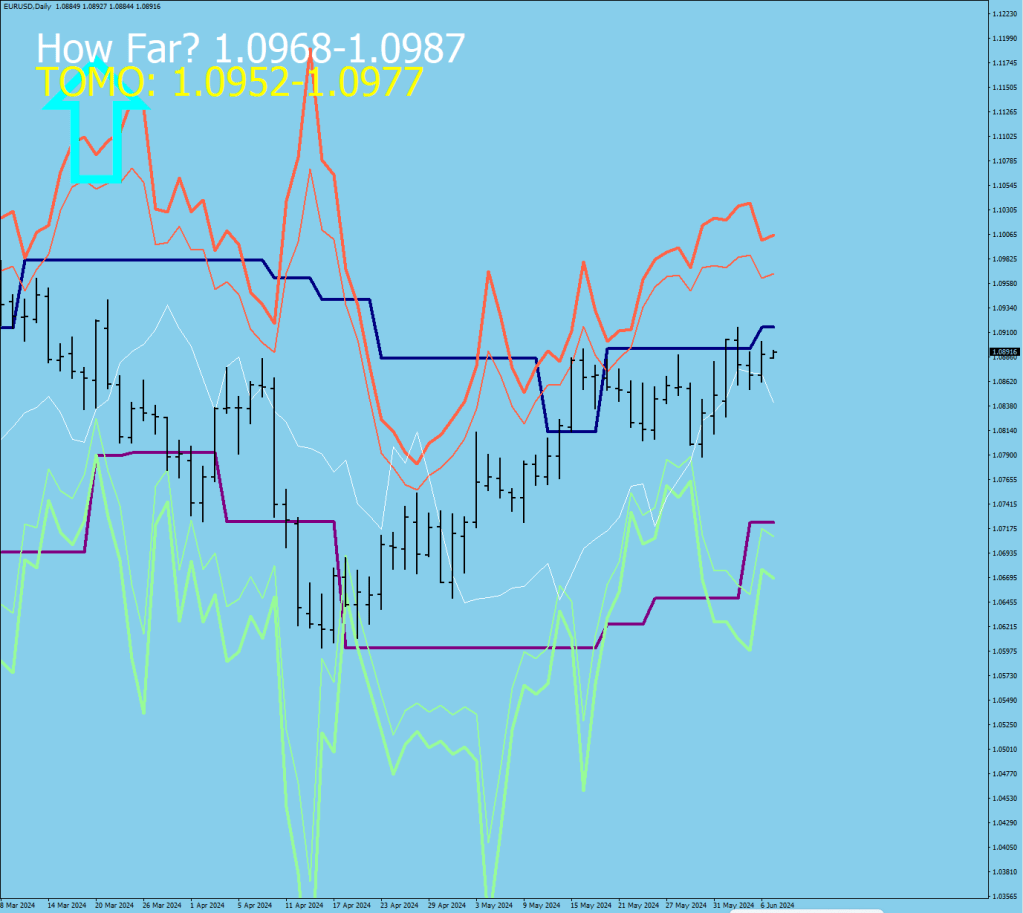
On the other hand, there was a yellow divergence (RSI2) on the daily chart.
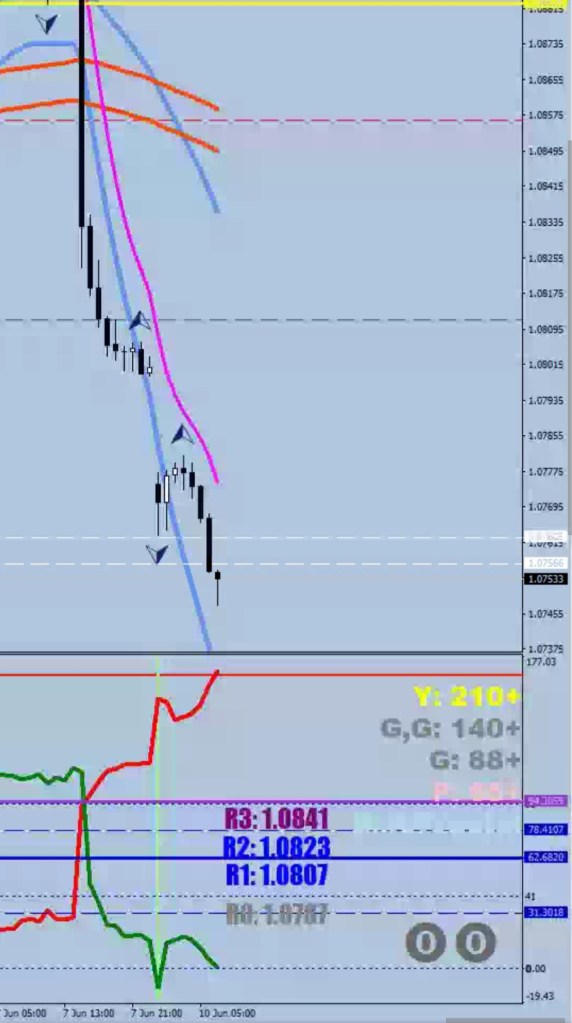
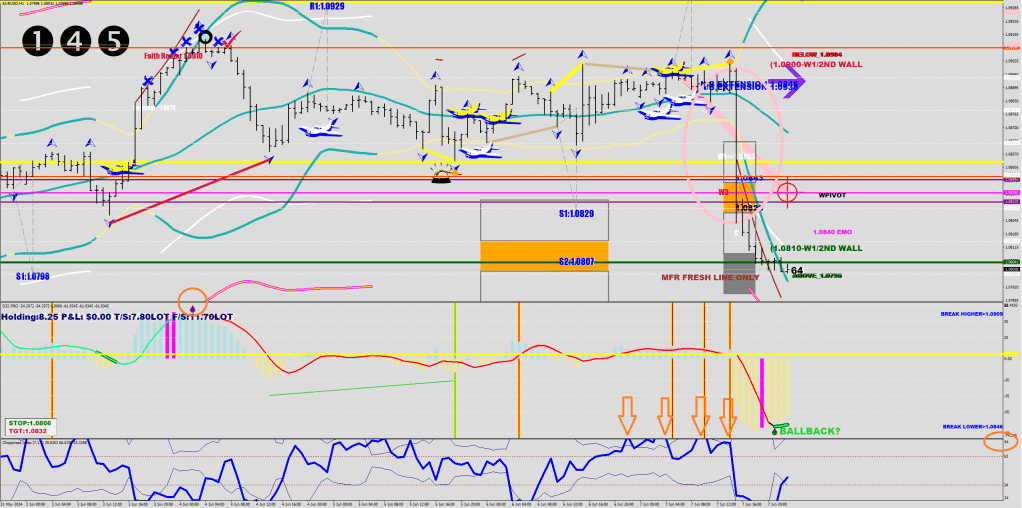
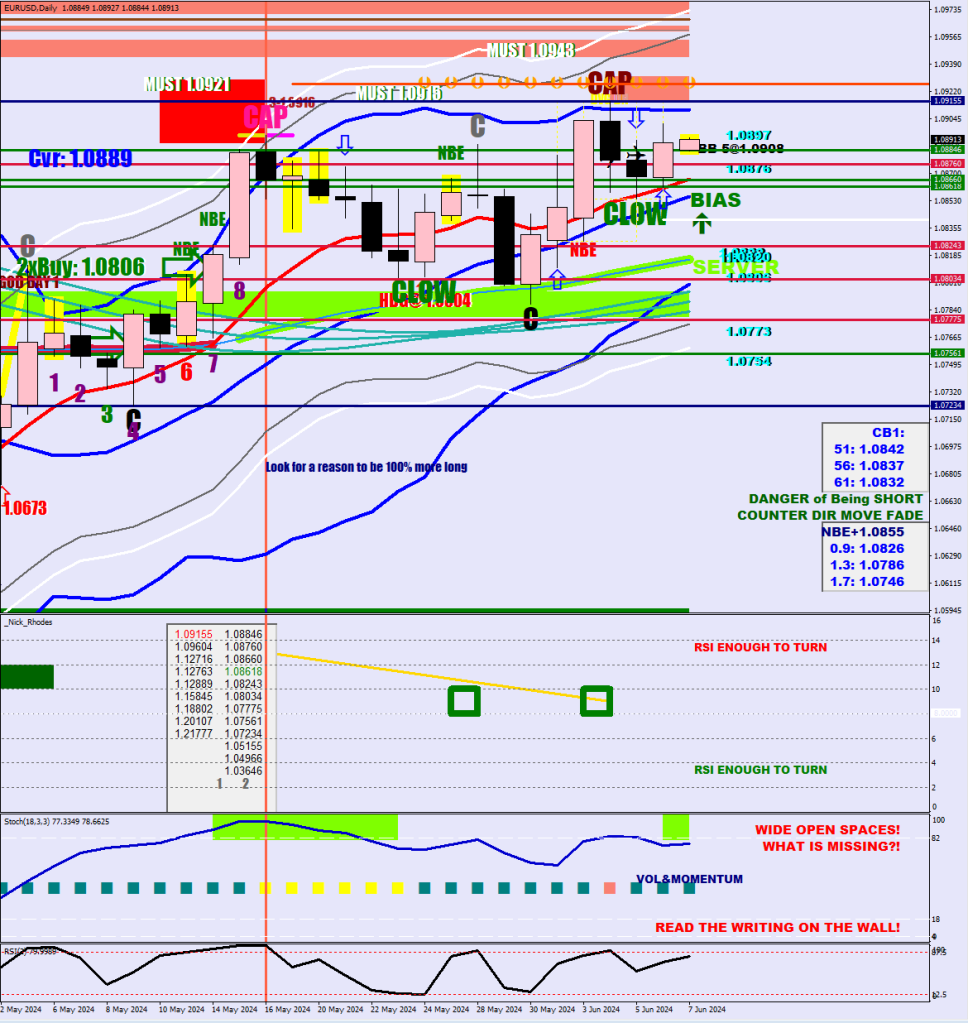
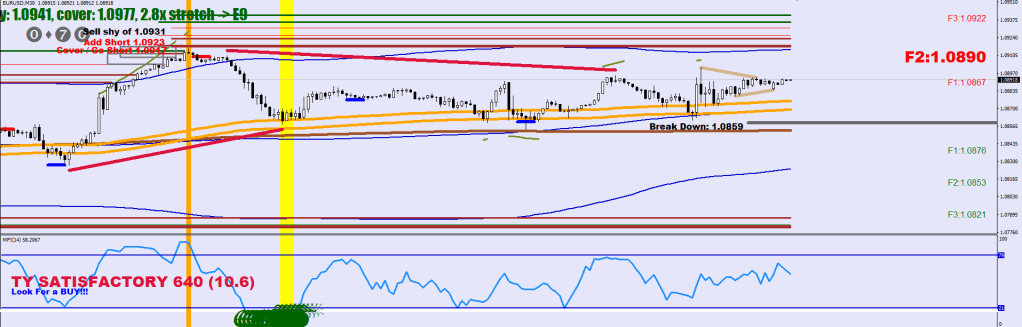
Another thesis confused for a fact was that a top would not print during a Daily Squeeze. Well, it printed and 196 pips lower the squeeze is still on. A third one was that embedding is necessary for finding Ammo. There was an intraday embedding print, but the big break canceled it.

Since the Red volatility line went beyond the 200-sample 166-pips marker, the Blue divergence was only able to reclaim 1 fractal, not 2 as it would have been able to below 166 pips.
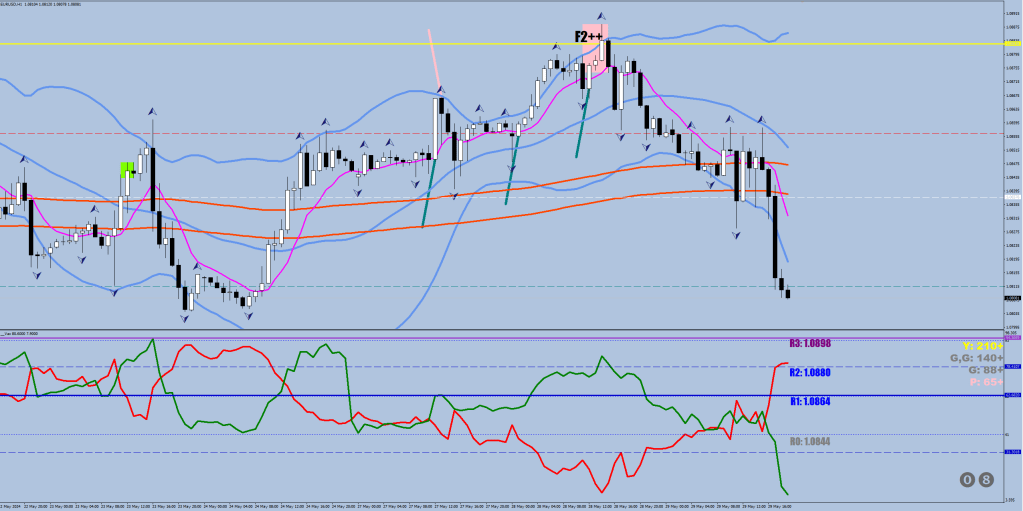
ObjectCreate("Frogg"+IntegerToString(i),OBJ_TEXT, 0, Time[i+8],Low[i]-40*Point);
      ObjectSetText("Frogg"+IntegerToString(i),"TAKE BCK 2 FRACT.(5H)", 26, "Impact", clrCadetBlue);
      if (ExtATRBuffer[i]>166) ObjectSetText("Frogg"+IntegerToString(i),"TAKE BCK 1 FRACT.(5H)", 26, "Impact", clrCadetBlue);
On the downside when the Green volatility is getting compressed/whacked, the default divergence color is Blue, and it can become Pink (Early Divergence) if the Green Volatility divergence’s endpoint exceeds 41 pips
if (ExtATRBuffer2[i]>41) ObjectSet("Frog"+IntegerToString(i),OBJPROP_COLOR,clrPink);
Yellow would be the Green Volatility line has been sustainably below 41 for 24 hours with the whilst the Red volatility line has gone above 41 at the Green Volatility divergence's endpoint
if (ExtATRBuffer2[ArrayMaximum(ExtATRBuffer2,14,i+10)]<41) {
ObjectSet("Frog"+IntegerToString(i),OBJPROP_COLOR,clrYellow);
if (ExtATRBuffer[i]>41 && Close[i-1]>iMA(symbol,0,8,0,MODE_EMA,PRICE_OPEN,i-1)) {
ObjectCreate("Frogg"+IntegerToString(i),OBJ_TEXT, 0, Time[i+8],Low[i]-40*Point);
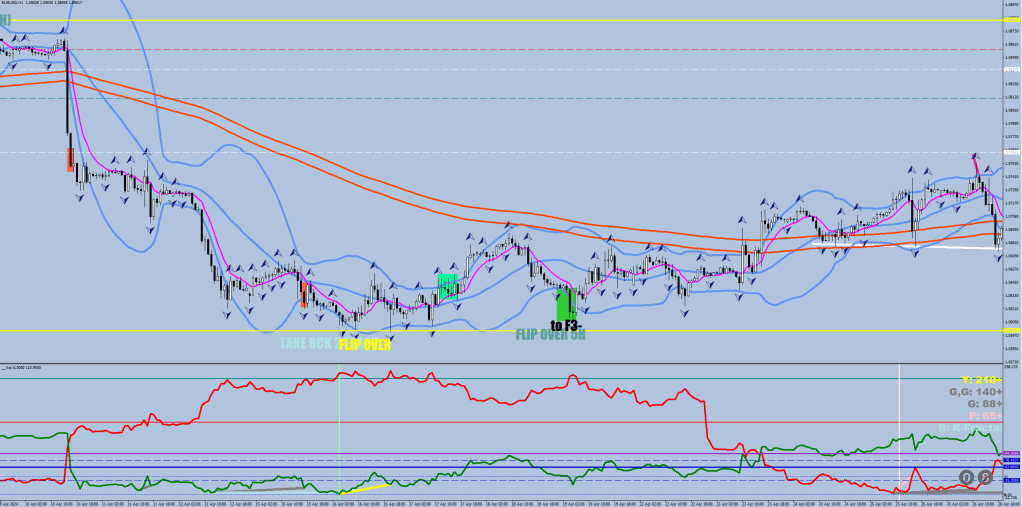
ObjectSetText("Frogg"+IntegerToString(i),"FLIP OVER", 26, "Impact", clrYellow);}
Gray override would occur when the next hourly candle after Green Volatility divergence's endpoint was unable to close back above the 8EMO if (Close[i-1]<iMA(symbol,0,8,0,MODE_EMA,PRICE_OPEN,i-1)){
ObjectSet("Frog"+IntegerToString(i),OBJPROP_COLOR,clrGray); Further filter conditions as follows:
if (iFractals(symbol,0,MODE_LOWER,i) && iLow(symbol,0,iLowest(symbol,0,MODE_LOW,160,i))==iLow(symbol,0,i)
&& ExtATRBuffer2[ArrayMinimum(ExtATRBuffer2,160,i+1)]<10
&& ExtATRBuffer2[ArrayMinimum(ExtATRBuffer2,160,i+1)]<ExtATRBuffer2[i]
&& ExtATRBuffer2[i]<41
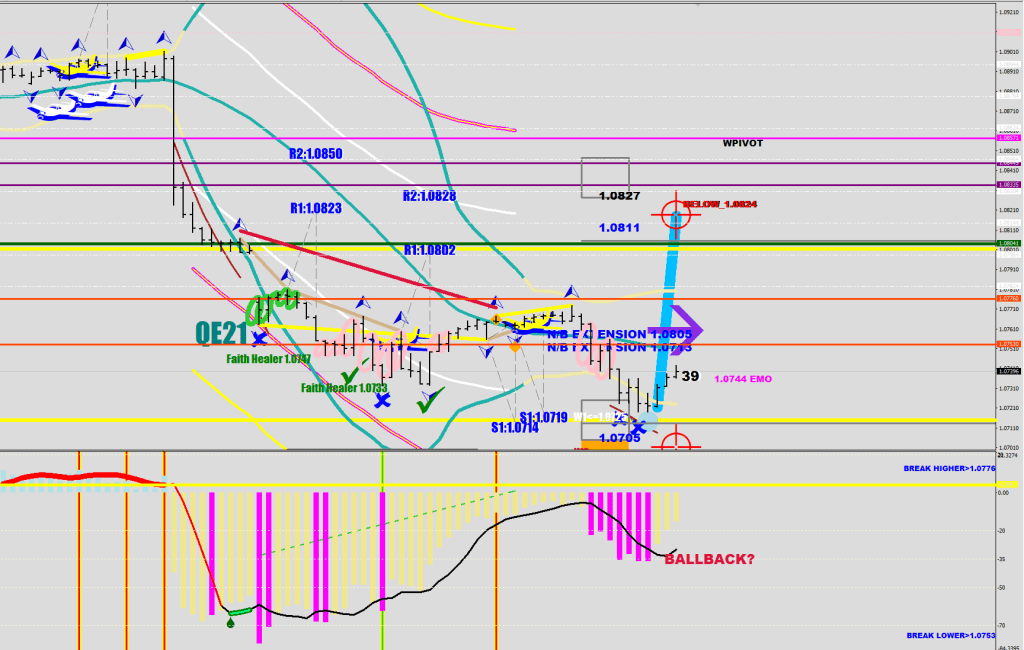
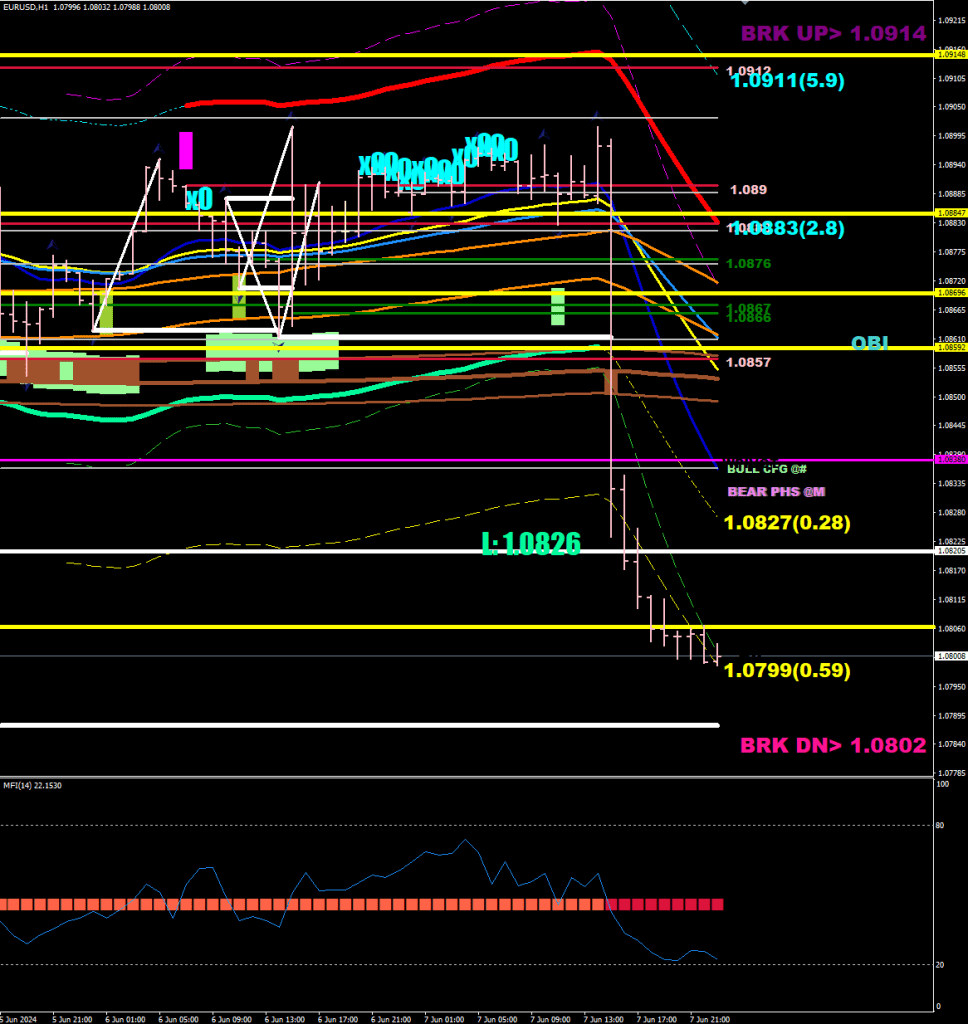
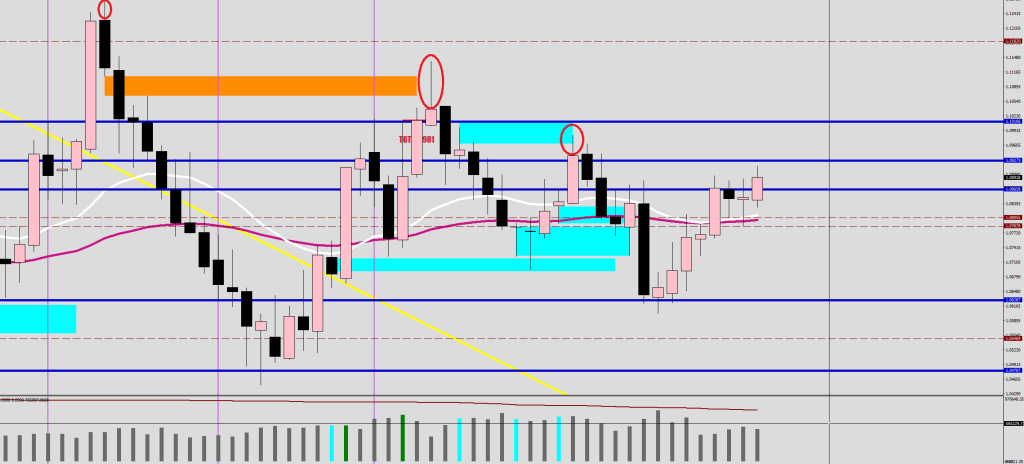
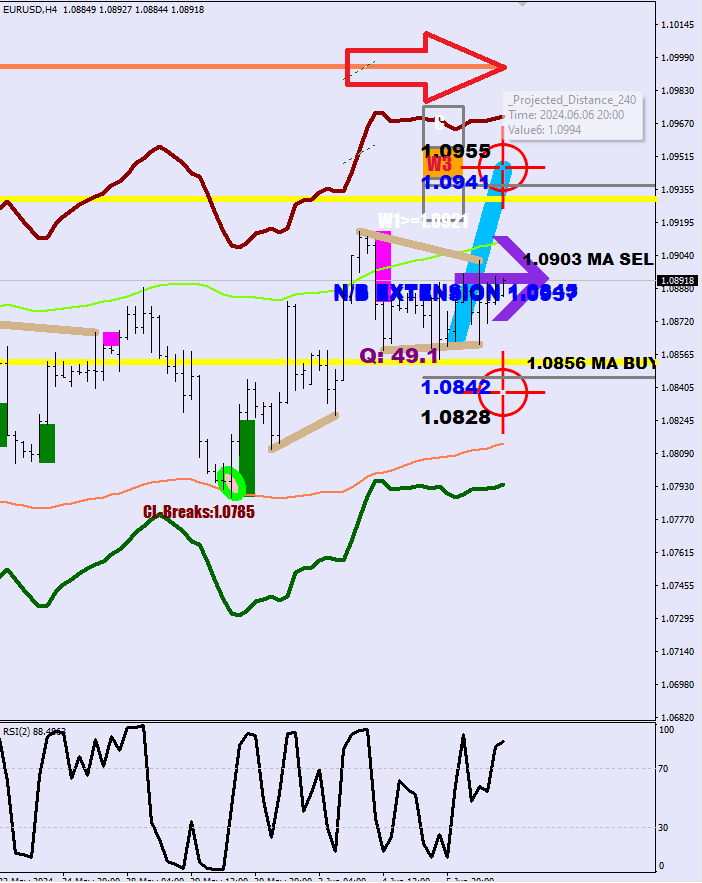
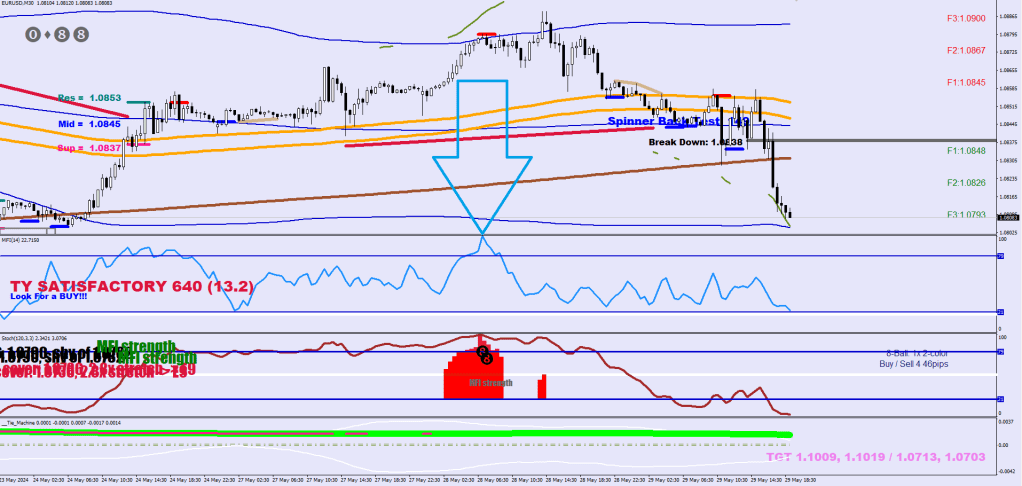
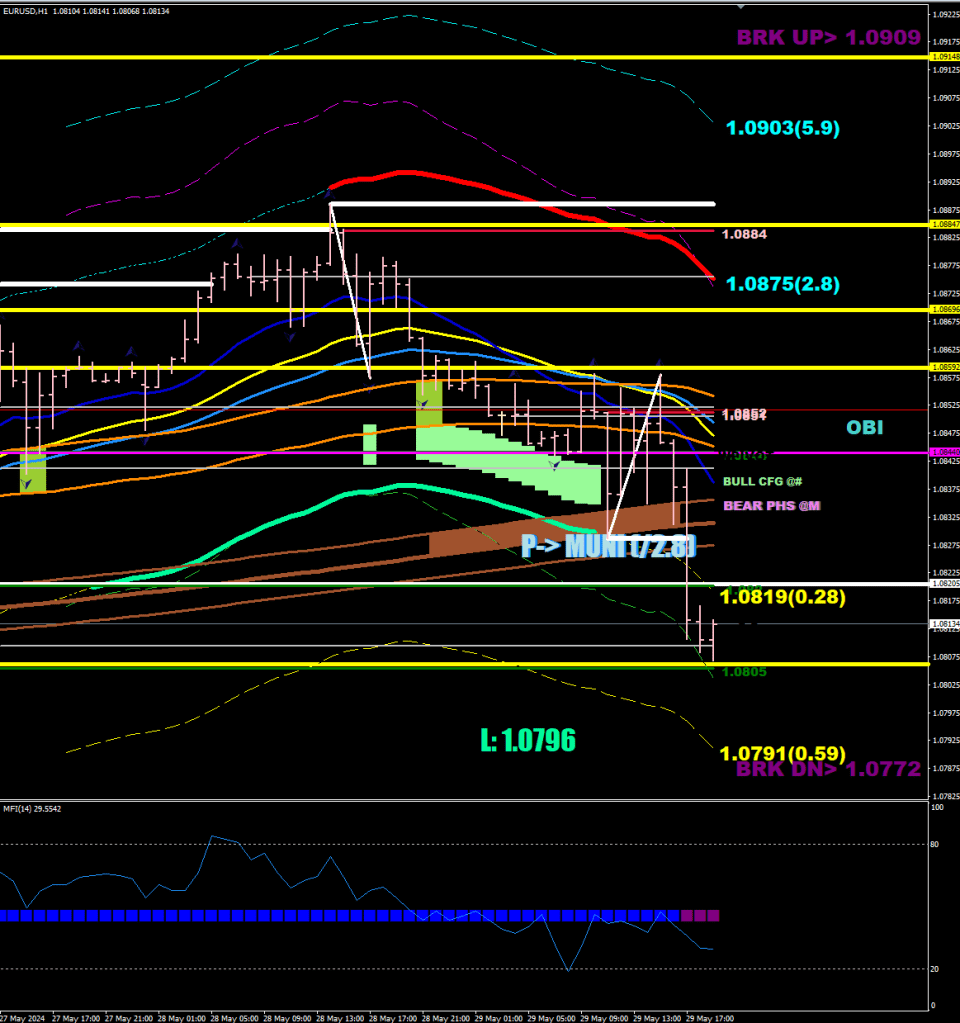
&& ExtATRBuffer[ArrayMaximum(ExtATRBuffer,70,i+10)]<ExtATRBuffer[i]What does a Gray divergence mean? A counter move excess of 88 pips. This would put the price back above 1.0808 briefly. A low would be in, but not THE LOW. The 4-H empty powder box speaks of the same thing. To be a shaded box, the bumper line has to be exceeded (at 1.05 currently).
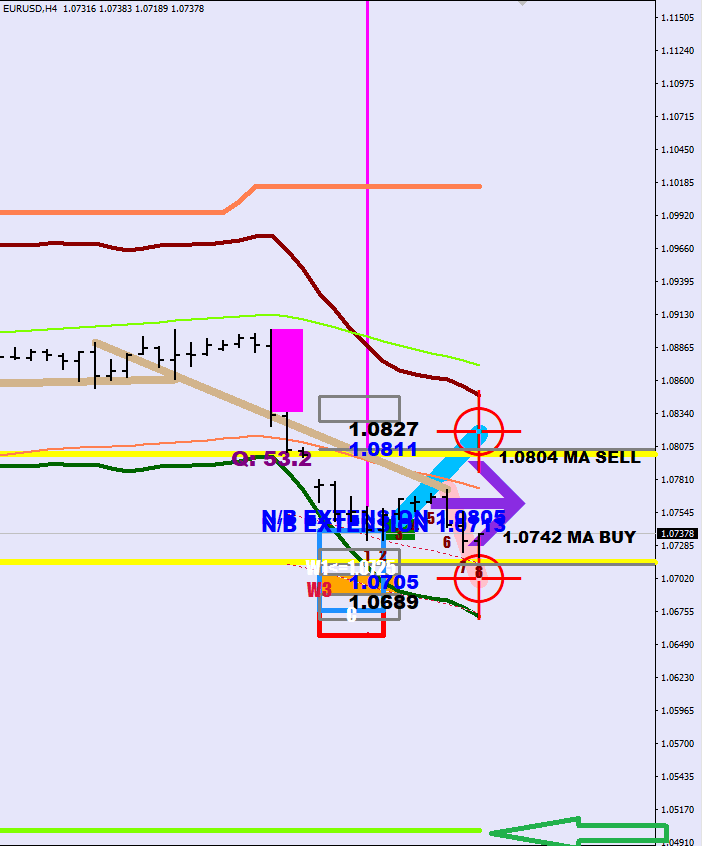
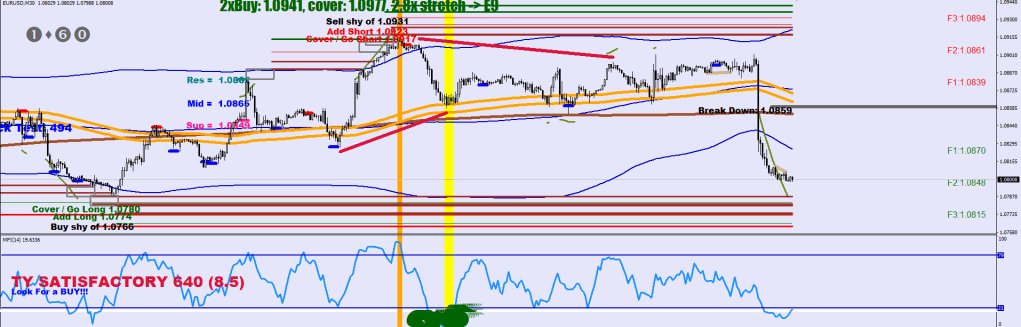
1.0804 is the approximate Wave 2 sell level currently (which happens to be the gapfill).
The Tie Machine’s Yellow box so far is the real deal.

Album #9 – another milestone in AI music making