Yes, transfusion. The liquidity break is about capturing new orders and then milking them feeding the progression further, making it last.
I’m saying this because since the last setup which was a slow bow back, the leg up had the characteristics of a fresh blood/liquidity break.
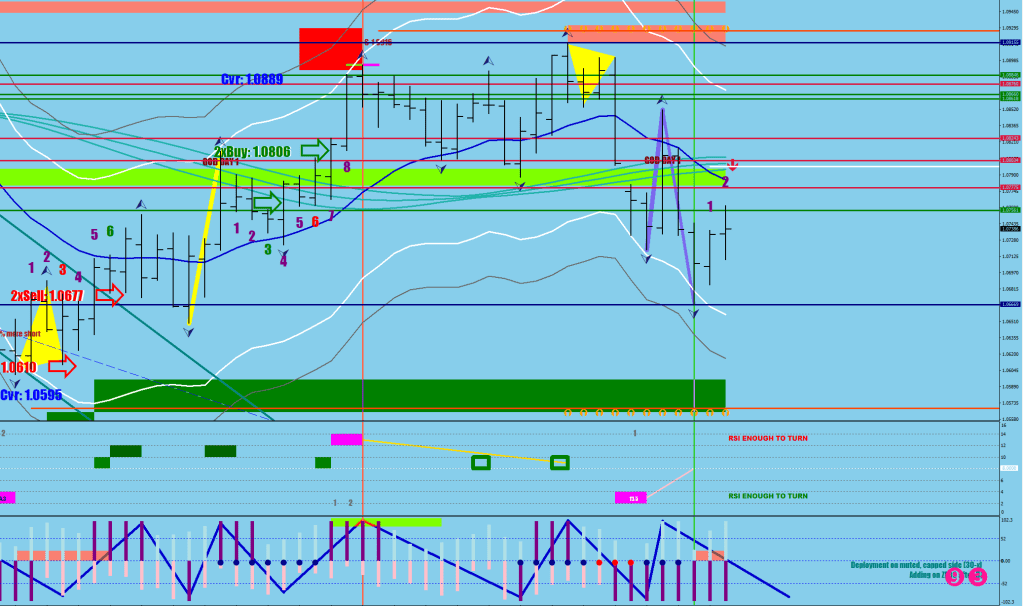
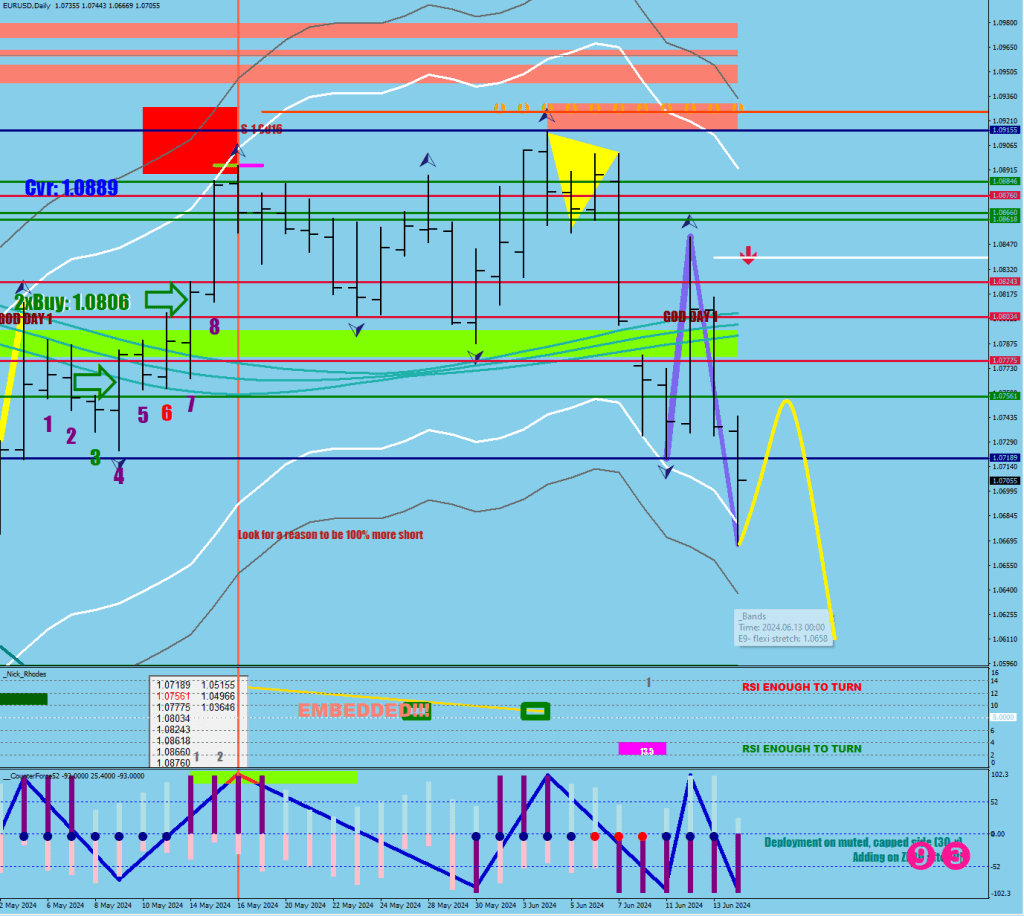
I do not currently have an example of a move like that not crossing above the daily 16 EMA, but I tend to think this is an ominous sign. Day 5 has touched down into the target box, but the overall lift was pitiful, which leads me to believe that a new measuring leg is going to be printed next
There is absolutely no sign of a bottom here, the orange shading is a continuation sell highlight.
We have to first make a new volatility compression anchor and then talk about the divergence part.
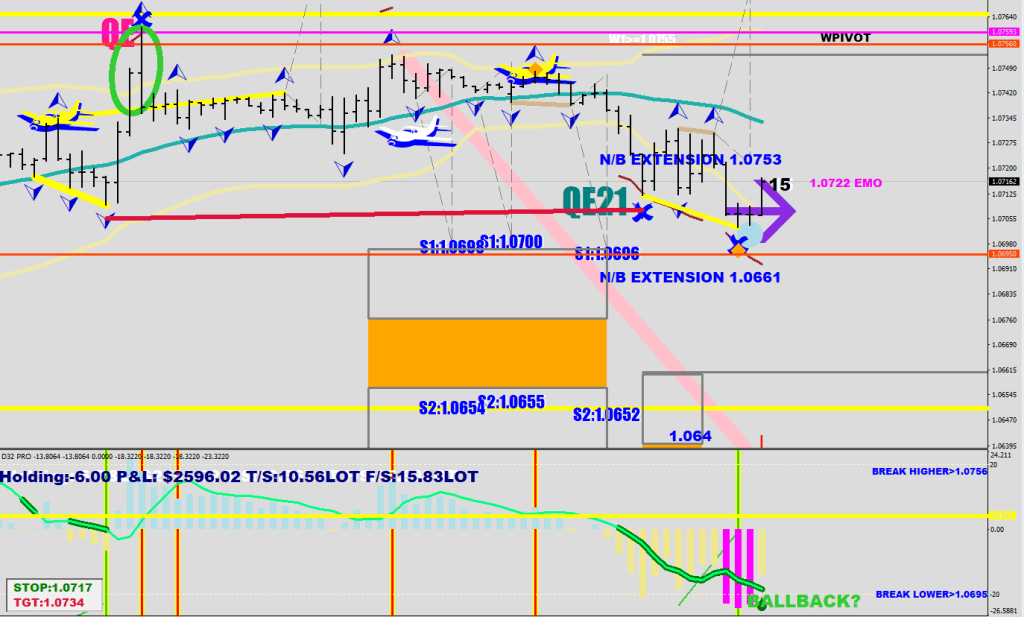
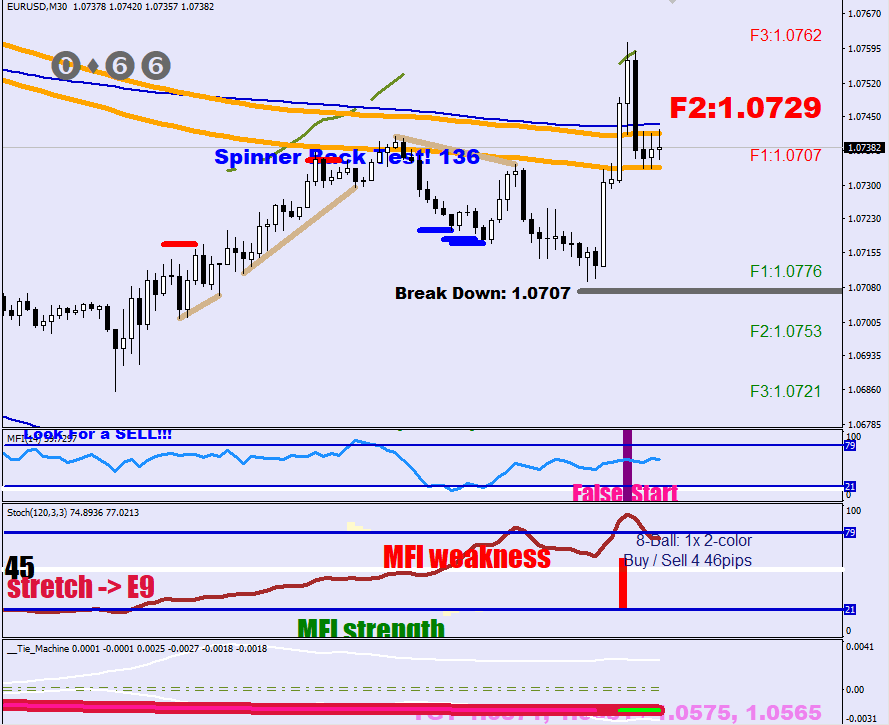
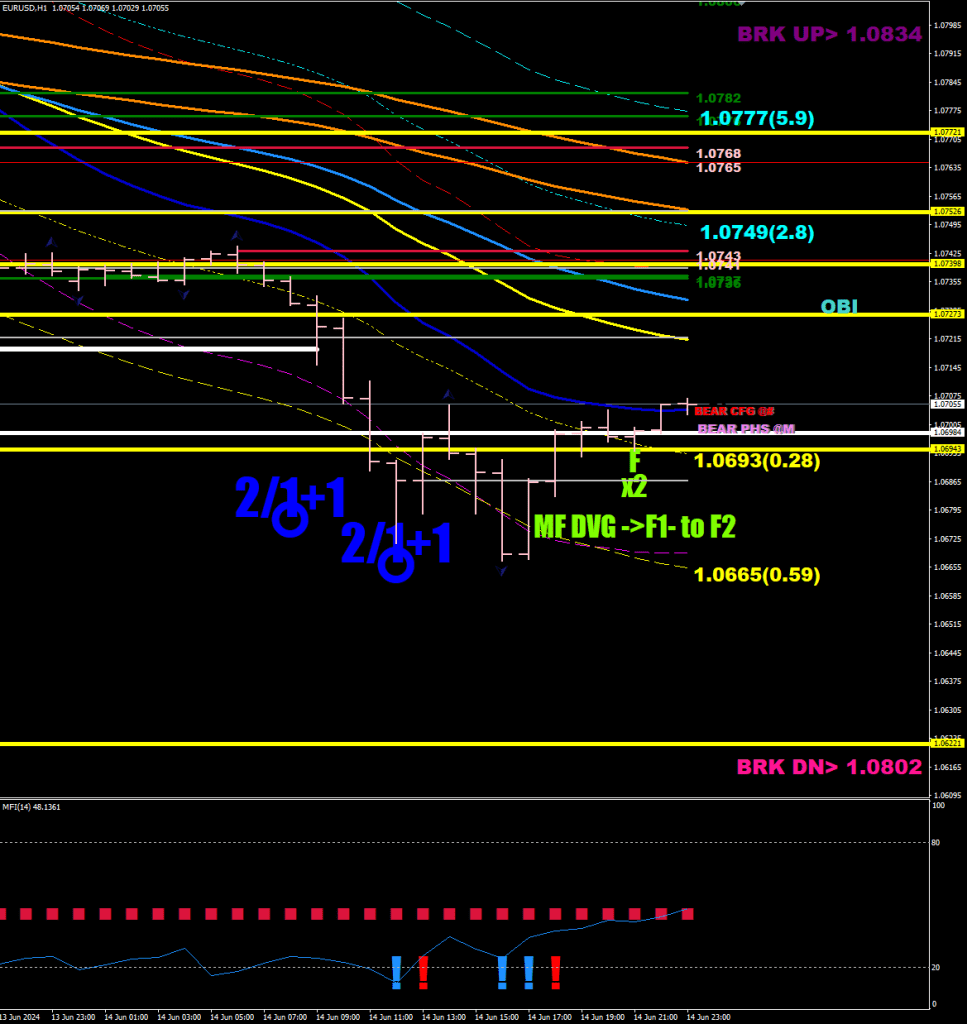
The spinner is not a money flow reversal zone but could be the start of a short term counter move by first going outside in the direction of progression and then starting to make 30-min closes back beyond the Mid point. I am utilizing this current move to scale back into a short, meaning I have a sell 1lot at every single pip starting 1.0711.
Secondly, the level. The Green box has printed with the low of the 3rd day.
The white line is 2.8x stretch from the mean (E-9) and is pointing around the 1.0650 level. The leg that pierced the white line earlier is considered the Measuring leg. The Divergent leg should achieve a similar, but a little less distance (optimally about 10% less) whilst printing a lower low.
The low at 1.0669 would have to be exceeded, period. The energy bands are expected to be starting at 1.0633 tomorrow.
S2 should receive a fake out and there were 3 different prints in the low 1.065x.
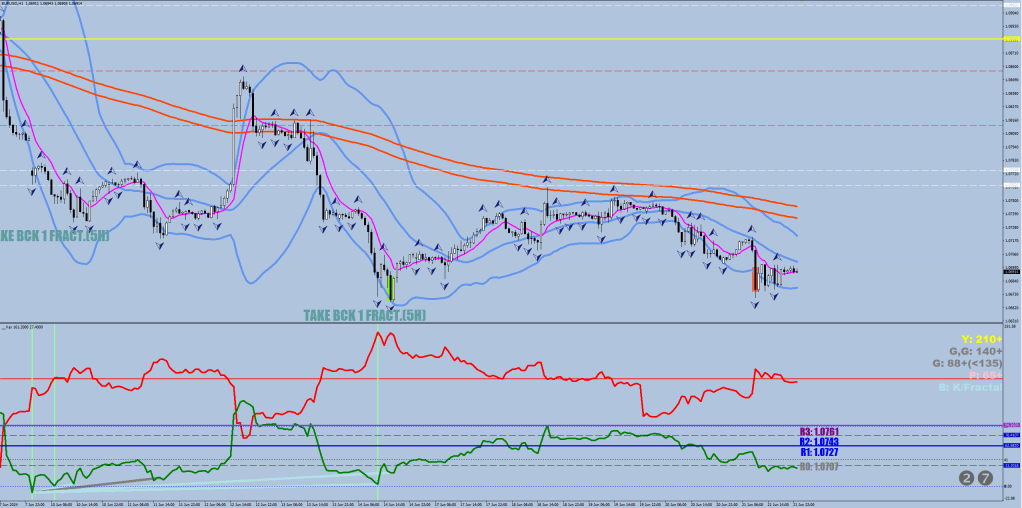
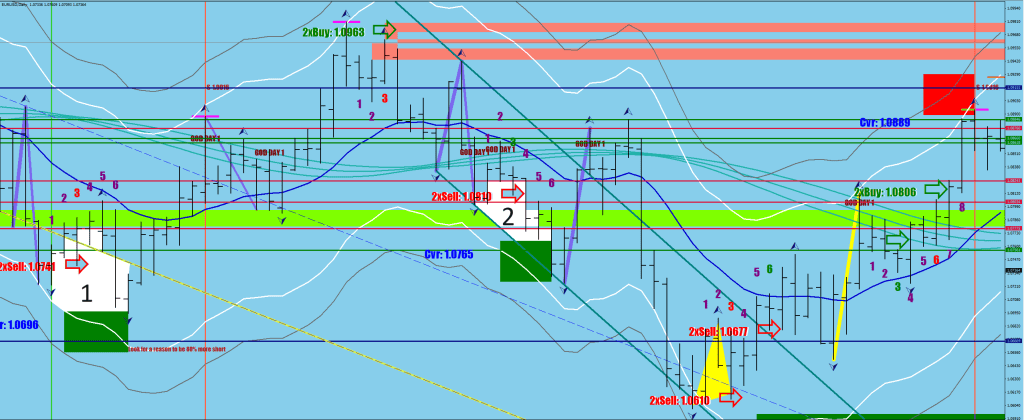
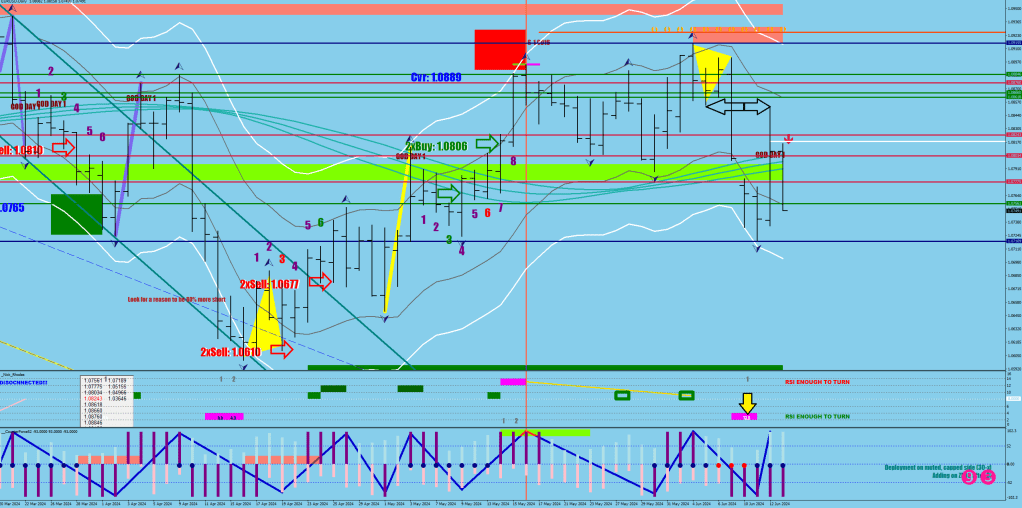
I like the 1.0640 level for now as it is also the bottom of the Green projection box – see the 2nd image.
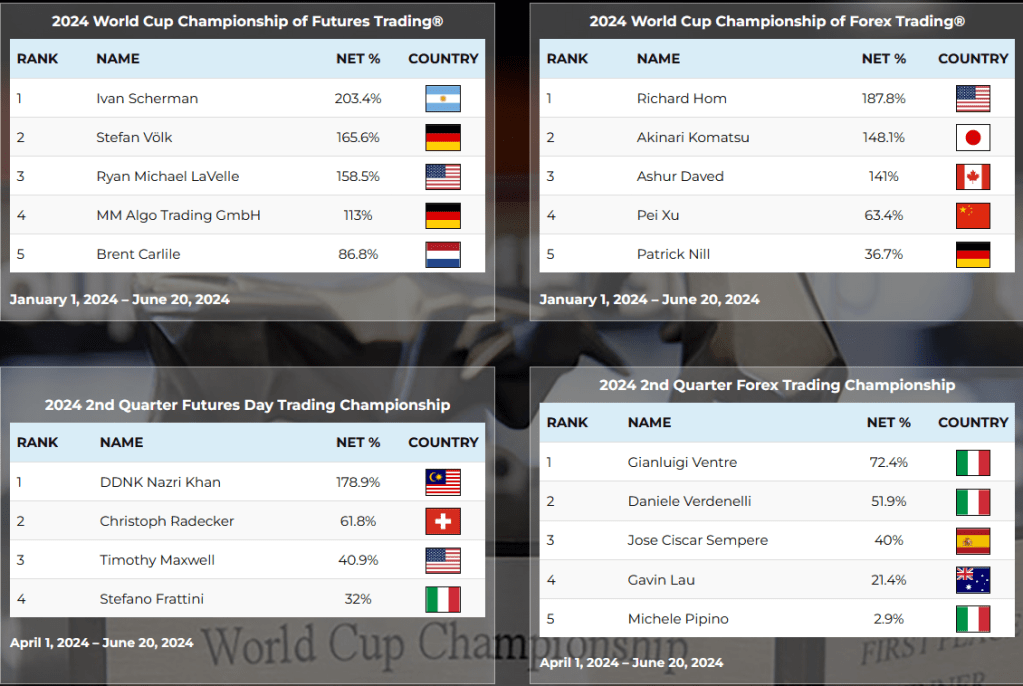
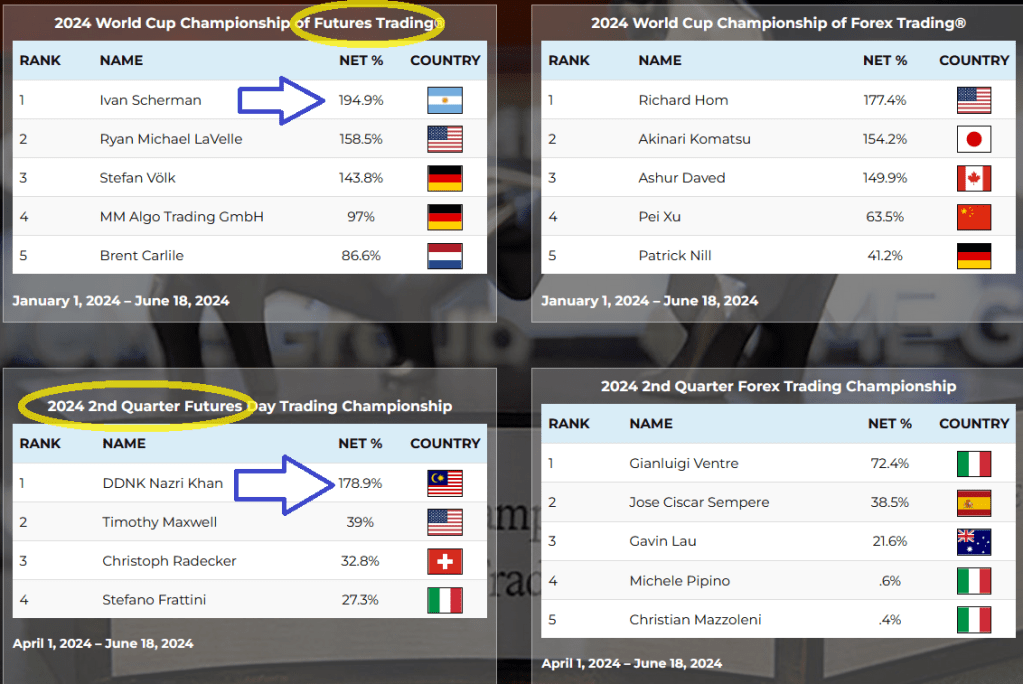
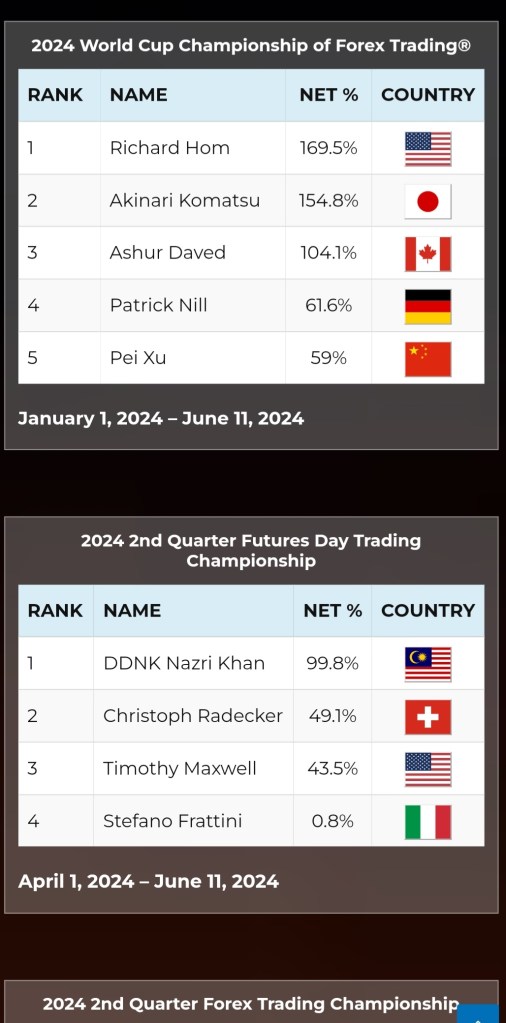
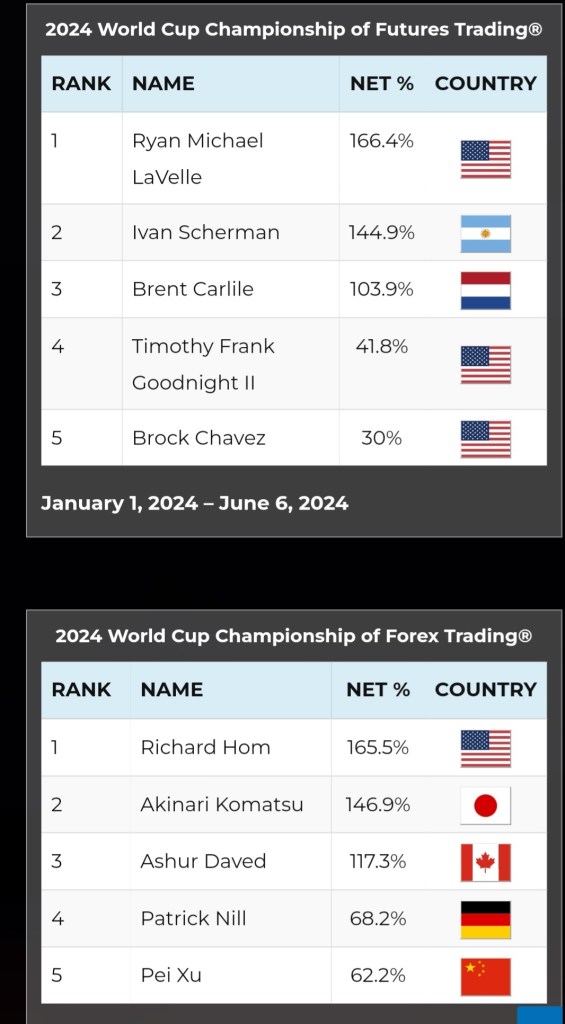
Some futures traders are annoyingly good, but I don’t live in the US to engage with their plays.
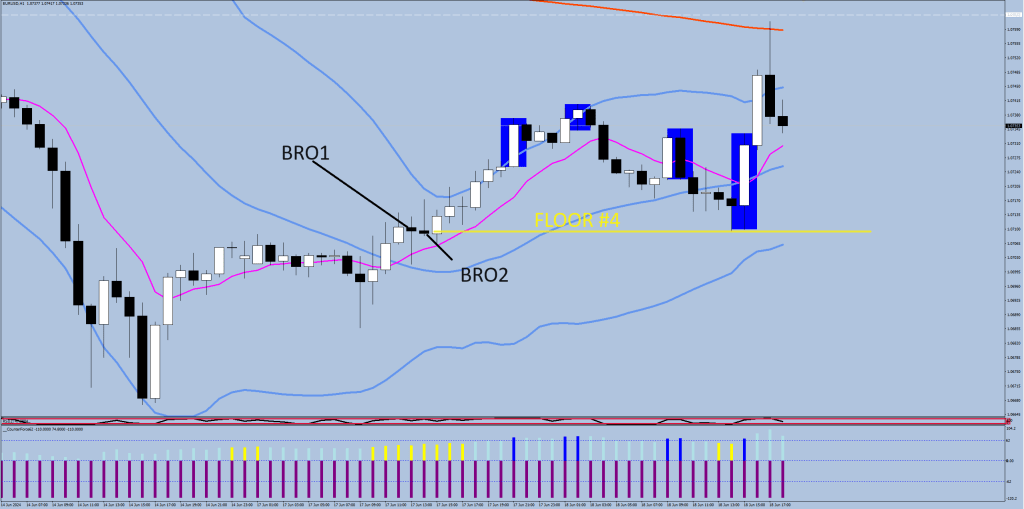
…on the 4th floor hitting the ask saying the Euro is a deal at this level.
Brother, you are going down!
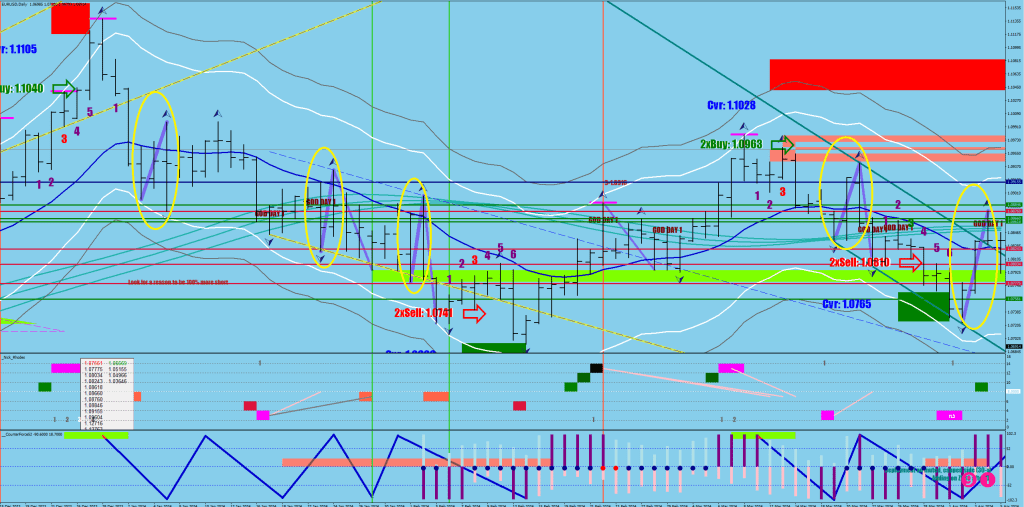
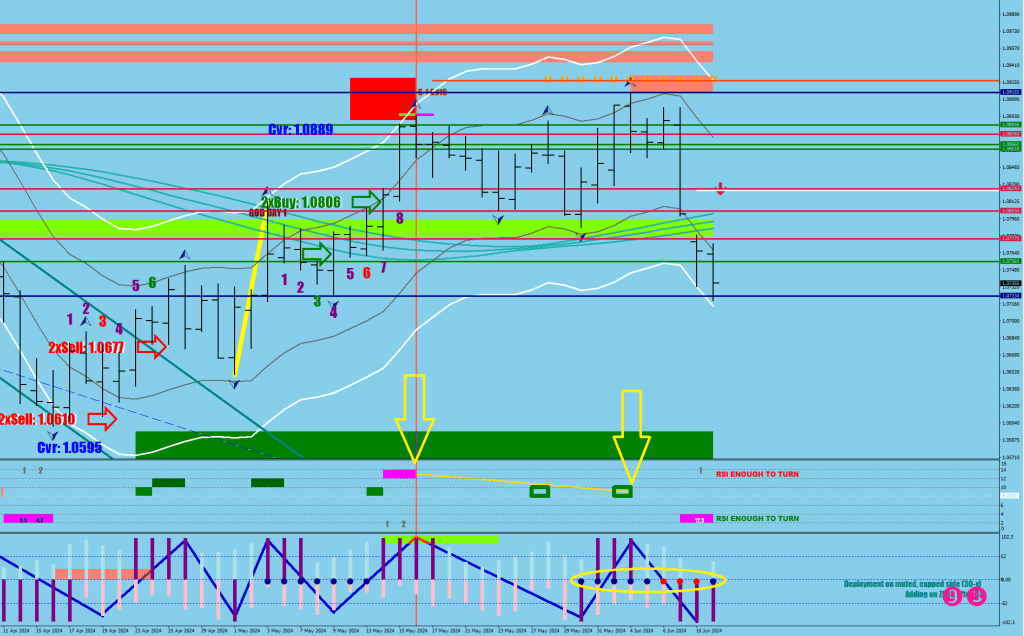
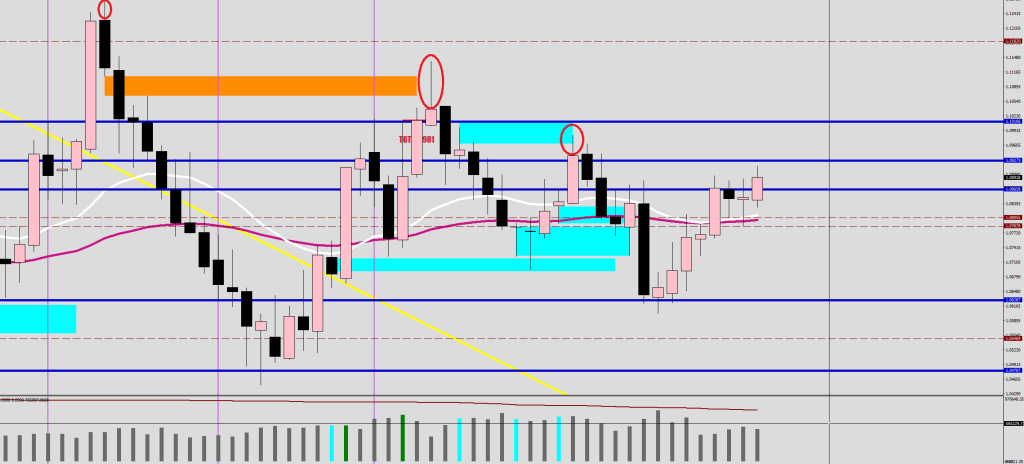
My base case scenario is a slow bow back following a liquidity break round-trip, not unlike these two were:
Day 3 makes a trip wire that the consecutive stumble over would make the price fall in the box. If you get a liquidity break up as a next move, the structure will continue lower, if not, the reversal has taken place.
The close end (stats) would be 45 pips lower, and the far end would be 82 pips lower.
I started plotting a daily 16 EMA HL2 to know what the bow’s peak should fall short of. When the E-16 gets violated, that means that the subsequent daily Fractal print won’t be the divergent leg, but rather the measuring one.
Looks like I have to learn yet another name and another country’s flag.
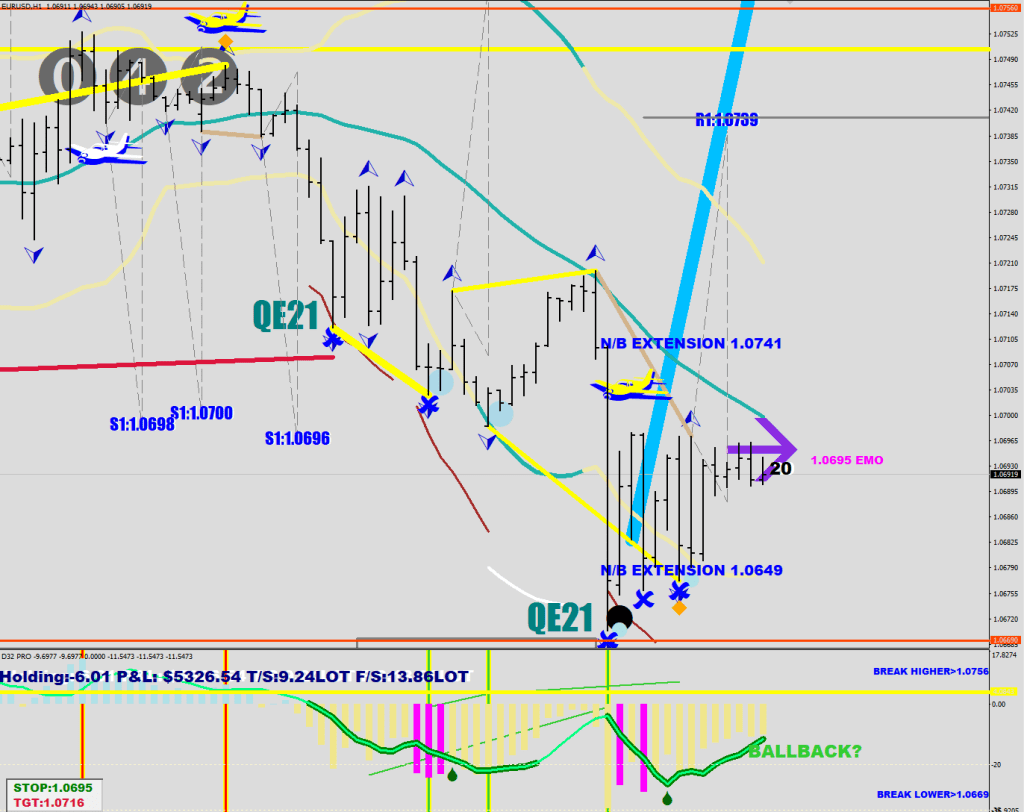
My Return to Zero routine was able to point out the weakness and is showing an Impulse Bottom (end of impulse leg) currently.
The correction could go on for 21-23 hours, so there’s 15-17 more to go.
I did make changes to the Gray divergence on the upside with a Yellow upgrade, although it may take forever to see this very same, Extra Dangerous condition back, it has to do with the relative underperformance of the Green Volatility (falling shy of expectation).
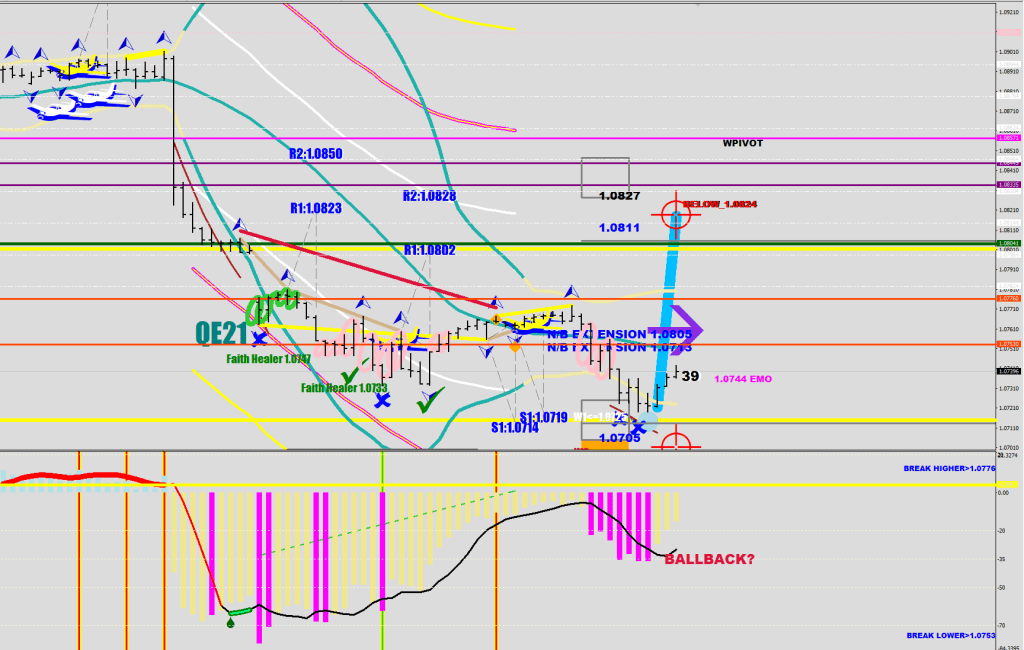
The low is definitely not in. There could be a move back beyond the 1.0744 fractal before continuing lower.
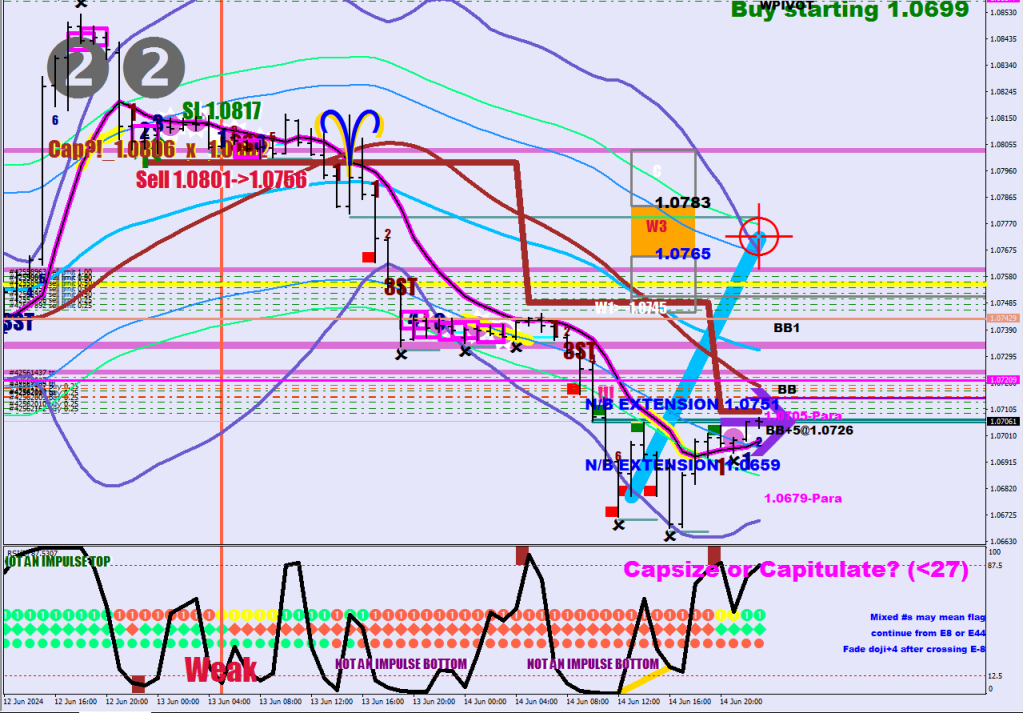
I believe that Wave 5 down could reach a 3.9x-4.5x Stretch which would mean approx. 1.0658 – 1.06 currently, but depending on speed (time) it may end up way lower. My current thinking is that the low would be made in 3-6 days from now by a bit more of a bow back first.
The next level to be undercut is 1.0621
Album #10.
In 50 days, 200 songs were made culminating in this collection.
Here’s an idea: since there is no way to draw a bow back in MT4, why not use a triangle instead? In Yellow of course.
All of a sudden it makes sense why the rally ended where it did.
If you count the legs from the yellow triangle down, there were 7, like I expected them to be.
The stochastic reading in white (yellow arrow) was extra high to be THE bottom. This is most likely a Wave 3 down, which would make Pippoletto look like a total idiot with his Elliott Wave faith course about the Running Flat correction that should yield a Wave 3 in the opposite direction according to him.
The minimum would be the undercut of the Weekly S2 at 1.0568, but I would think close to 1.05 isn’t out of the question.
I’m on a First-Aid course tomorrow, won’t be able to trade much.
The American is maintaining his 30% lead over me, but I am cornering #2 already.
I missed the top because I made a dangerous leap in my thinking from a thesis to secrecy.
I accepted a Yellow divergence as a must, and there was only a Gray one.
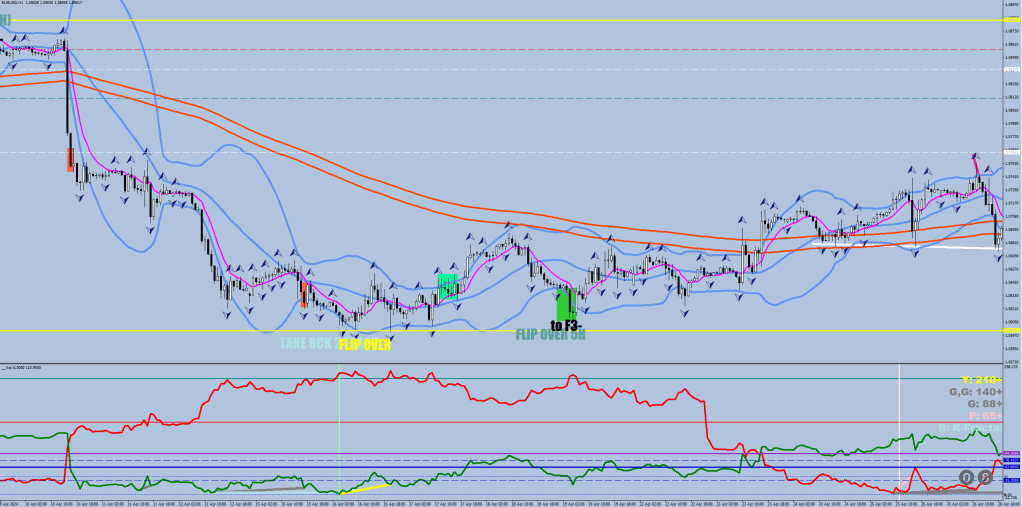
A volatility divergence can only be yellow if the next hourly candle after the divergence ending fractal print manages to close back inside the hourly 8 EMO (magenta).
On the other hand, there was a yellow divergence (RSI2) on the daily chart.
Another thesis confused for a fact was that a top would not print during a Daily Squeeze. Well, it printed and 196 pips lower the squeeze is still on. A third one was that embedding is necessary for finding Ammo. There was an intraday embedding print, but the big break canceled it.
Since the Red volatility line went beyond the 200-sample 166-pips marker, the Blue divergence was only able to reclaim 1 fractal, not 2 as it would have been able to below 166 pips.
On the downside when the Green volatility is getting compressed/whacked, the default divergence color is Blue, and it can become Pink (Early Divergence) if the Green Volatility divergence’s endpoint exceeds 41 pips
  if (ExtATRBuffer2[i]>41)  ObjectSet("Frog"+IntegerToString(i),OBJPROP_COLOR,clrPink);

Yellow would be the Green Volatility line has been sustainably below 41 for 24 hours with the whilst the Red volatility line has gone above 41 at the Green Volatility divergence's endpoint


 if (ExtATRBuffer2[ArrayMaximum(ExtATRBuffer2,14,i+10)]<41) {
      ObjectSet("Frog"+IntegerToString(i),OBJPROP_COLOR,clrYellow);
      if (ExtATRBuffer[i]>41 && Close[i-1]>iMA(symbol,0,8,0,MODE_EMA,PRICE_OPEN,i-1)) {
         ObjectCreate("Frogg"+IntegerToString(i),OBJ_TEXT, 0, Time[i+8],Low[i]-40*Point);
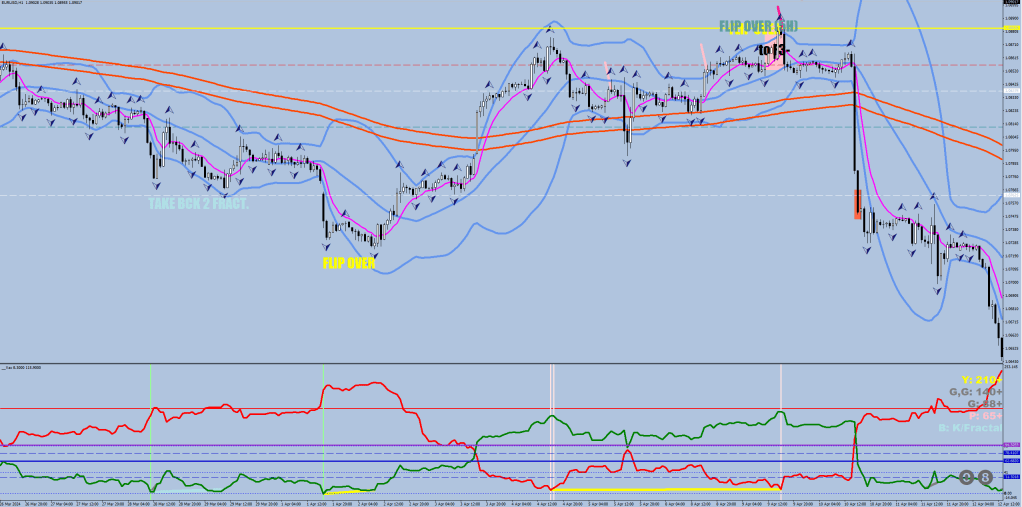
         ObjectSetText("Frogg"+IntegerToString(i),"FLIP OVER", 26, "Impact", clrYellow);}


Gray override would occur when the next hourly candle after Green Volatility divergence's endpoint was unable to close back above the 8EMO
if (Close[i-1]<iMA(symbol,0,8,0,MODE_EMA,PRICE_OPEN,i-1)){
         ObjectSet("Frog"+IntegerToString(i),OBJPROP_COLOR,clrGray);
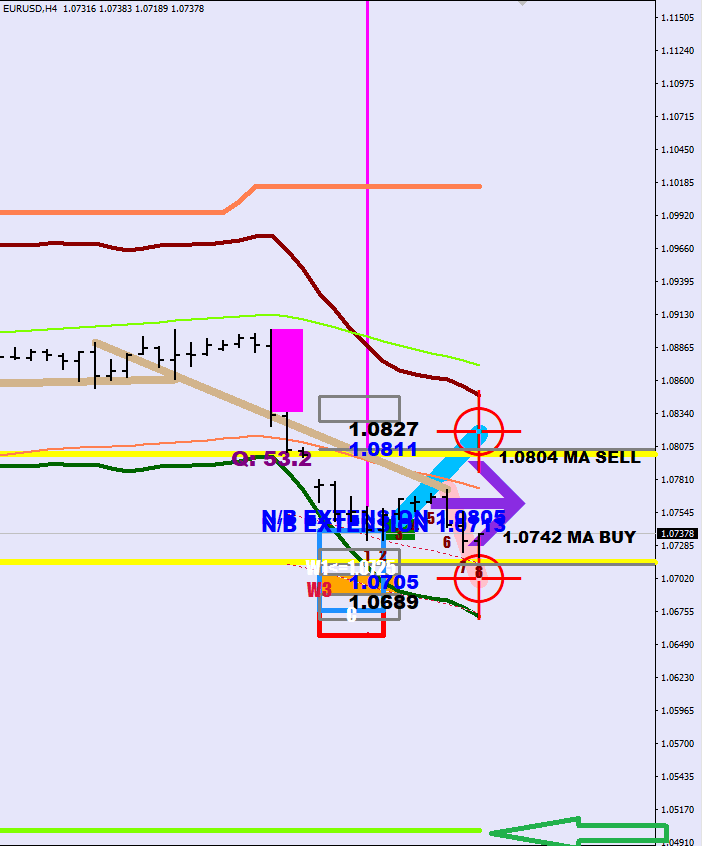
What does a Gray divergence mean? A counter move excess of 88 pips. This would put the price back above 1.0808 briefly. A low would be in, but not THE LOW. The 4-H empty powder box speaks of the same thing. To be a shaded box, the bumper line has to be exceeded (at 1.05 currently).
1.0804 is the approximate Wave 2 sell level currently (which happens to be the gapfill).
The Tie Machine’s Yellow box so far is the real deal.
No one responded to me: European voting over the weekend. Yea, I am busy enough with my day to day chores and did not spot this on Forexfactory before the last article was out.
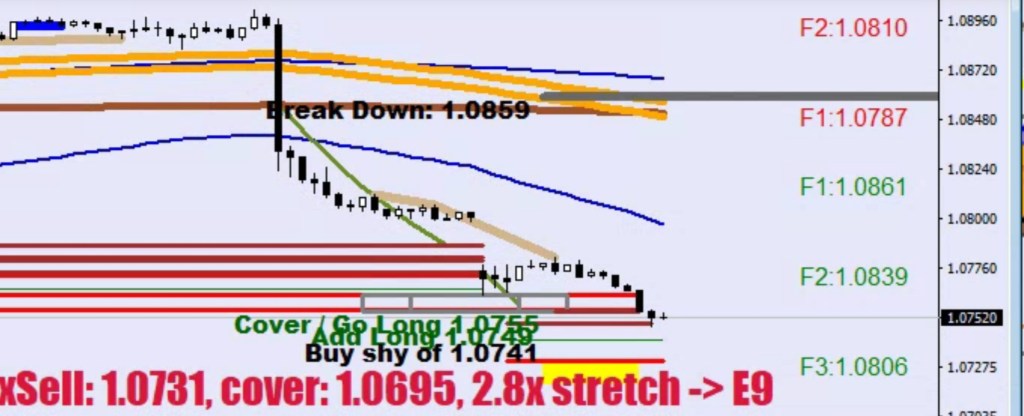
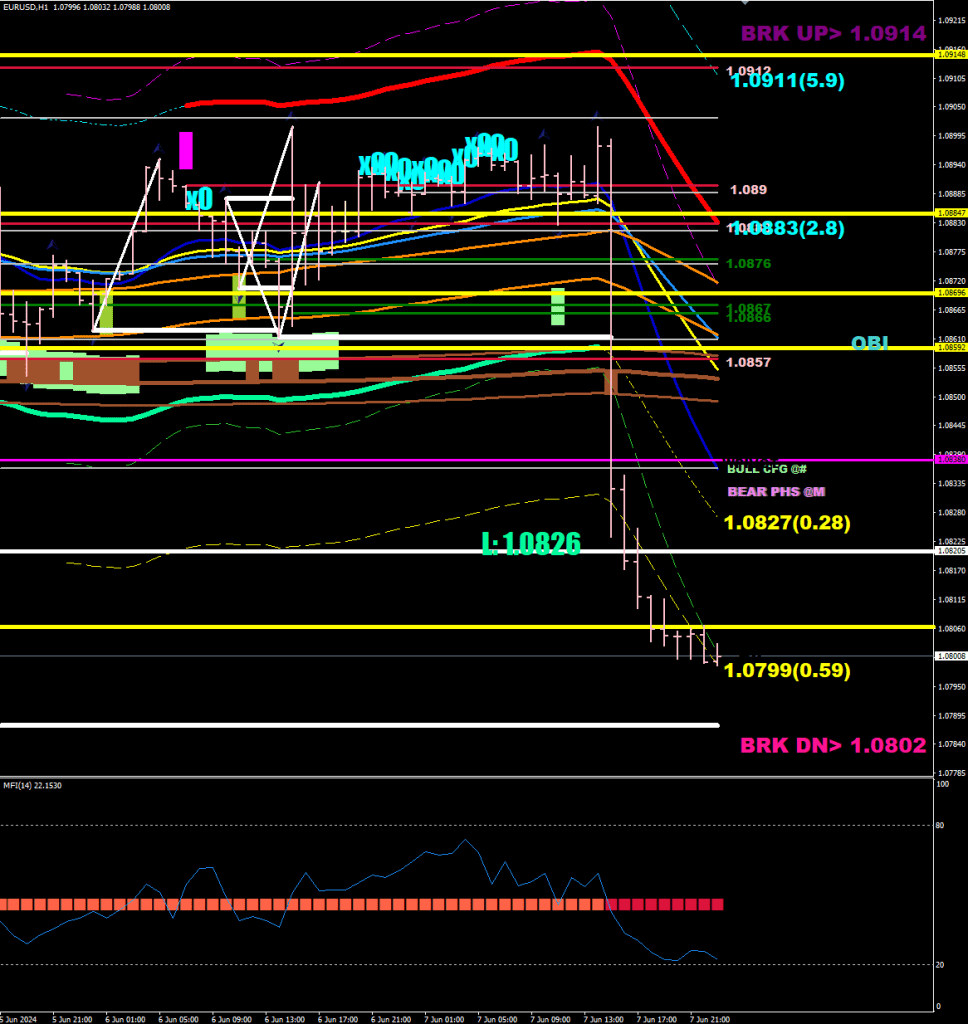
The explanation of the gap down is that the Downside Break level should have been called Gamma Flip all along.
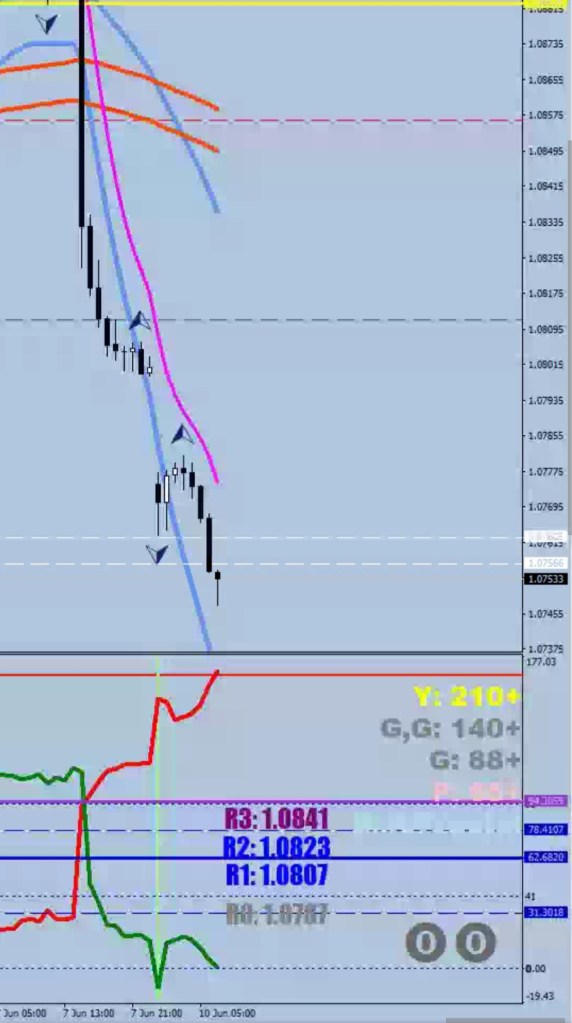
The new Money Flow Reversal zone got pushed far lower by the gap down. The reversal is expected to take place into the low 1.074x-s, but if things get extra wilde, after an 1.0730 print you could see another 16, 26 pips more.
You have got a Volatility Compression Anchor, but you would also need a yellow divergence growing out of it for the raining to completely stop.
This time it is very important that after the low fractal print the next hourly candle would close back above the 8 EMO (magenta), otherwise there could be another anchoring sequence beyond this one.
Let’s listen to my “FCU maintenance at Crown Agents” blues that I made during lunch break on Saturday.
Funny how this Murphy works. I did that top-down analysis and stopped before the 15-minute chart.
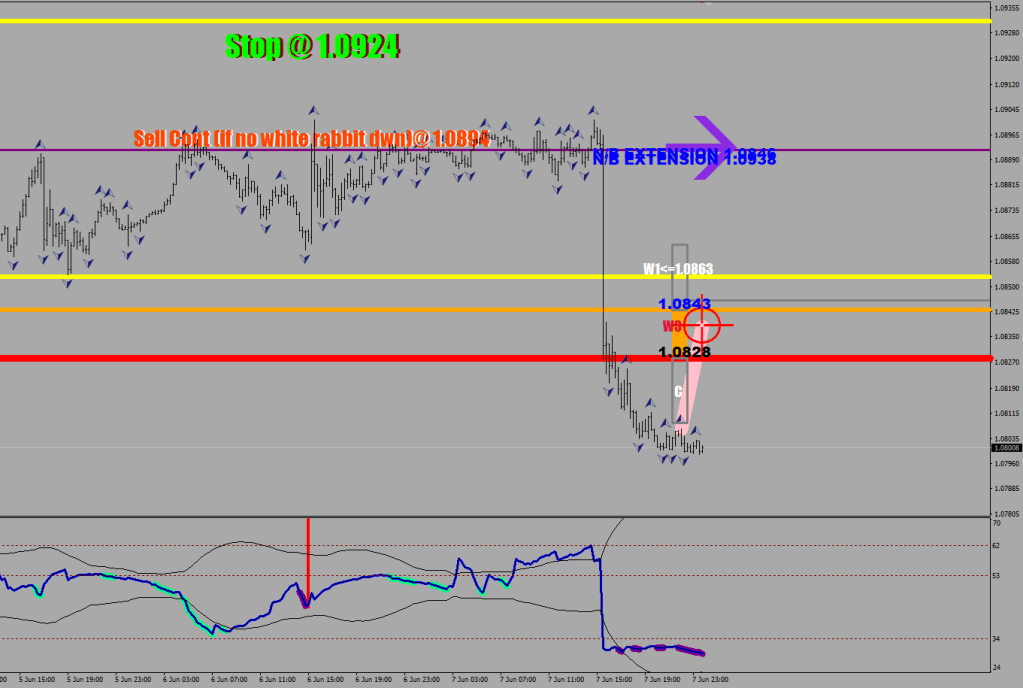
OIt was there in White and Red: sell continuation at 1.0894 (if no white rabbit down – there wasn’t).
I need to go back to start looking at energy readings again.
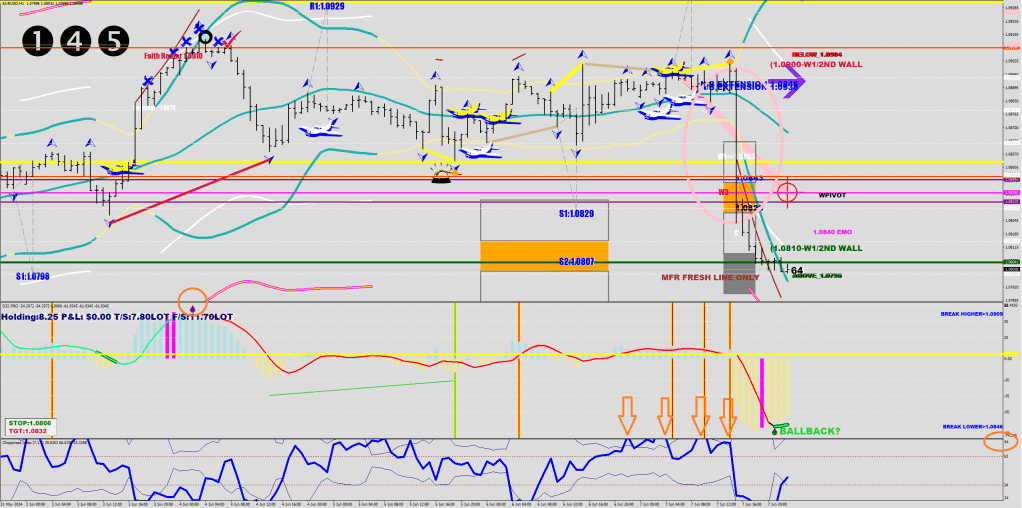
There was a reason to having the CI be cut at 64: it represents an extra high charge.
The D-32 was clearly showing that this was still the same wave with the drip above (the red line was even glowing in that section – have to adjust the hue). There was the hotel-bell icon for the impending major break. The MFR fresh line only means that having reached the Gray Box, the market isn’t going to stop until it prints a new Money Flow Reversal zone and would have to walk into one of the lines at the minimum before it would reverse, which does not mean all that much at this point, as the new zone is going to print on the open.
The old lines start at 1.07867, but we want to see the new ones here.
I should start referring to the Break Down and Break Up levels as temper levels to remind myself that they are targets.
So, what is it like to trade on a Pro-Ecn? It is good. Half the cost. The spread caps out at around 15 pips versus 20 earlier, so about 20% better. The swap is the same.
How is the competition going?
I first heard about the Robbins Cup along with the ICT clown’s deeds.
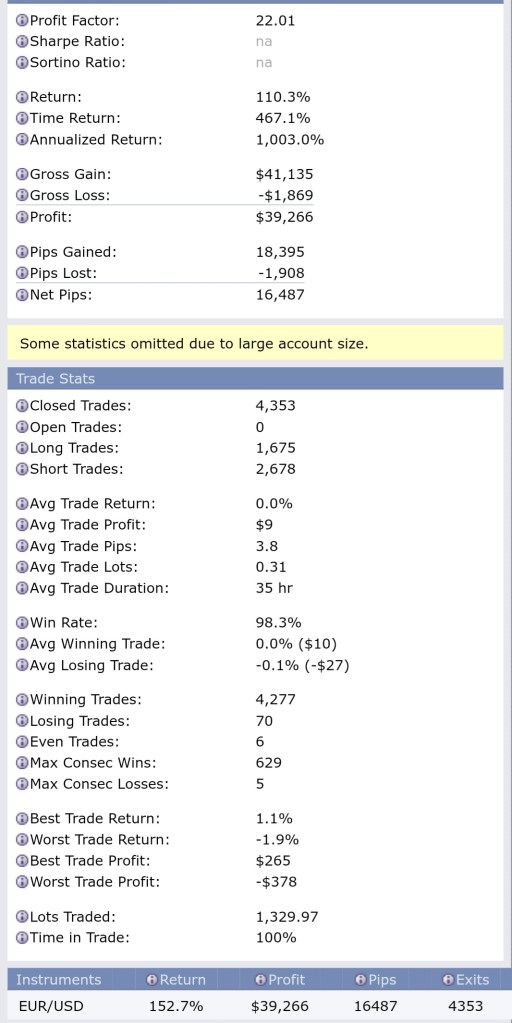
I use it as a reference for myself. I made $3116.87 last week on closed-out trades bringing the yearly percentage to 135.7% which keeps me in the game for sure. A bit bitter about the missed opportunity, others may have utilized it – the update is always delayed.
I was hoping for the Japanese to win – and upon beating him, posting on the blog: if anyone knows this guy, give him my address to forward the trophy to. Don’t send any sushi, I can’t stand seafood. Also, a sepuku isn’t necessary, it is enough to admit defeat.
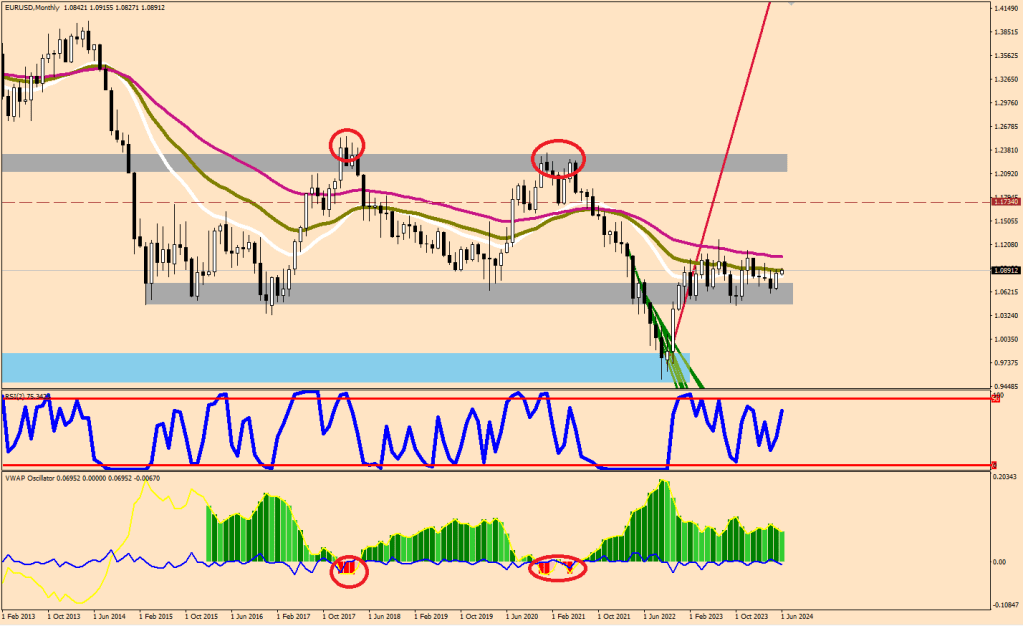
The Monthly Vwap oscillator goes negative at major swing highs. The current sideways block is a transiting phase, not a top.
For a weekly reversal you need a week with a higher high and at least a close-back by 45 pips.
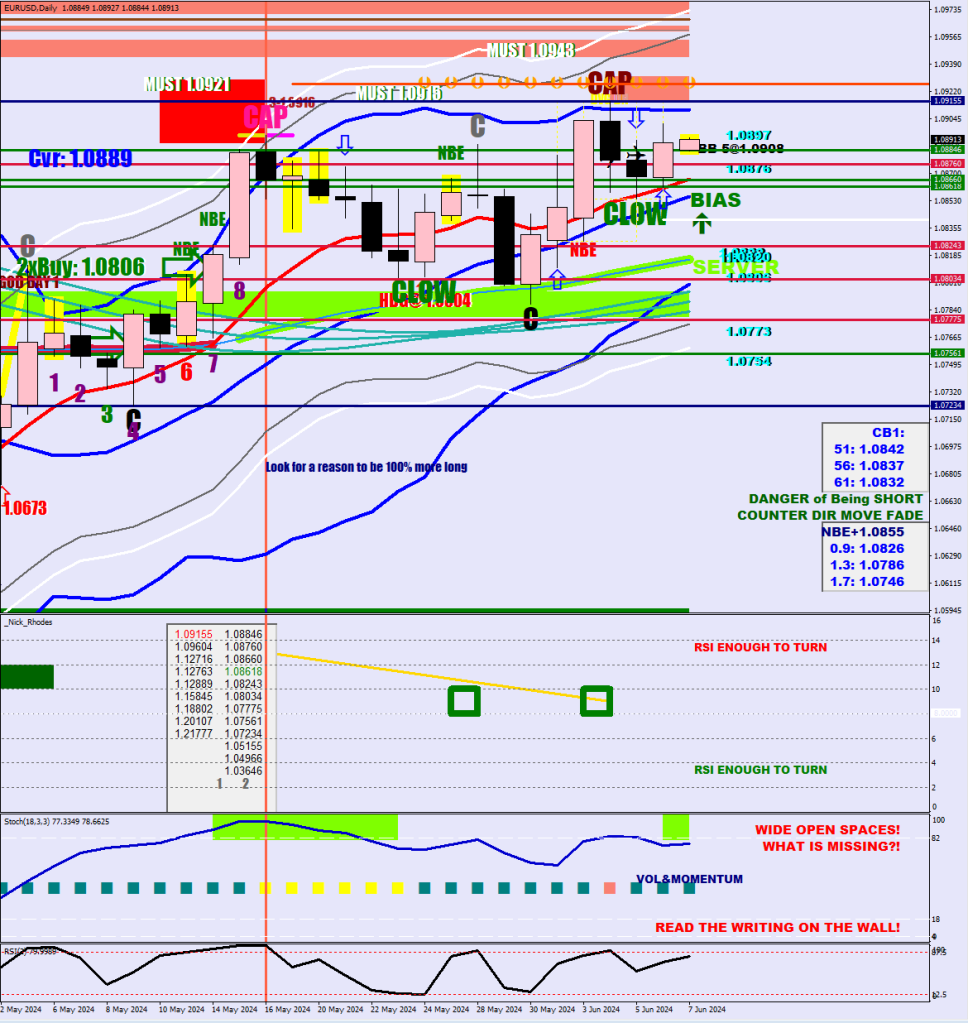
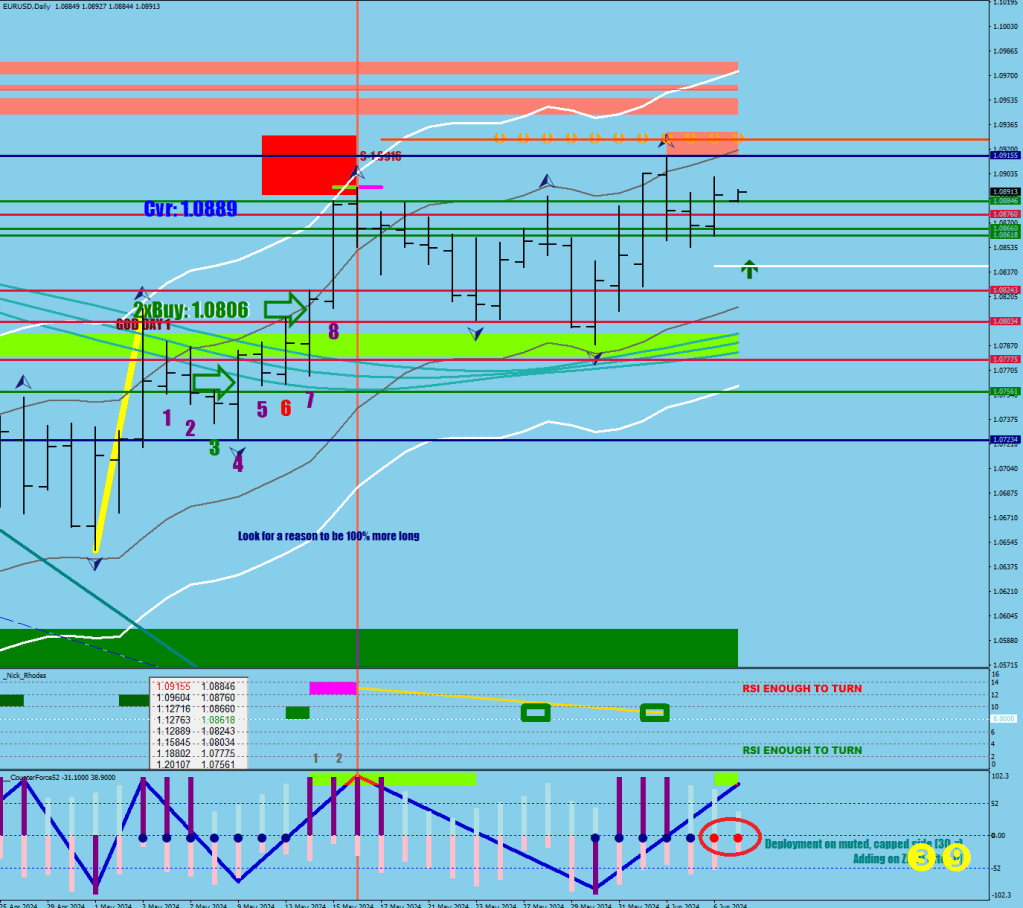
The daily chart just made a CoverLow 2 days back, which is a dip and comeback from the other side of the E-9.
The stochastic is becoming embedded (Chartreuse).
As I mentioned before, a top does not occur during a Squeeze, which actually has become stronger.
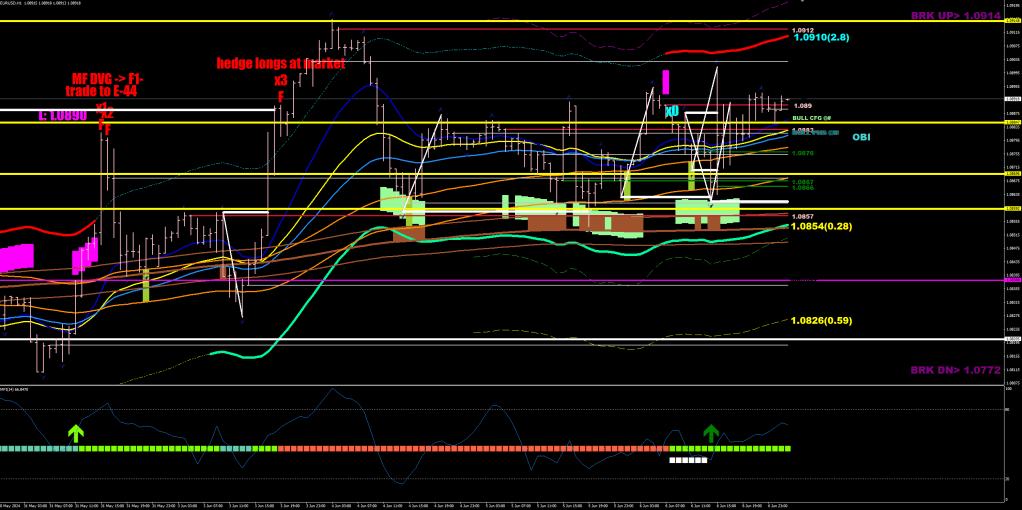
The 2.8x stretch line (white) is now reaching the top of the resistance zone.
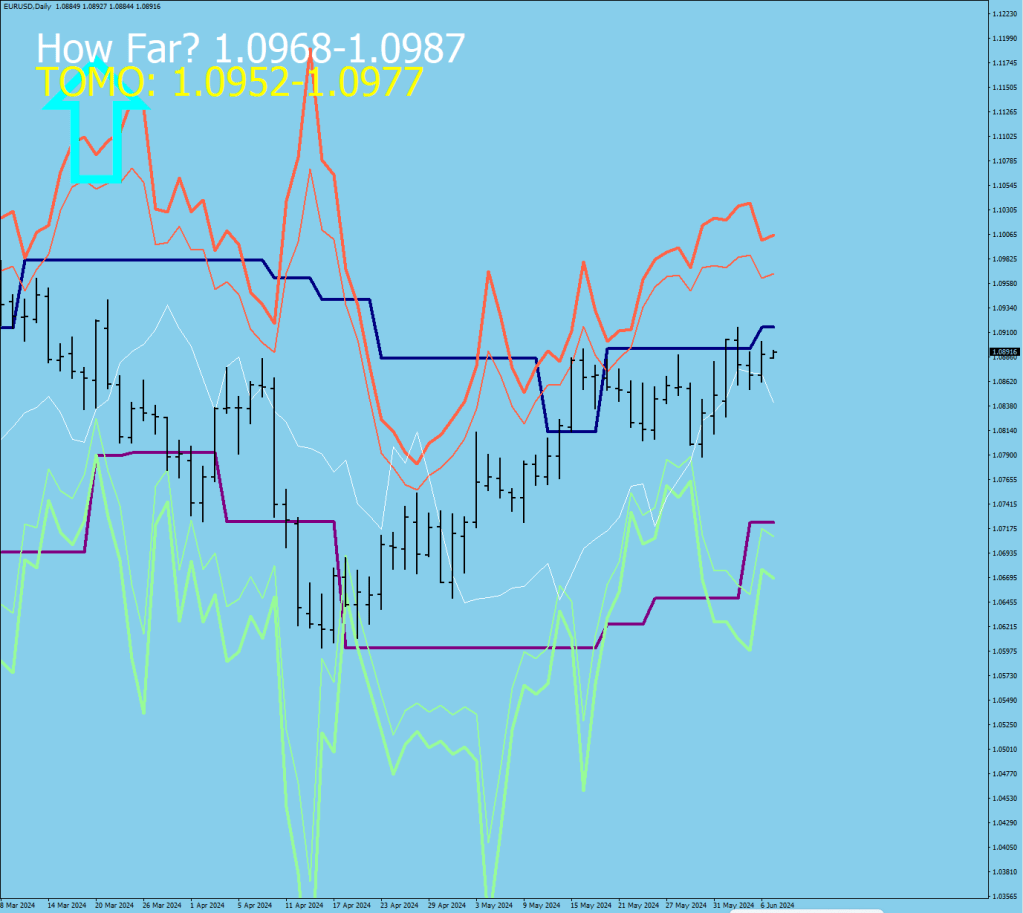
The closer half of the Energy Bands is 1.0968-1.0987. That’s where the next exhaustion could occur within 1 day.
For a shaded powder box to print, the price would have to best the Bumper Line at 1.0994.
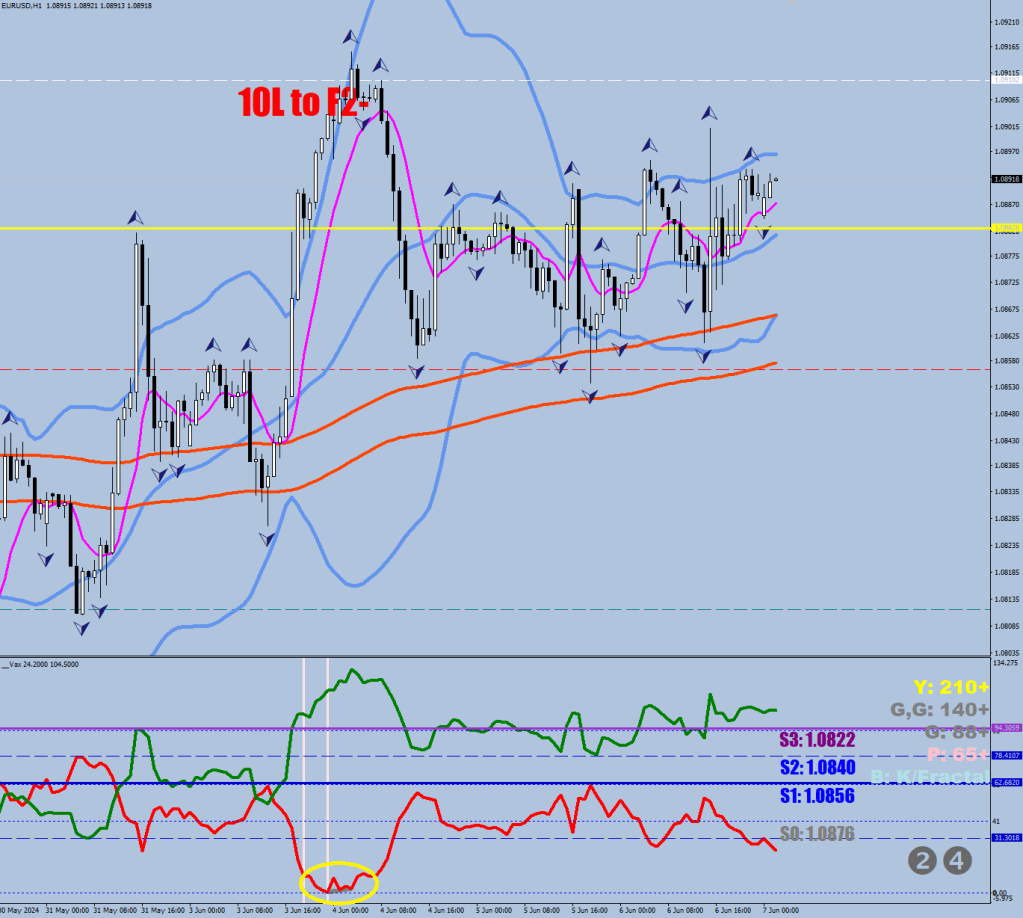
The hourly chart flipped back to positive due to a 72-hour unability to tag the lower Safety line (0.28).
The white squares are the Early Bird Special entry zone. The scissors are widening with the E-103 above the S-356.
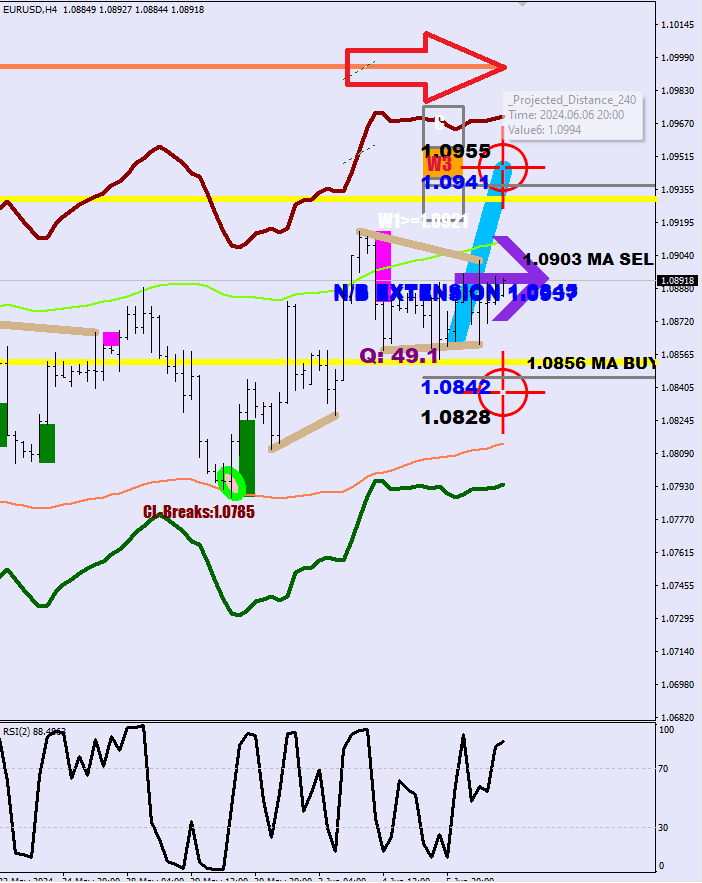
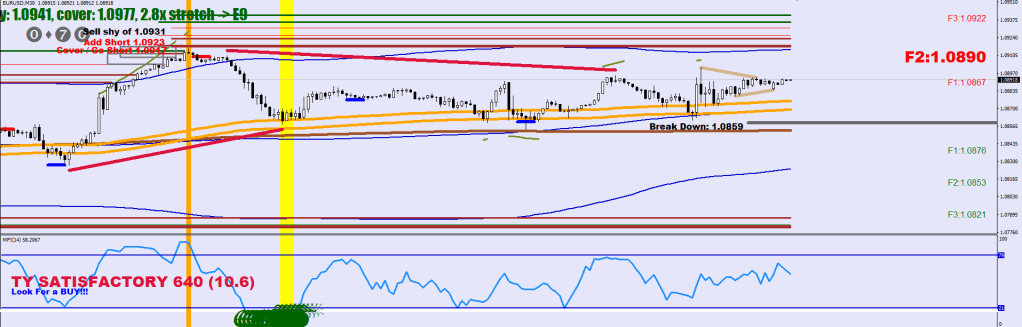
The volatility compression divergence was a gray one, which normally triggers an 88+ pips correction, which would mean 1.0828 – this quick dip could still happen, but the weekly close would probably still be within 40 pips from the weekly high. The Green line would have to go beyond 166 (105 currently – that’s at least 60 pips more) before a top could set a yellow divergence by closing back below the 8-EMO in the following hour of the peak’s capitulation-thrust.
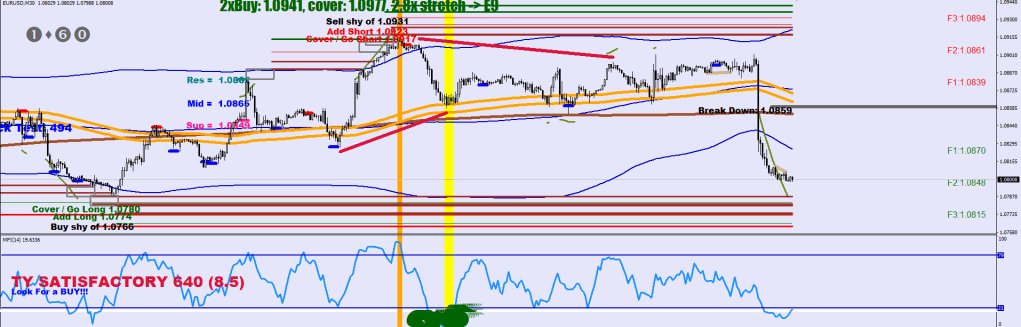
The 30-min says that if 1.0941 gets hit, there will be no stopping before 1.0977.
ExtAtrBuffer is the Red Plot, figuring the maximum distance achieved from the 200-sample hourly Highest High.
ExtAtrBuffer2 is the Green Plot, figuring the maximum distance achieved from the 200-sample hourly Lowest Low.
The volatility compression anchor is a plausible place from where the volatility compression divergence may arrive from resulting in a full turn. The presence of this compression anchor is a requirement for a 3-point turn to take place.
The vertical lines are the visual highlights for these plausible places in real time.
///Volatility Compression Anchor For A Turn Down
if (ExtATRBuffer[i]<10 && (ExtATRBuffer2[i]>150 || Low[i]>iBands(symbol,0,30,2,0,PRICE_MEDIAN,MODE_UPPER,i))) {
      ObjectCreate("LOTUS"+IntegerToString(i),OBJ_VLINE,indicator_window, Time[i], 0);
      ObjectSet("LOTUS"+IntegerToString(i),OBJPROP_COLOR,clrMistyRose);
      ObjectSet("LOTUS"+IntegerToString(i),OBJPROP_WIDTH,3);
      ObjectSet("LOTUS"+IntegerToString(i),OBJPROP_BACK,1);
}

///Volatility Compression Anchor For A Turn Up
if (ExtATRBuffer2[i]<3 && (ExtATRBuffer[i]>166 || High[i]<iBands(symbol,0,30,2,0,PRICE_MEDIAN,MODE_LOWER,i)) && Close[i]>Low[i]+10*Point && i>0
&& High[i-1]<iMA(symbol,0,8,0,MODE_EMA,PRICE_OPEN,i-1)
) {
      ObjectCreate("LOTUS"+IntegerToString(i),OBJ_VLINE,indicator_window, Time[i], 0);
      ObjectSet("LOTUS"+IntegerToString(i),OBJPROP_COLOR,clrPaleGreen);
      ObjectSet("LOTUS"+IntegerToString(i),OBJPROP_WIDTH,3);
      ObjectSet("LOTUS"+IntegerToString(i),OBJPROP_BACK,1);
}
An anchor may have just printed. Caution, a sharp turn is a possibility.



















 ForexFore - Internals, indicators, algorithmic trading