First of all, there is a use to have a marker at certain “stretches” on the ramping side of the volatility, not only the compressed side.
Figure 1:
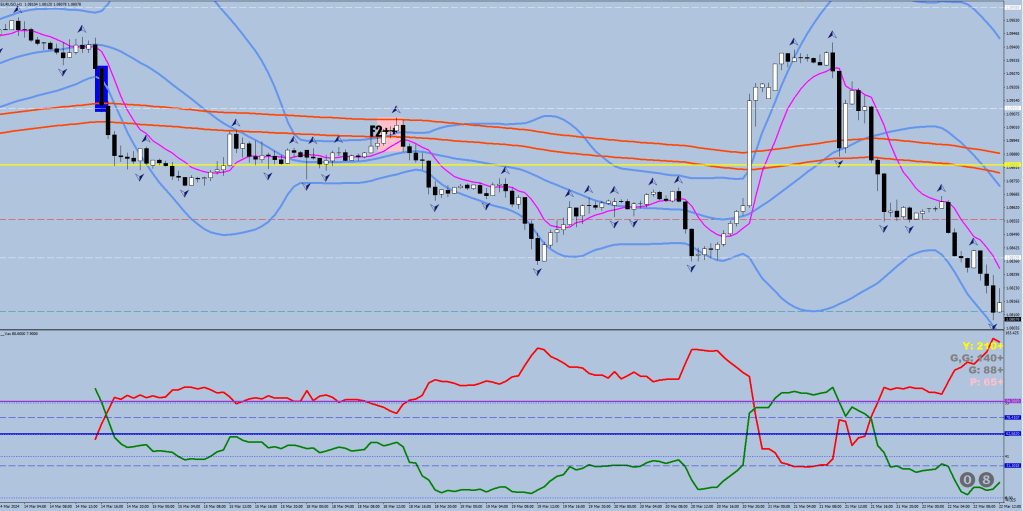
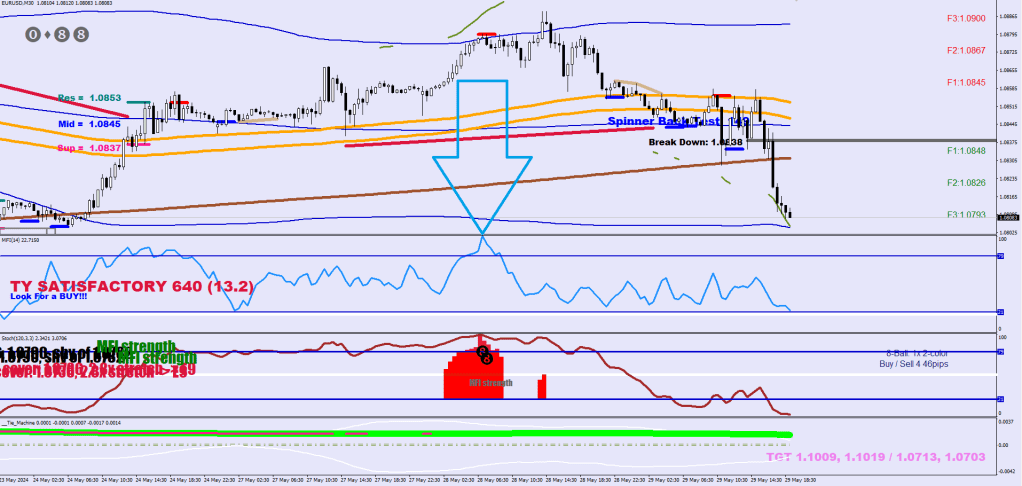
The EurUsd is a likely sell upon the 200-sample long-side stretch exceeding 166 pips.
I spotted this earlier, and the plot is now adjusted to 165.5.
///Exit Conditon Up #3

if (ExtATRBuffer2[i]>165.5
)
   {
      ObjectCreate("Firstpulls"+IntegerToString(i), OBJ_TREND, 0,  Time[i+2], High[i]+200*Point, Time[i], High [i]);
                     ObjectSetInteger(0,"Firstpulls"+IntegerToString(i),OBJPROP_COLOR,clrRed);
                     ObjectSet("Firstpulls"+IntegerToString(i),OBJPROP_BACK,1);
                     ObjectSet("Firstpulls"+IntegerToString(i),OBJPROP_RAY_RIGHT,false);
                     ObjectSet("Firstpulls"+IntegerToString(i),OBJPROP_WIDTH,6);
   }
At the same time, the downside can experience a much larger ramp (based on recent history).
The Teal tripper is at 266.
The concept of taking back 2 fractals comes next. This means 2 hourly fractals but a failure before the 3rd.
The third one of such calls (after having gone beyond the 166-line) only managed to take back 1 fractal before proceeding lower. There is a filter eliminating a Take Back 2 Fractals call if the low gets taken out in the next 5 hours, so there were some additional calls that the paint did not manage to dry on.
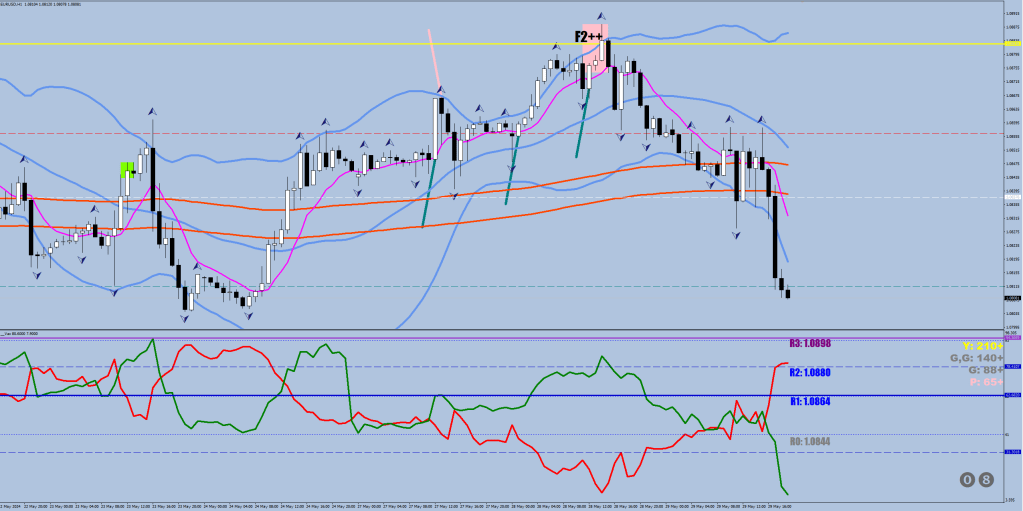
This brings us to the bear case at the current standing.
It took back 2 fractals, but failed before the 3rd.
There is one problem though. There is no proper top in place. The last Yellow Flip Over was at that 266 stretch on the downside. The direction remains up.
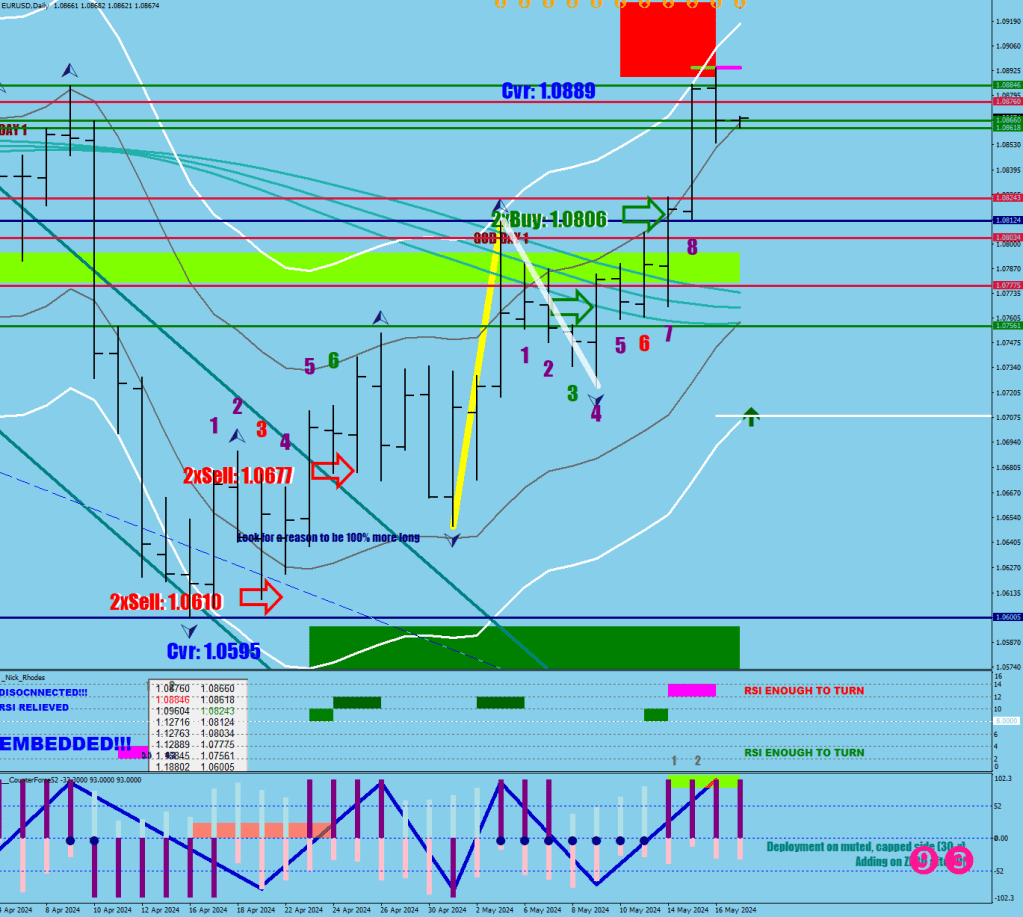
There is no top that is made with a BB squeeze (blue dots) or when the market is lulling at rest right next to the Daily E-9. The final leg, #7 (from the low) should experience a stretch condition of 2.8x from the Mean, which is the white line above.
I would be looking for a possible sell in the 1.0930-1.0965 zone.
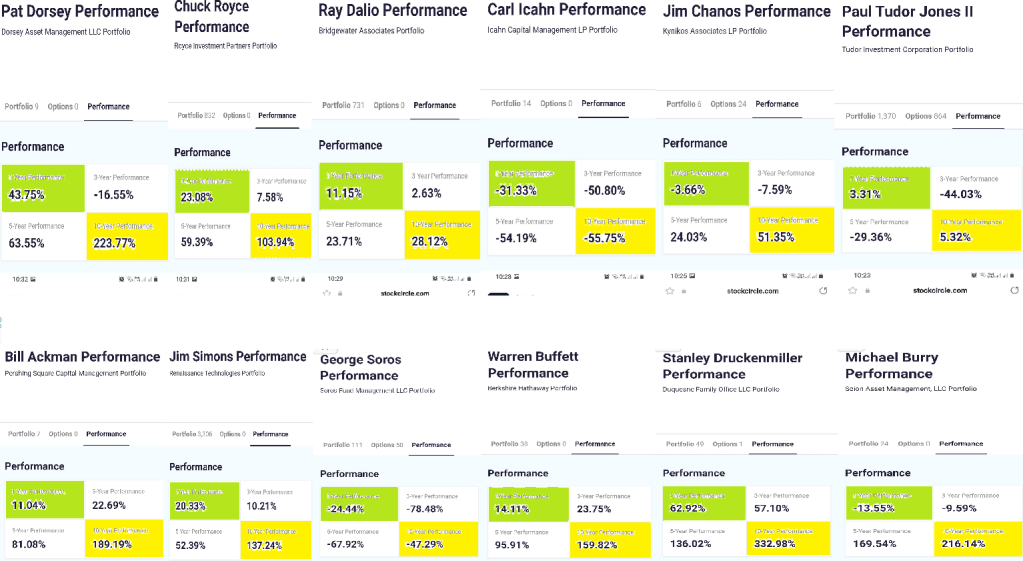
I highlighted 1-year performance with Green and 10-year performance with Yellow.
Rated: incarcerated
What should be obvious is that there are a lot of urban legends out there. Just because an Australian YouTuber keeps on repeating that Stanley Druckenmiller has been making 34% per year for the last 30 years, that does not make it true. Nor do unverified populist articles that sing into existence a 2.6 Billion Dollar gain on a single trade by Bill Ackman – just look at the portfolio percentage gains below. What is an extra billion between newscasters?!
Where is the 2.6 billion jump at?
Compounding is another thing people like to throw in for good measure, and it may or may not be true, but certainly sounds awesome. Did I mention Einstein?
I do appreciate that Millions or even Billions are awfully hard to make high percentages with. For one, you cannot use an Offshore Forex Broker for trading, that is for sure. Yet, I had to get you to start rethinking whom you idolize, and what are you trying to learn/copy.
You can actually piss me off with the word, portfolio. Somebody once asked about my portfolio changes during the pandemic. I do not have a portfolio! – I responded. Nor is opening put spreads for 40 days and closing them in 20 should be considered one, Felix – an ex investment banker should know that.
The Druck has one, you can see his net worth dropping 1.5 billion in 2021.
Investing has a lot less prospect than trading, particularly currency trading. You will need good data, tremendous insight, insider info, and to play in rigged ways (i.e. move the market yourself or swim with the black pools) to shine at all. The bottom line is that a trader does not have to commit unethical, borderline criminal acts for results that would put investors to shame. It is no secret that I’m going for the 10-year percentage of Druck, and ultimately a 10-100x that is possible to achieve, but you are still an idiot for experimenting with crypto.
Having great investment results and playing nice don’t go hand in hand. The Marewick Of Wall Street always adds the pronoun “snake” before Bill Ackman, and I remember how passionately Duch hated Warren Buffett.
As a trader, there are ways to act dirty, i.e. spoofing, but you may not need anything that the FBI would incarcerate you for.
After talking down investing, here is some fuel for folk tales to dance to…
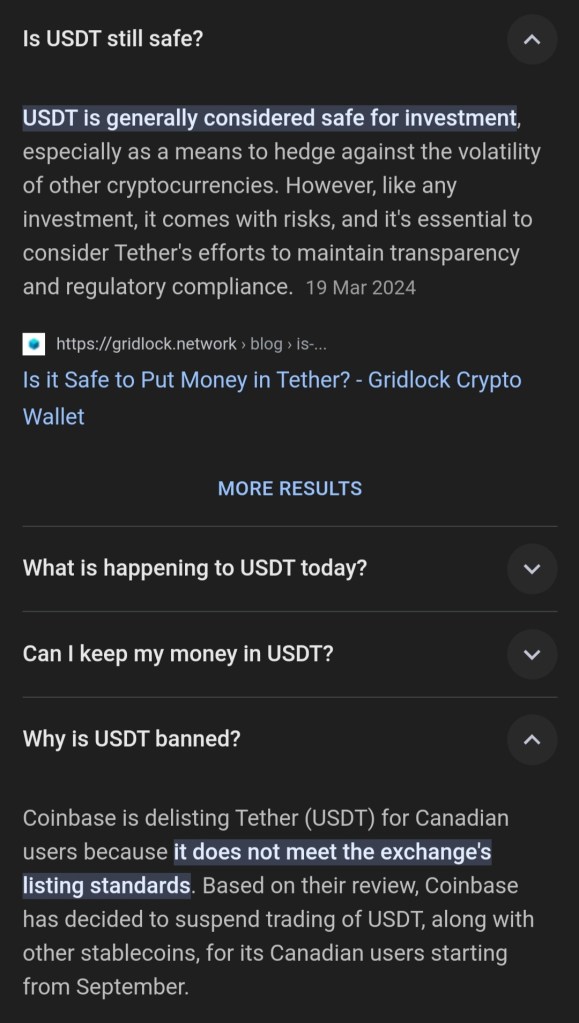
As for trading, I could never figure out what people are doing trading bitcoin futures on USDT basis, which is a token issued by a company that has filed for bankruptcy.
Bonus Shapiro.
Endo the Mayo.
Truth be told, it isn’t true that no one ever saw any potential in me. My last supervisor said to me once: you’re gonna be a billionaire and you are gonna make me a millionaire. My current supervisor? He said he was going to start calling me Quincy Jones.
It’s either that or I would have to retire on a monthly 250 GBP pension that is good enough for 1/5th of my recurring living expenses.
My 7th AI Album.
If I had a business card, now I could have it say: Maintenance Engineer – Professional Trader – AI Music Producer.
I never had one. I was never important enough to have one. What would I have put on it?
When I was 41, having lost everything for the 3rd time, starting from scratch in a 4th country, Ionut told me at the Pullman Hotel: you must be the best English-speaking kitchen porter ever! – I guess that was business card worthy, but then again, who would I give one to?
Belmont (South San Francisco), 2001.
This was my very first job at the tender age of 28 when I had to get up in the morning and perform physical feats without questions, risking my health for money. In short, employment. All I had to do for the privilege was move to America and stop being vegetarian. I worked for a Persian guy who could not say “wörk”, only work just like the marewick of Wall Street can’t.
Ah, competition! I welcome that.
I would be in 3rd place currently with 125%, but the year is young & I have 9 more Aces up my sleeve.
Of course, I traded a bit more after this post, so these are the final numbers for May 2024.
I like the 350 longs and 349 shorts combo. 35.3% was the final gain.
What you are anticipating here is one of 3 different outcomes.
Since further volatility compression is not likely, your volatility divergence anchor point is in place.
(The orange box was an at market continuation sell marker.)
If the next hour does not make a new low, a fractal print is halfway made. For a Gellow, final volatility divergence you would need the next hour to close back above the hourly 8 EMO. If it does not, but one of the following candles do, the divergence would be Gray, which would prompt a correction in excess of 88 pips up. This means a 66% chance with all the current unknowns for a minimum move up from the current low by 90 pips.
The money flow low made a money flow reversal zone, which is another way of taking notice of an impending reversal.
Yes, this would mean that a brutal wave 3 of Wave 3 is coming up next.
That was an excessive, 100% money flow print. They are getting punished for a day whilst the brokers get to charge triple swap on the stuck Euro longs.
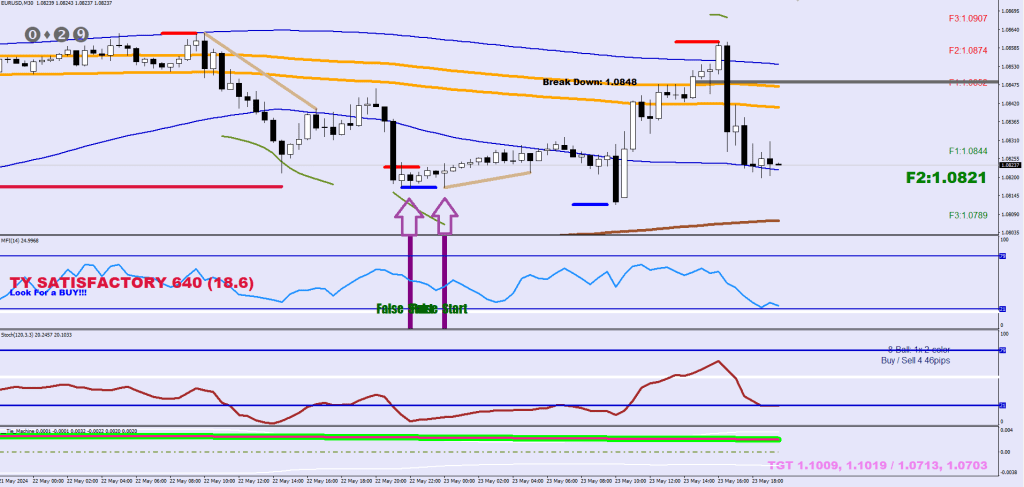
After a false start, the market hammered out a low at the S-356 (H).
Blue ovals: support hammers. There is constructive money flow currently.
The daily chart has found Guns in the Chartreuse embedding period and pulled back.
The RSI2 was in the magenta during the day but closed way back up from it. The next move up is to find the Ammo.
I just coded these few lines that I’ve been wanting as a plot.
Do you see the W made around the support level? Everything is pointing higher.
The idea of the First pullback is a streak that is 36+ pips long, the same color, and a continuation is warranted – with the caveat of being above the municipal trench the highlight becomes the 20-sample high instead.
So, the test of the S-356 is still making us wait.
I had to think for a second about what meant what again. The !10 means the 10th hour (count 10 blues) the oh stands for OverHedge, and the buystop is the high of the 10th hourly candle and is to ensure that you get your required volume. The blue square is a neutral print here.
Also, it would be nice to see Full Discharge (F) in a green color below the S-356.
Not sure how anyone would figure cheats like a “False Start” without using indicators.
I was explaining this in the morning real-time to a coworker: the candles weren’t rushing away from the False Start low (Stochastic precedes the Money Flow – it’s the wrong way around) and so I was expecting a lower low still to grab some extra liquidity.
By the way, the market is still embedded and this move down may just be a fake out.
1.0807 keeps on showing up, and I believe we could see it print.
Time is not in favour of the dollar long here, but S2 would be hit before we proceed higher.
I will scale into a long starting 1.0818
There could be a major bottom forming around the S-356 with 3 Full Discharge prints in quick succession.
The S-356 is at 1.0790 & rising.
Now, about specializing.
I used to work for a guy in California. His net worth was 42 million usd when I left in 2012.
He used to look at screwdrivers with variable tips in a pity. He would always say: that is not a tool.
Rene is still young. He is a better coder than me, but not a better programmer.
He had his best month ever, running different strategies on multiple instruments. I have merely started my hybrid trading on Eur/Usd.
His started with his setup on the 21st of March. He rolls with the industry ideas that a lot of people seem to embrace, and provides plenty for the broker. He believes in a profit factor of 1.2 -1.3 as a key to succes.
He picked an arbitrary 4-week period from the 21st of April to the 19th of May to claim a 12-k gain, which was a come back from a 36% draw down loss, so currently he has 41% gains – very good for 2 months.
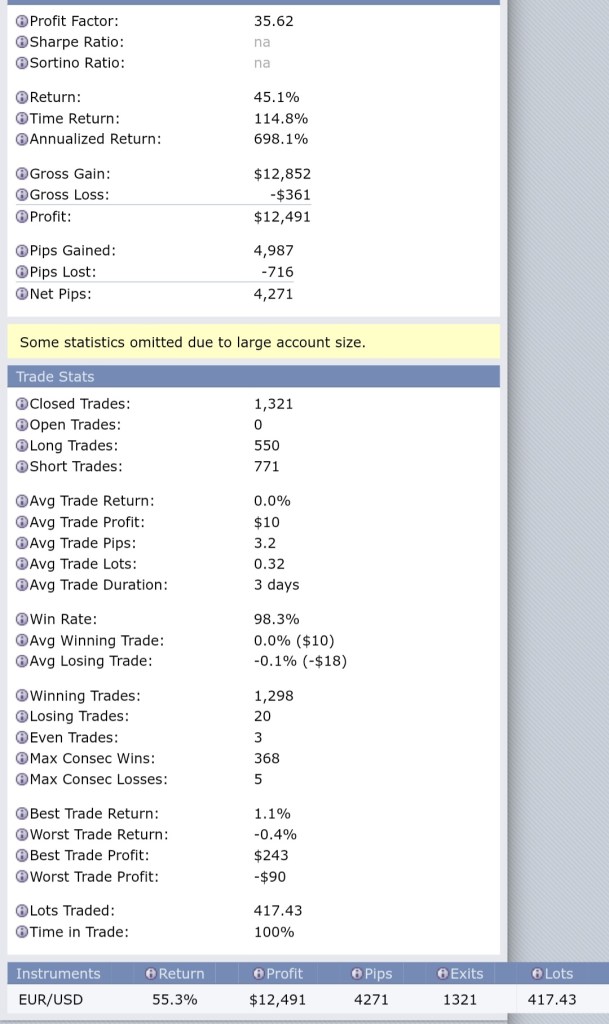
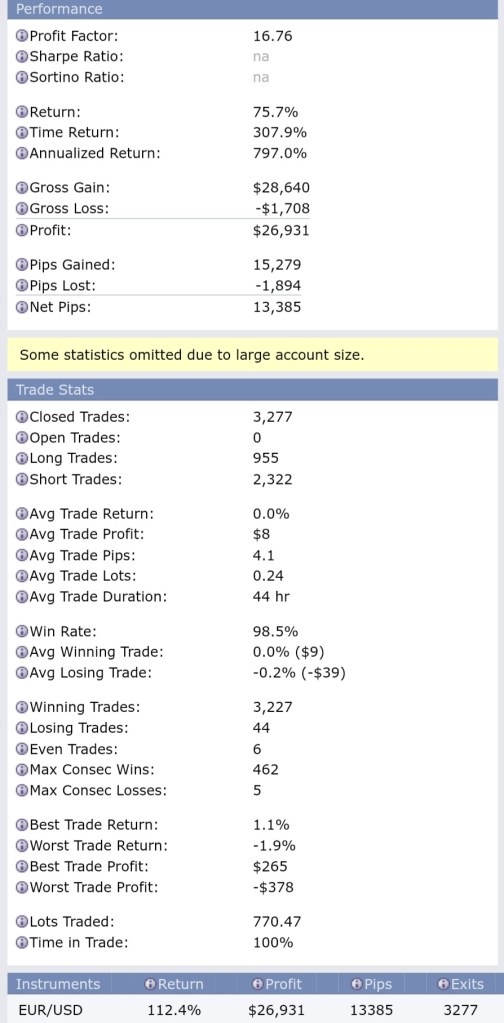
In comparison he came really close to my 55% performance for the same period, but fell way behind from the 35% profit factor. His aspiration for ruling in a chaos would ultimately result in weak performance
My points are: forward testing is the real thing. You do not make a break out routine and try it on different instruments, you make one with one particular instrument’s statistics in mind.
Throughout the years, I have come up with plenty of insightful things, many directional logic and somehow everything was revolving around catching a turn.
The Energy Bands (aka CI Moat Dynamic) have remained unchanged for a decade already.
I have chart tabs that I never really click on anymore, with amazing accuracy to this day.
If I come across one of these, I have to seriously think about what I meant by -say- “Q” or Silvergate. U-67L, that at least refers to a moving average. Knowing myself, it is an EMA made of Lows. There’s some serious Ira Epstein influence here for plotting the window Envelope’s location. RSI 14 – at least not on closing prices, but medians. I could not have made a compromise beyond keeping up my own identity. All plots were made by the RSI_BB routine, both below and above.
Yet, nothing I believe was such a smart move as starting to concentrate on getting signals out of the oppressed volatility side.
The gray divergence (hard to spot) prompts a pullback of 88+ pips from the peak, which would put the price just beyond the S2. The horizontal lines are always puzzling as well, did I place them at a first close back inside the 30-sample BB, or did I use a completely different method? Lines don’t talk, they are just there.
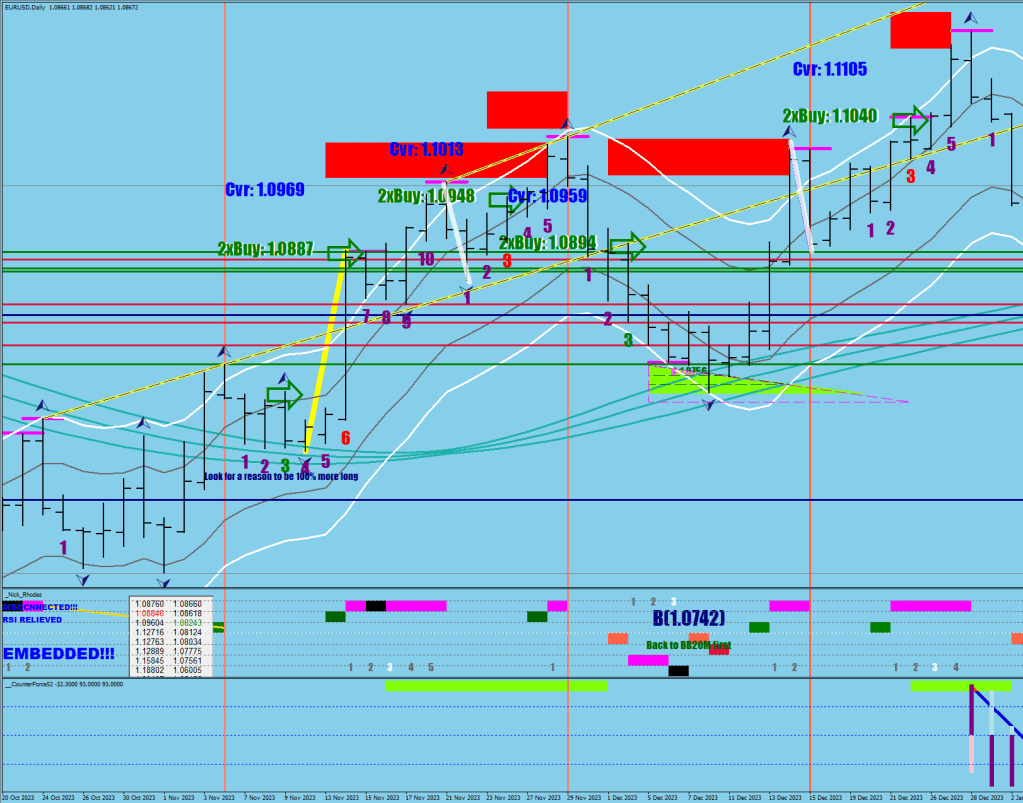
A recent find is the difference between a liquidity break and a decisive move. The yellow diagonal represents a decisive move up (pick of new direction) for it is coming off of an 8-sample higher low, not a lower low. The white marker shows an 88-pip pullback.
////looking for liquidity breaks "/\"
if (i>2 && Low[i]<Low[i+1] && Low[i]<Low[i+3] && Low[i]<Low[i-1])
{
  j=i-2;
  if (iHigh(symbol,0,iHighest(symbol,0,MODE_HIGH,2,j))-Low[i]>930*Point  && High[j-1]<High[j]){
         ObjectCreate("Liquidityx"+i,OBJ_TREND,0,Time[i],Low[i],Time[iHighest(symbol,0,MODE_HIGH,2,j)],iHigh(symbol,0,iHighest(symbol,0,MODE_HIGH,2,j)));
         ObjectSetInteger(0,"Liquidityx"+i,OBJPROP_RAY_RIGHT,false);
         if (Low[i]==iLow(symbol,0,iLowest(symbol,0,MODE_LOW,7,i))) ObjectSet("Liquidityx"+i,OBJPROP_COLOR,clrMediumSlateBlue);
         else ObjectSet("Liquidityx"+i,OBJPROP_COLOR,clrYellow);
         ObjectSet("Liquidityx"+i,OBJPROP_WIDTH,9);
         ObjectSet("Liquidityx"+i,OBJPROP_BACK,1);
I have propped up Nick Rhodes with a ridiculous amount of smarts. Statistics is the key, always and forever for understanding the possibilities. I am expecting an 88-pip pullback to close out the search for the guns followed by another launch of a search party for ammo. A final high could be a couple of weeks out.
The two white pullbacks were 112 and 120 pips – there is a rhyme, a symmetry there. A correction would go to the bow-bow back & that’s all I’ve got to say.
How this plot can be used to determine the age / current state of the swing?
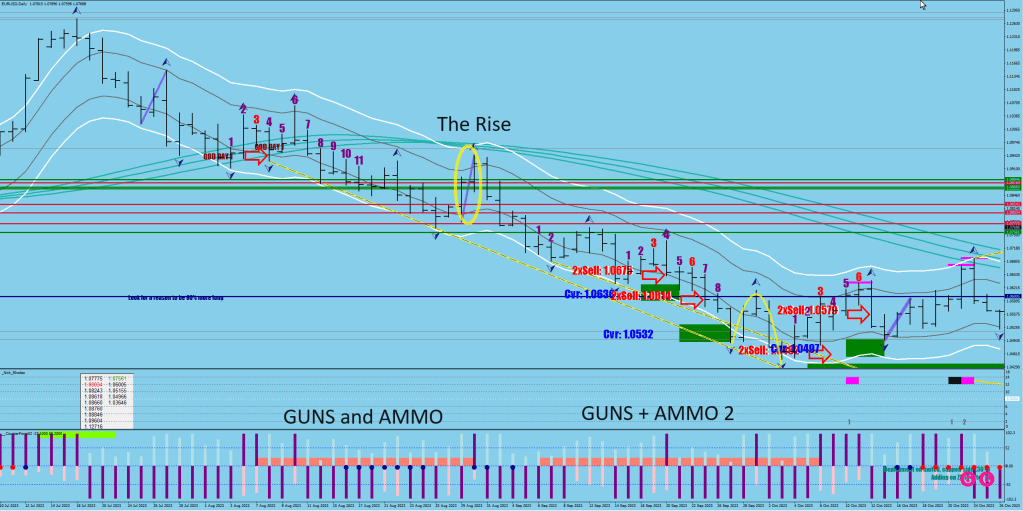
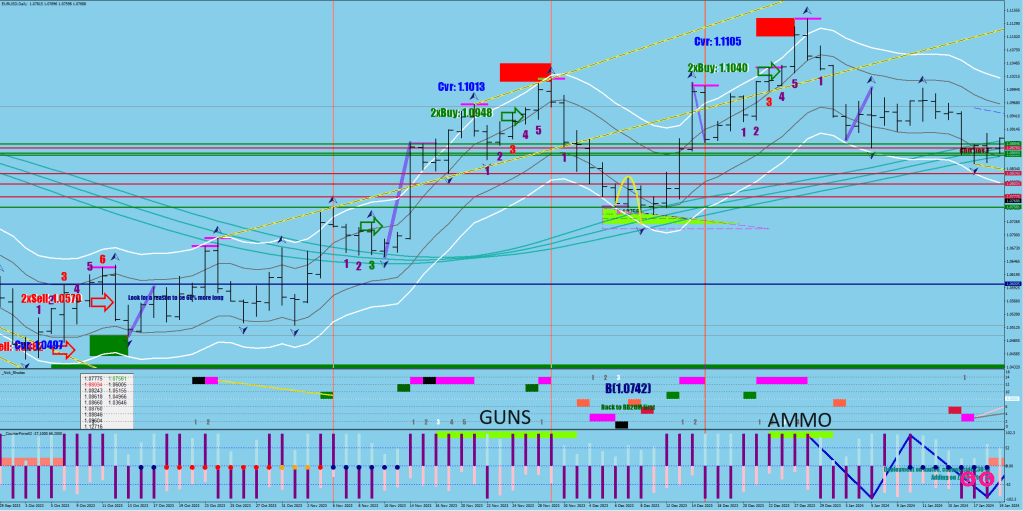
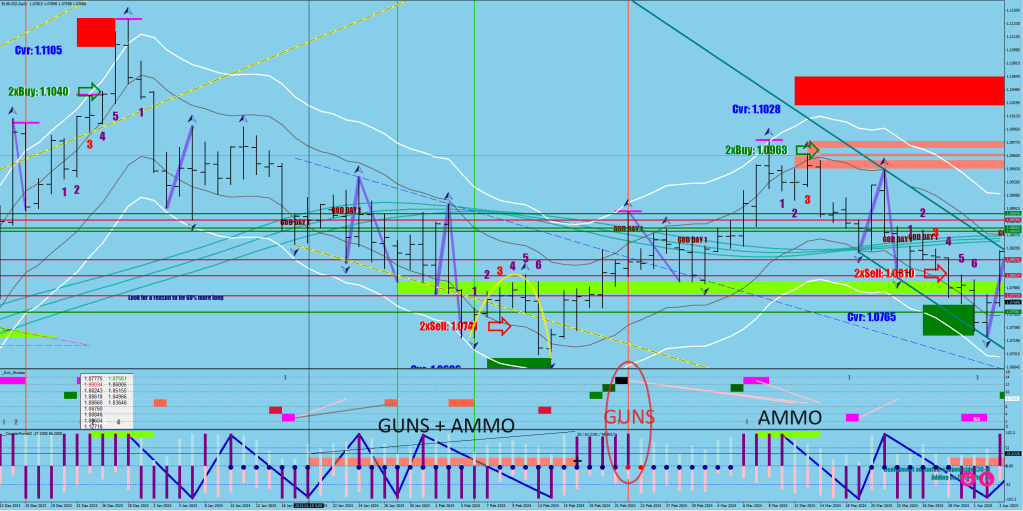
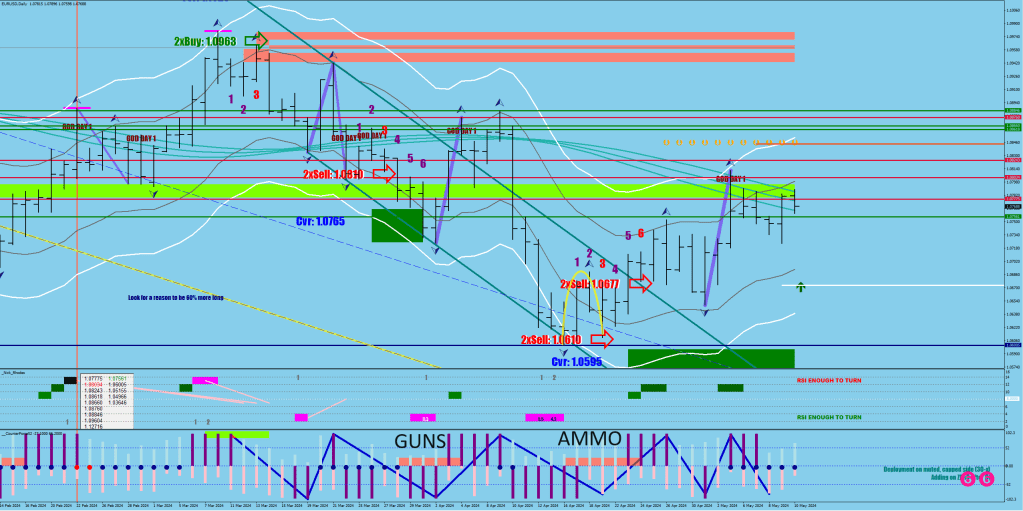
As the thesis goes, you need guns and ammo.
The first block is marking up the location of the guns found.
If the search goes on for 10 or more days, you may have some ammo found too.
Examples.
The first image shows a 10-day stretch
Pay attention to the bow back that takes place in 6 days or less.
The second example is a Guns + Ammo 16-day search with a bow-back tail.
Of course, the Guns and Ammo blocks are completely separate.
Now we throw liquidity break in the mix. You don’t want to see a lack of buying / a quick lift after a phase of embedding.
The next one had a deeper pullback in between with a 2-day bow back.
The followin is clearly a G+A with a 6-day bow back at the end.
The above has my one single example where Guns were found without Embedding. The combination of the strong squeeze (red ball on the histogram) and a black print (a slip with an extra high RSI2 print).
////upside black in the magenta sequence
   else if (RSI2[i]>96 && High[i+1]<High[i+2]){
         score[i]=3;
Two things about the last one. The G+A down is clearly visible with the 3-day Bow. Yet, on the upside…
…there hasn’t even been a Guns print yet.
Nostalgia: I called the divergences Guns and Ammo already back in 2021
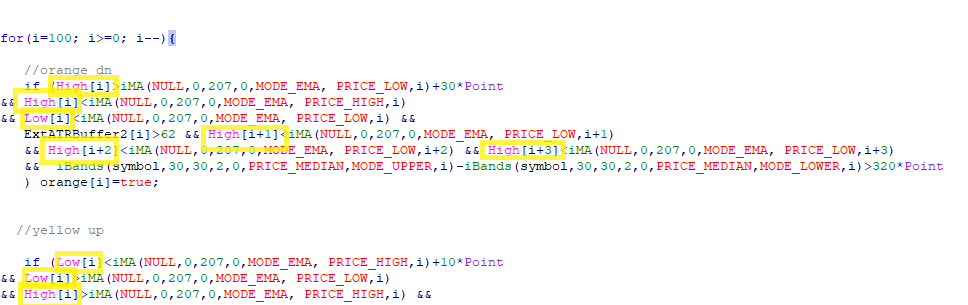
With auto trading, you better know if a routine is timeframe sensitive, and if yes, which one should it be pegged on?
The yellow highlights show timeframe-sensitive data references. These would come back with different values on every timeframe.
It is possible to make a routine timeframe independent in MQL4 by using for instance iLow(symbol, timeframe, location) instead of Low[i].
The point here is that I made a mistake by writing the routine for 30 minutes and then putting it on 1 -hour.
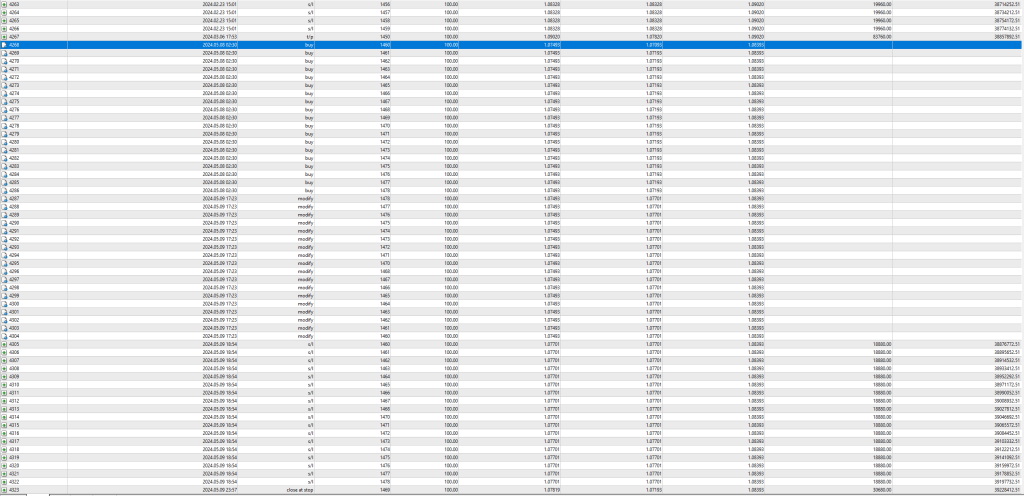
The second long’s 7-candle delay (3.5 hours) became 7 hours, therefore the Municipal Trader opened a long almost at the very end of the move. Amateur hour. Es okay, closed it out in profits and had a reasonably good Friday, since Fridays tend to be about pegging.
I think the yellow aero plane may get a tag in the low 1.075x.
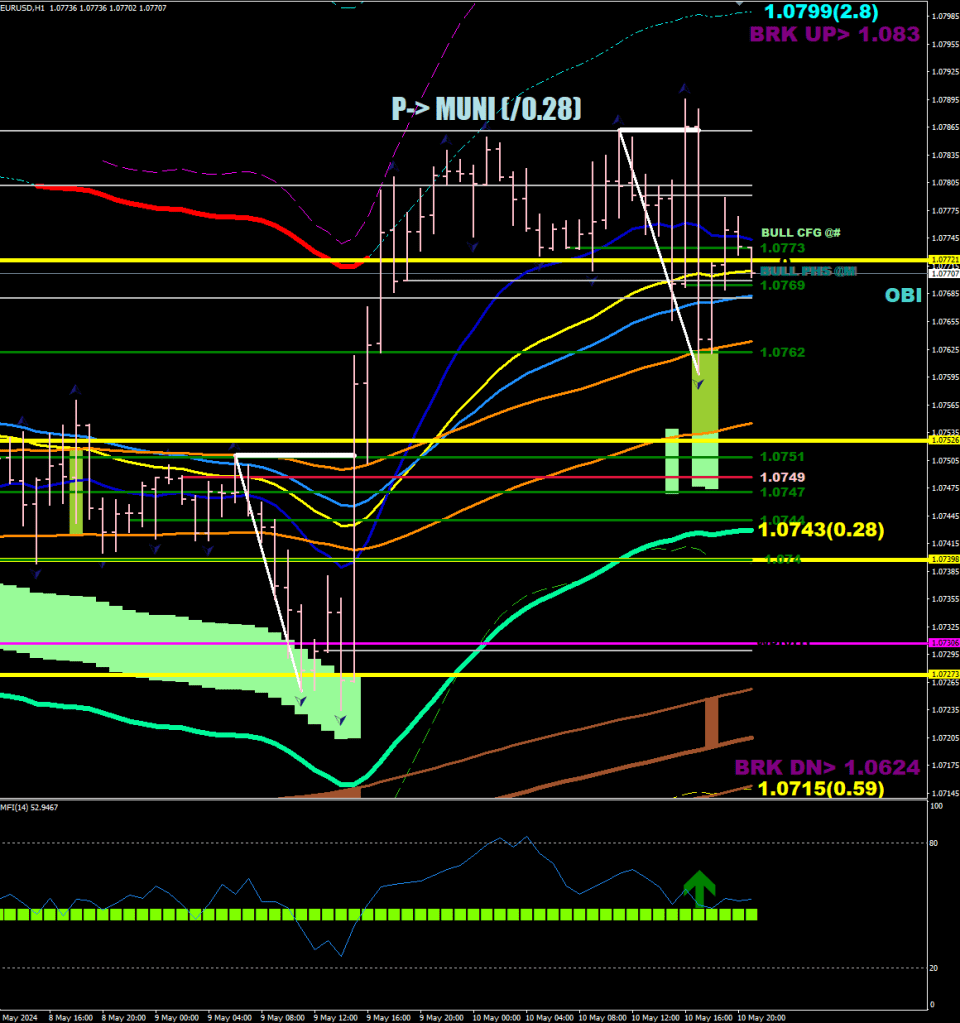
The municipal trader would have opened 2 days ago at 1.0749, and then would have stopped out at the trail at 1.0770 a day later.
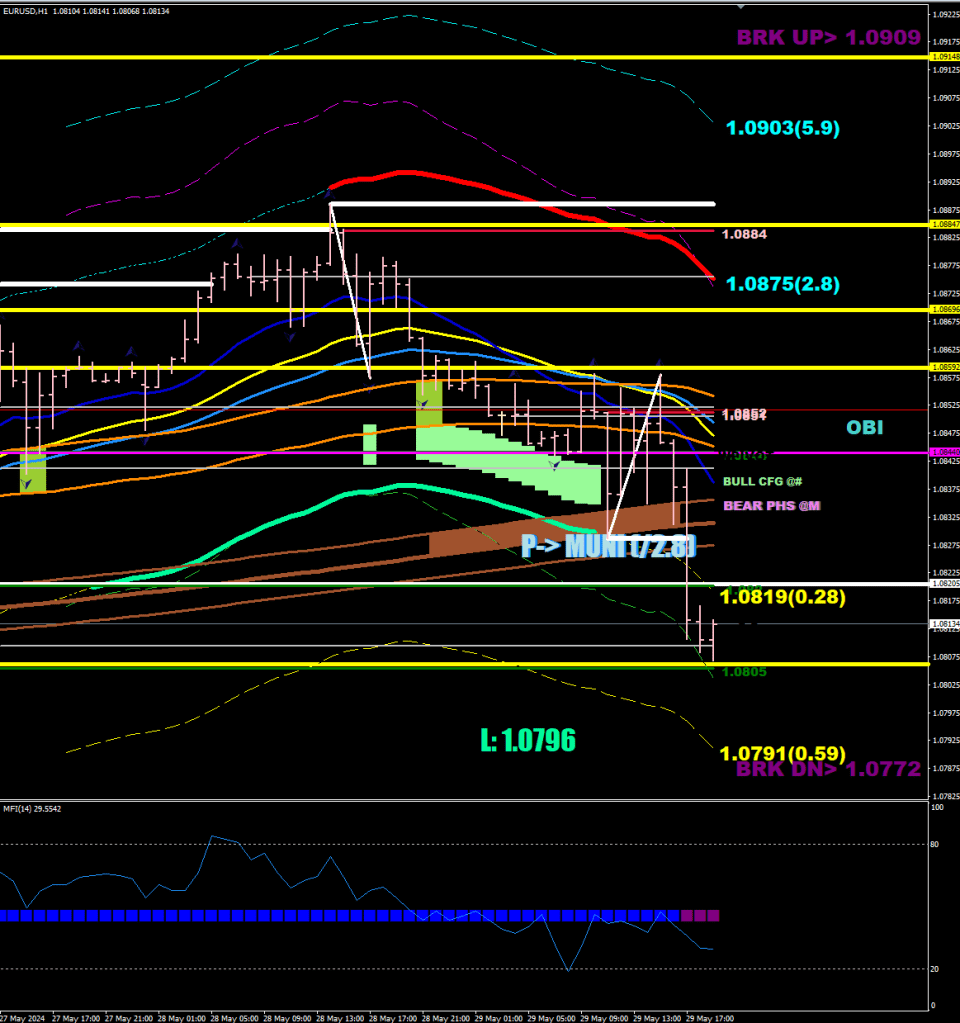
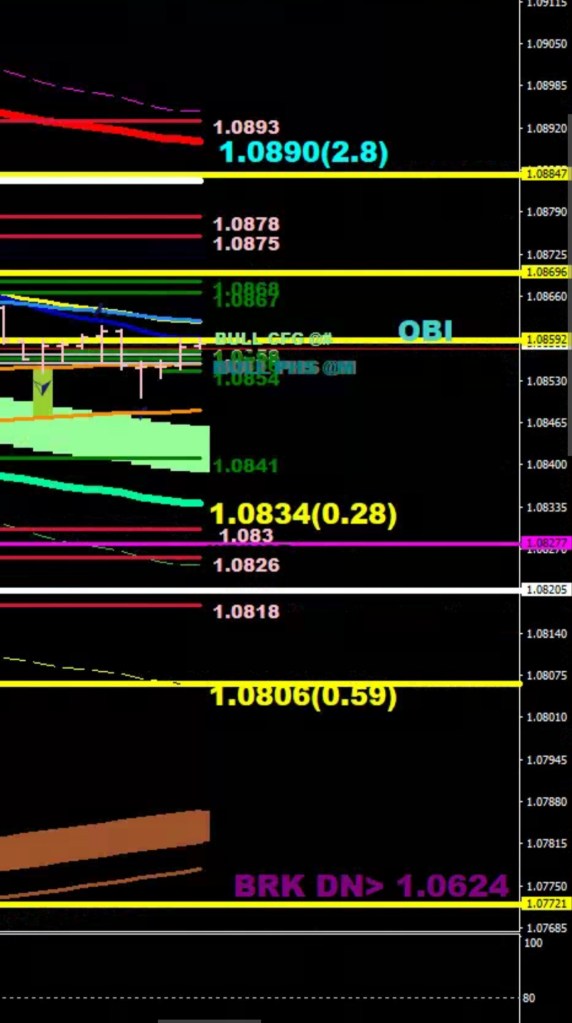
I’ll be scaling back into longs, there is nothing bearish here still. Price may not get to the 0.28 safety line.
I think a 2.8x stretch would be a minimum on the upside before a top.
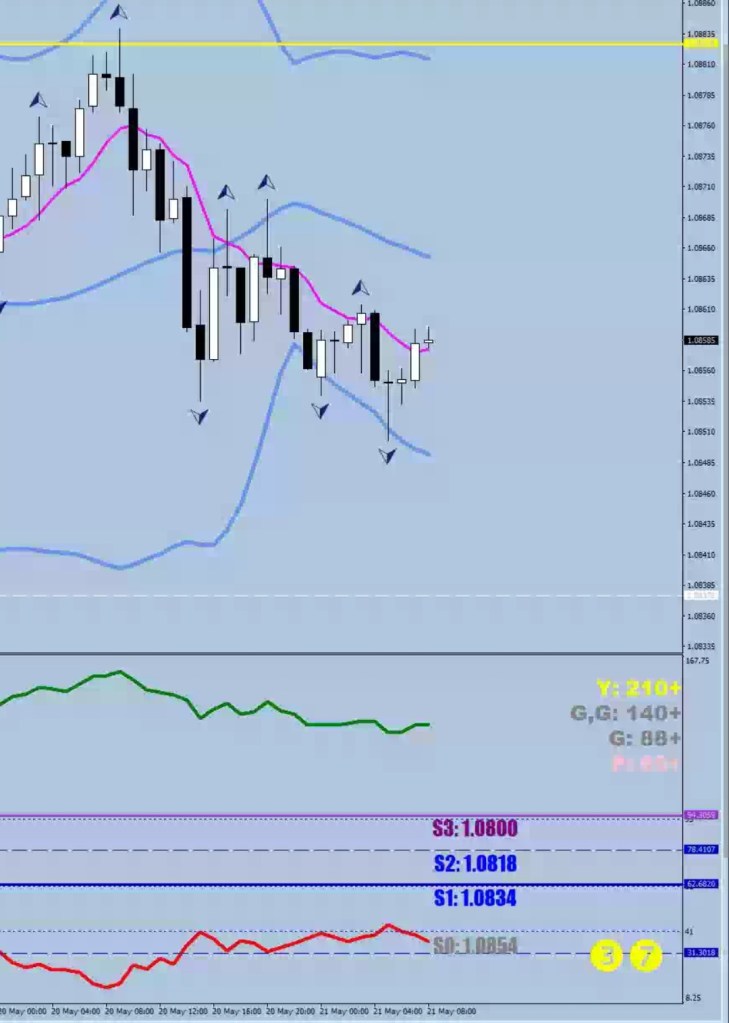
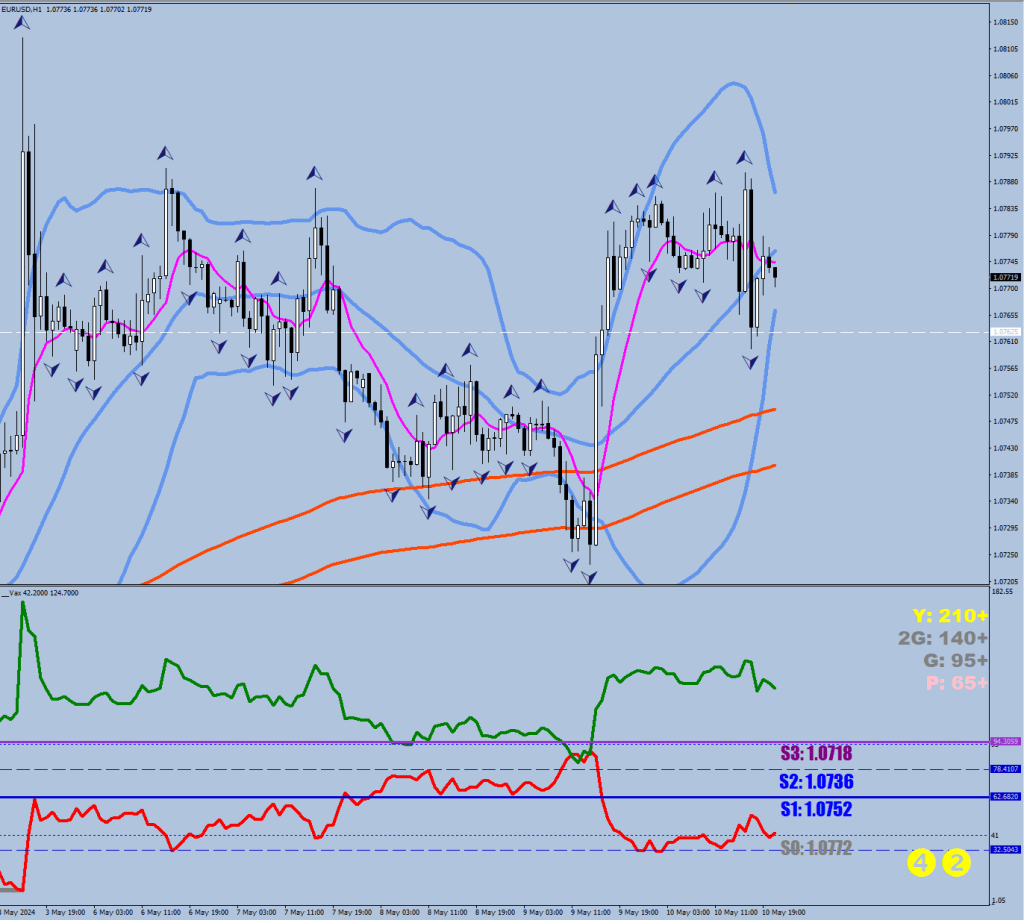
S1 is at 1.0752
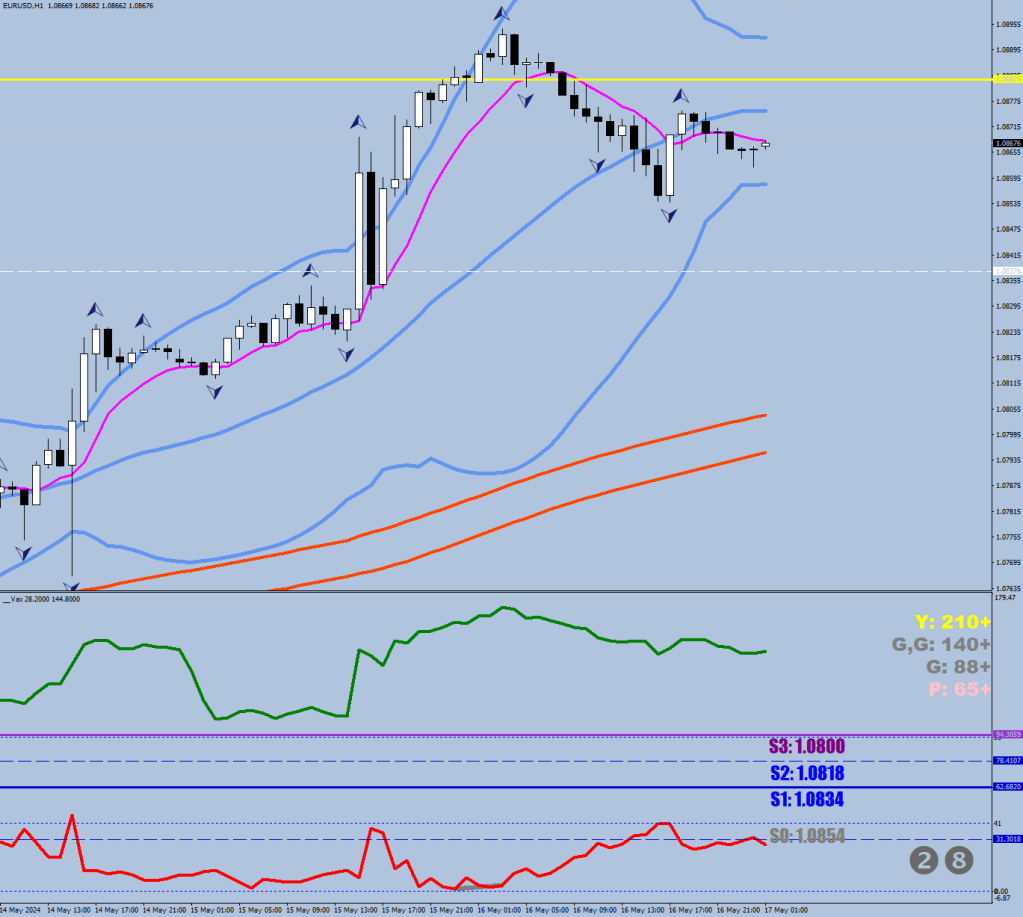
As it seems, the high would be between 1.0830 and 1.0860.
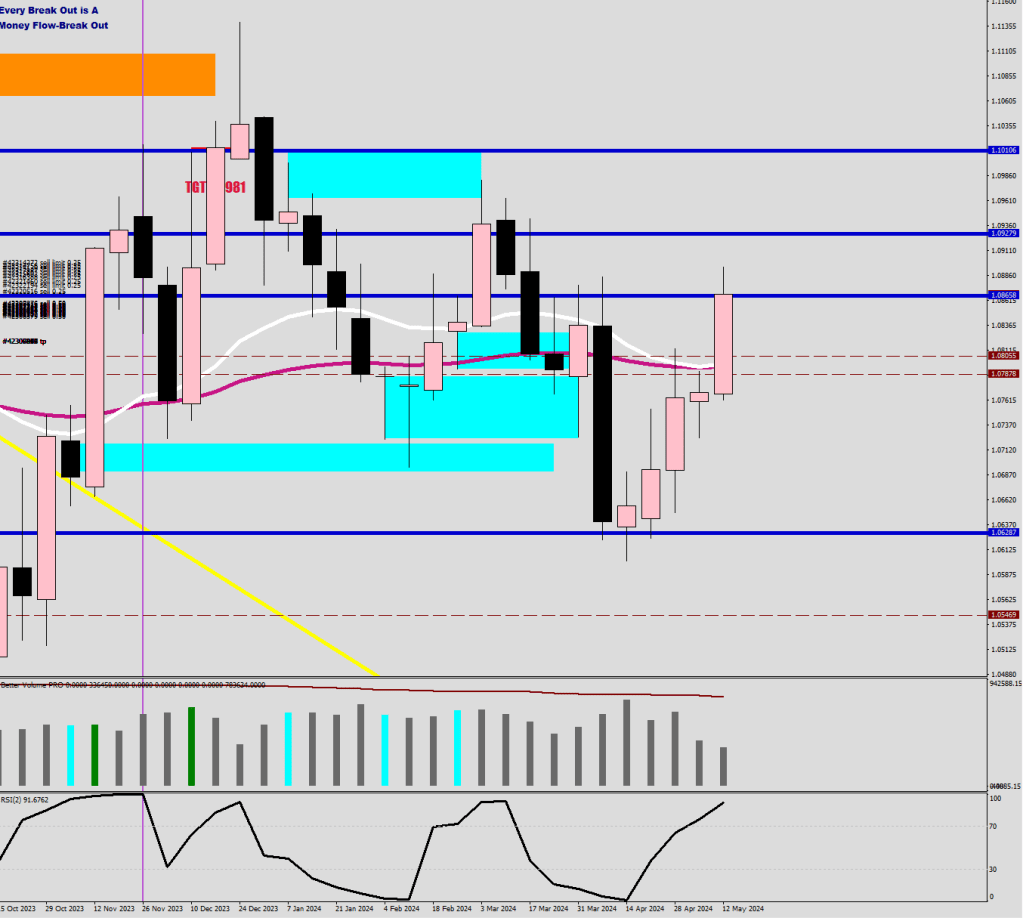
Important daily levels are 1.08618 and 1.0866. Also, no top gets made with the Bollinger squeeze-on (blue balls).



















 ForexFore - Internals, indicators, algorithmic trading