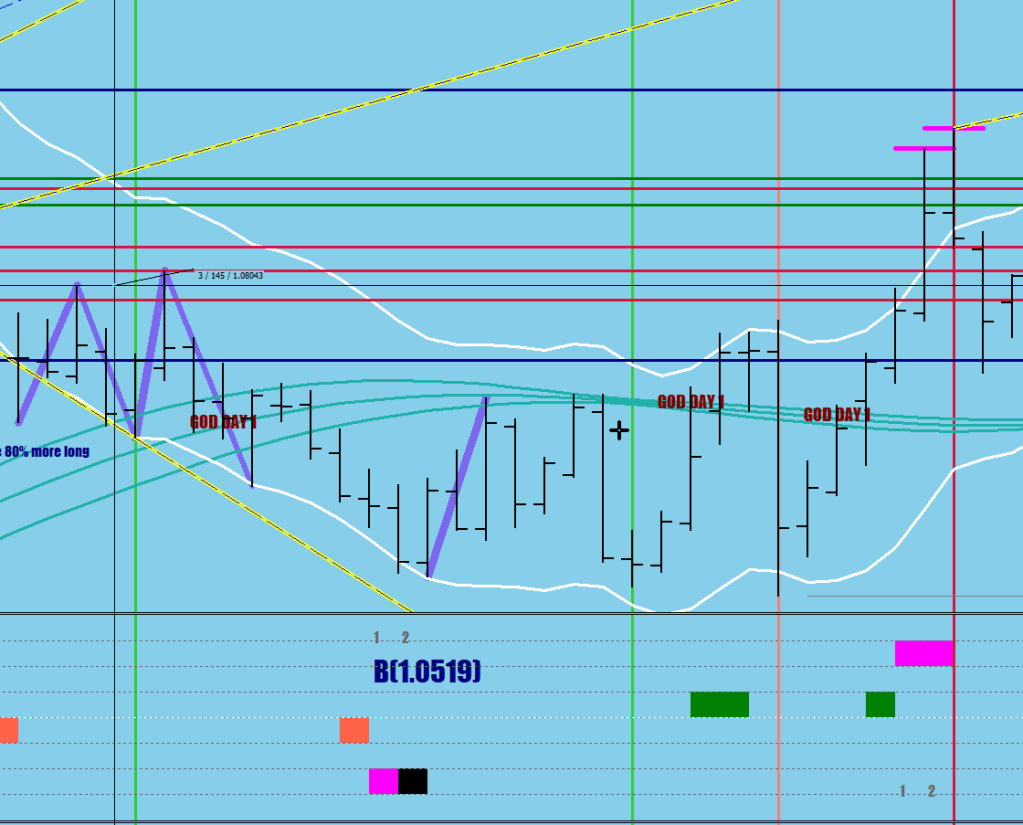
What happens when evrn the gray volatility box gets exceeded?
Well, the above image shows already the divergent leg, but there was an even larger beat with the first, measuring leg. Below are the two locations where CI went fishing barring from a consolidation.
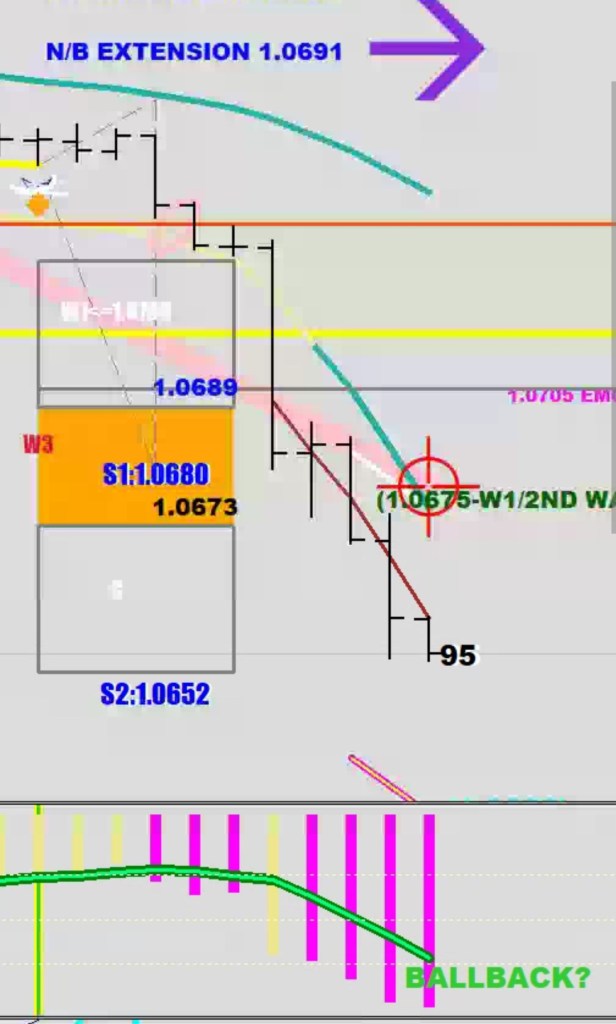
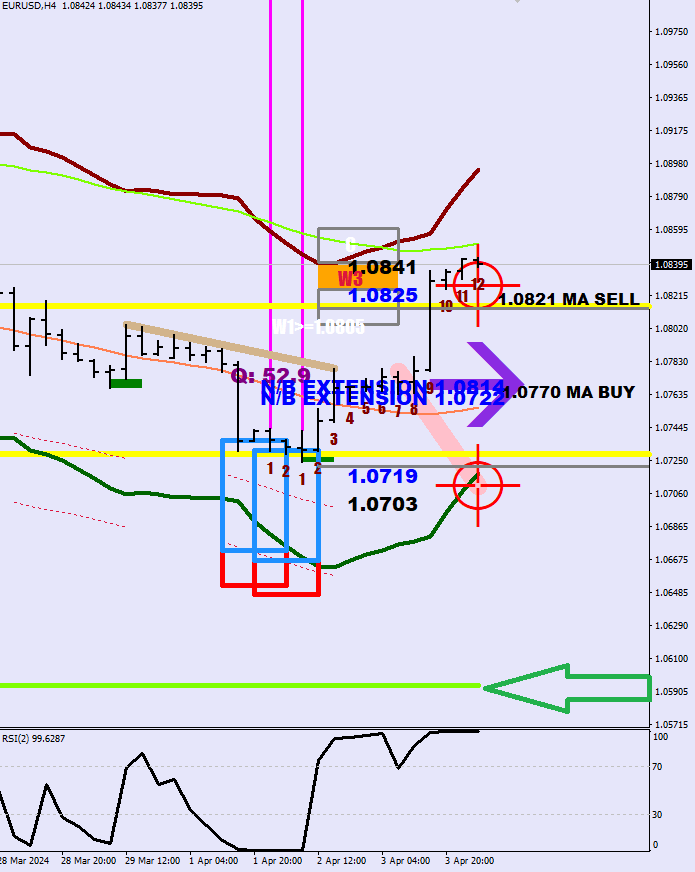
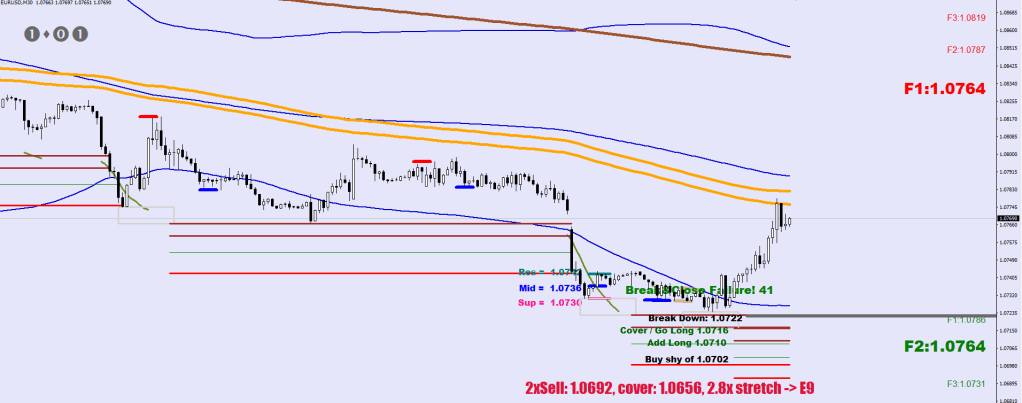
The reversal divergence is setting up using the distance from the last consolidation mean, and my ruler is there to help.
The start of the gray box is the 3-day ATR times 1.3, the end of the box is 20 pips lower.
Between the two legs there was a crack 4 (F1 pullback), so I would expect the next break to achieve a crack 5 (F2 – 62 pips up from the nrw swing low) at a minimum, arrow again. S2 would hold by the close.
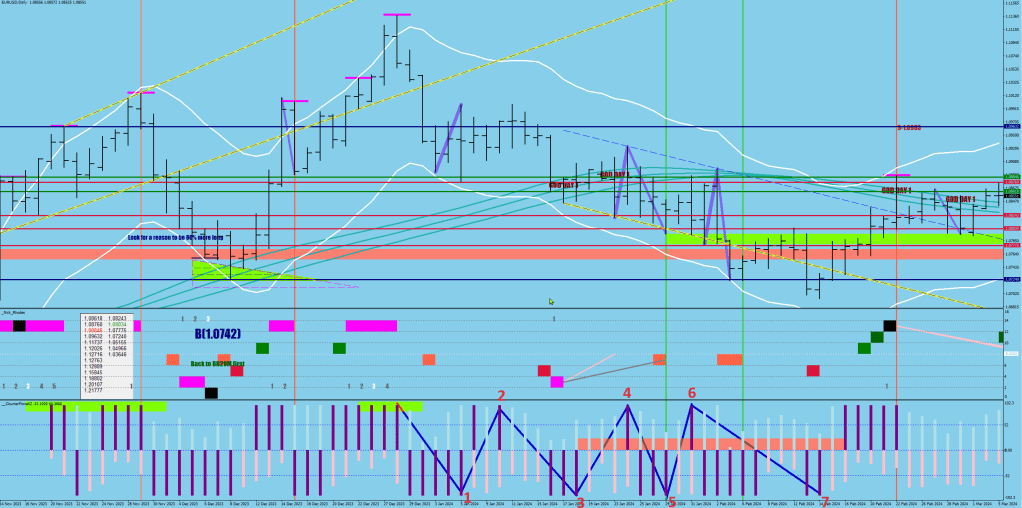
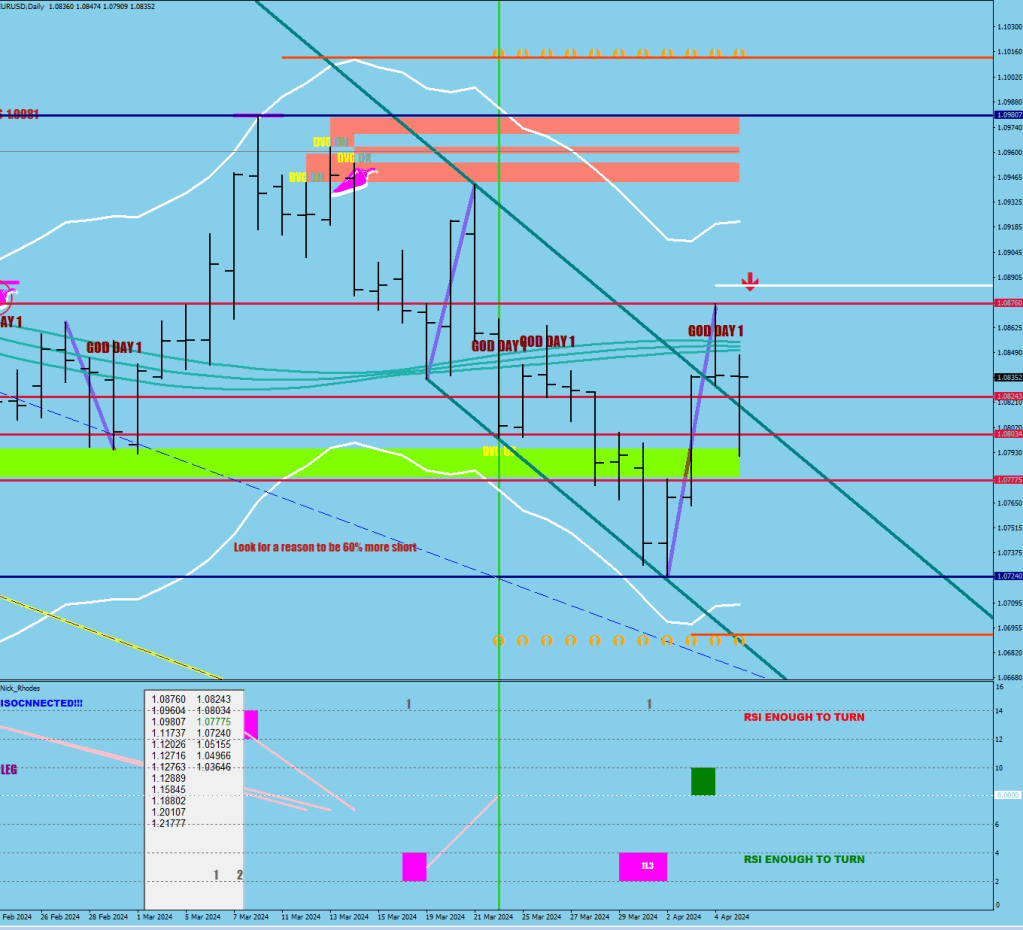
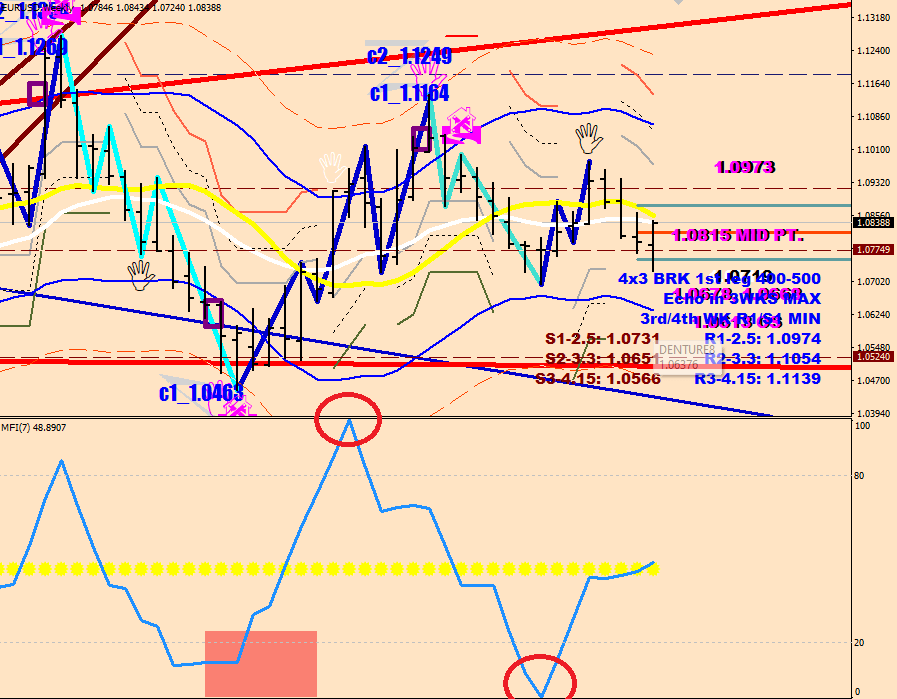
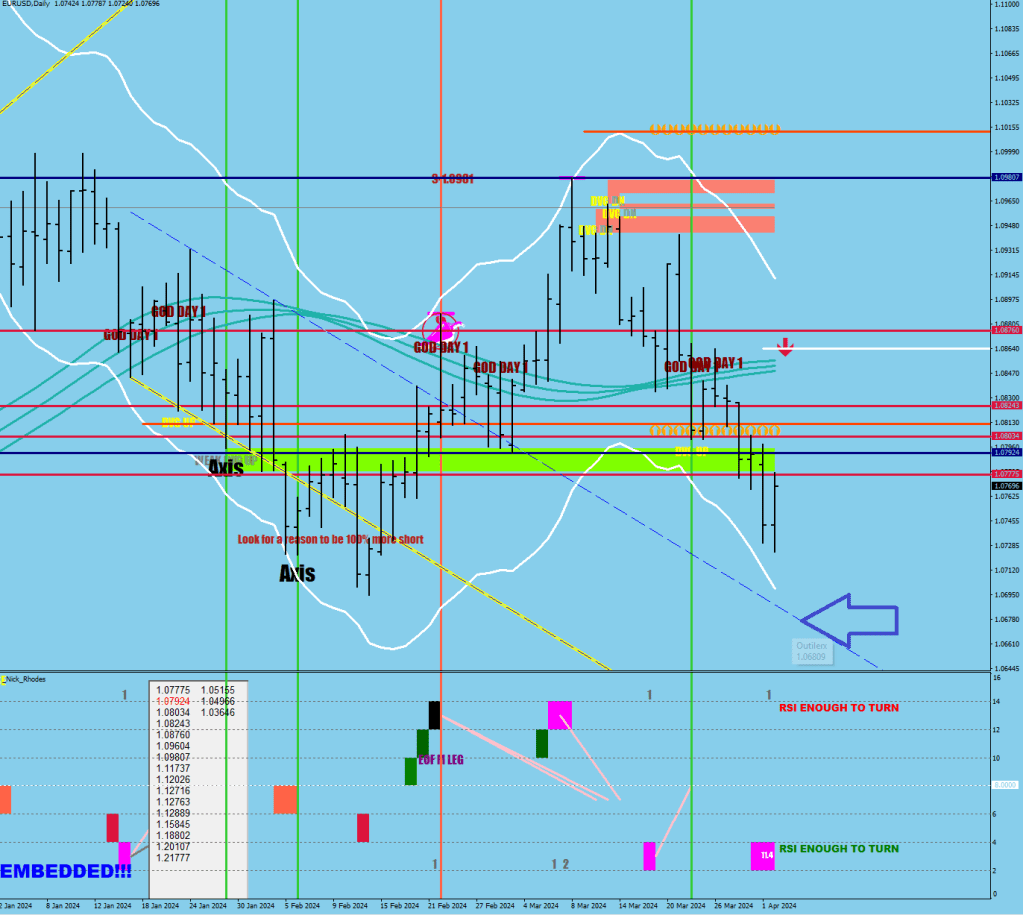
CF52 has lost its original identity, so I got to repurpose it for wave tracking for the daily chart.
You know, as E.W. always talks about the 6th and the 7th wave for a impulse move. Just kidding, never does that.
In the previous example when a liquidity break’s TO leg was violated / topped, it was by 14 pips or so (for futrure stop loss displacement).
Today’s beat was 8 pips or so.
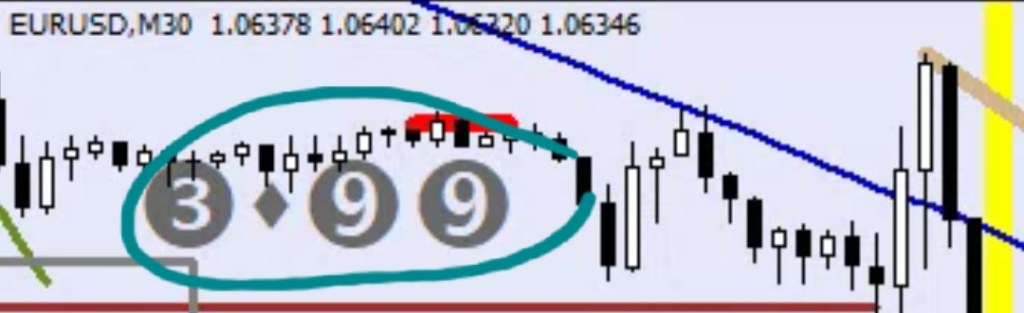
I think you will see 3 Fs on the downside next. Why? Because the up move has zero-ed the counter (I have a way to check this).
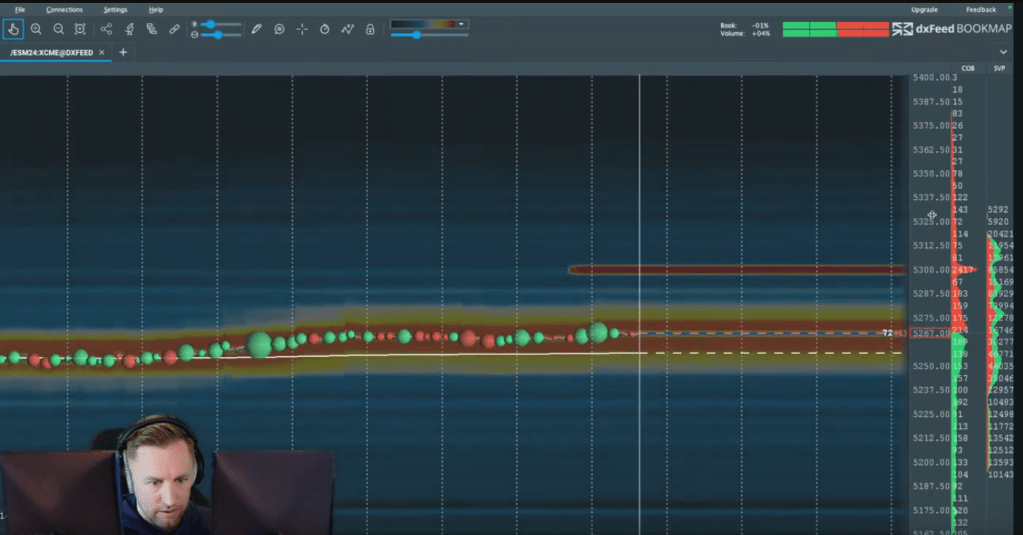
I don’t know what to say about Michael Silva’s bookmap 5300 calls gathering SPX print, other than that the Dollar is set to rally, and SPX may or may not decide to pay these people.
Curious what that wave structure up was? Here it is in red. An ABC. A correction. Does that help a little with the direction of progression?
Let’s mark up first the To legs with a thick line. They must exceed 93 pips in length.
What can be said about the From legs? They engulf the entire To trip and do so within 2 days.
////looking for liquidity breaks "/\"
if (i>2 && Low[i]<Low[i+1] && Low[i]<Low[i+3] && Low[i]<Low[i-1])
{
  j=i-2;
  if (iHigh(symbol,0,iHighest(symbol,0,MODE_HIGH,2,j))-Low[i]>930*Point  && High[j-1]<High[j]){
         ObjectCreate("Liquidityx"+i,OBJ_TREND,0,Time[i],Low[i],Time[iHighest(symbol,0,MODE_HIGH,2,j)],iHigh(symbol,0,iHighest(symbol,0,MODE_HIGH,2,j)));
         ObjectSetInteger(0,"Liquidityx"+i,OBJPROP_RAY_RIGHT,false);
         ObjectSet("Liquidityx"+i,OBJPROP_COLOR,clrMediumSlateBlue);
         ObjectSet("Liquidityx"+i,OBJPROP_WIDTH,9);
         ObjectSet("Liquidityx"+i,OBJPROP_BACK,1);


   if ((j>=1 && Low[j-1]==iLow(symbol,0,iLowest(symbol,0,MODE_LOW,5,j-1))) || (j>=2 && Low[j-2]==iLow(symbol,0,iLowest(symbol,0,MODE_LOW,5,j-2)))){
     if (j>=1) k=j-1;
         if (Low[k+1]<Low[i]) ObjectCreate("Liquidityy"+j,OBJ_TREND,0,Time[iHighest(symbol,0,MODE_HIGH,2,j)],iHigh(symbol,0,iHighest(symbol,0,MODE_HIGH,2,j)),Time[iLowest(symbol,0,MODE_LOW,2,k+1)],iLow(symbol,0,iLowest(symbol,0,MODE_LOW,5,k)));
         else ObjectCreate("Liquidityy"+j,OBJ_TREND,0,Time[iHighest(symbol,0,MODE_HIGH,2,j)],iHigh(symbol,0,iHighest(symbol,0,MODE_HIGH,2,j)),Time[iLowest(symbol,0,MODE_LOW,2,k)],iLow(symbol,0,iLowest(symbol,0,MODE_LOW,5,k)));
         ObjectSetInteger(0,"Liquidityy"+j,OBJPROP_RAY_RIGHT,false);
         ObjectSet("Liquidityy"+j,OBJPROP_COLOR,clrMediumSlateBlue);
         ObjectSet("Liquidityy"+j,OBJPROP_WIDTH,6);
         ObjectSet("Liquidityy"+j,OBJPROP_BACK,1);
         }

    }
}
What is the point of all this?
First of all, the liquidity break hammers out a swing point that is a safe shileld for a stop loss.
Normally a liquidity break is a refresher for the next leg down, a trap if you will. 3 of these and the low is uttely close (38 pips in the example above past the starting point of the last liqudity break).
At the same time, you know that the market is struggling to make headway if the breaks are overlapping. In the first example, after the second liquidity round trip, there was only an additional 27 pips left to be had on the downside from the low new lower low.
A bit surreal this place I’m working at. I tried to fetch a picture of the Horseshit the protesters brought in to the building the other day, without luck.
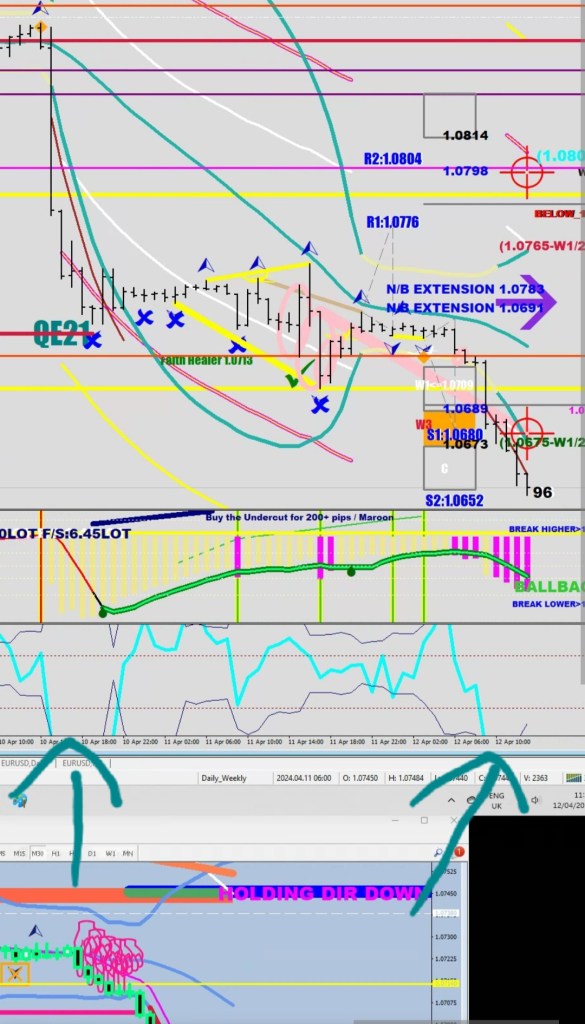
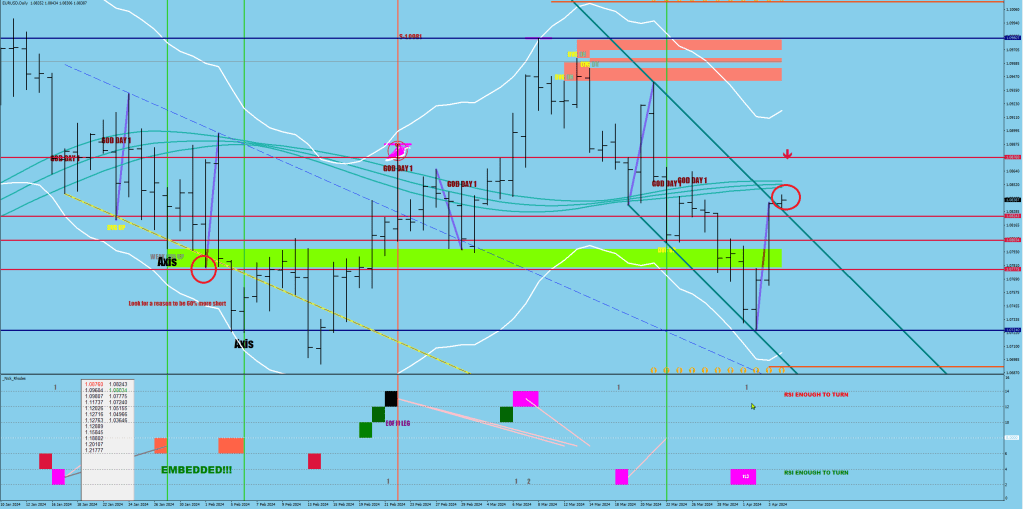
2 new signals added to the Axel S,
early bird special – white blocks (accumulation)
green arrow up: fresh violation onf the E-103M up
of course these fall under the “must hedge” reminders
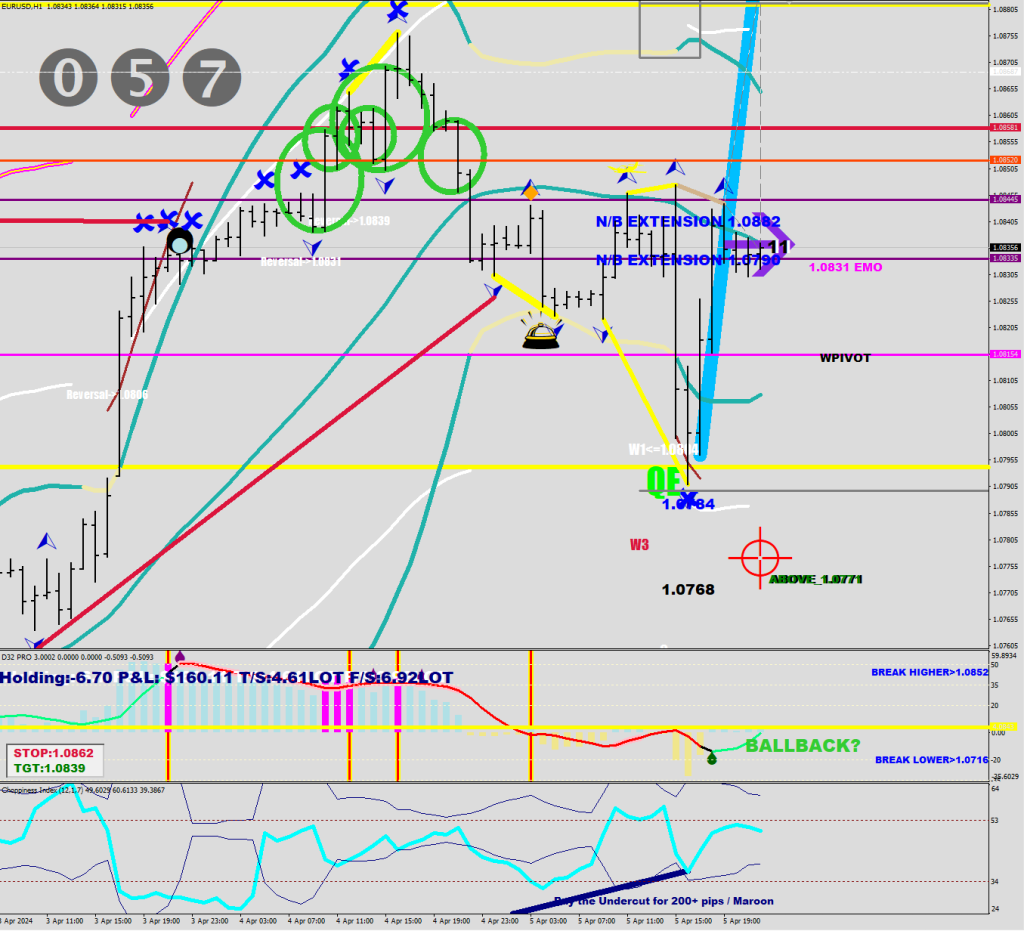
This is a liquidity break, no question about it. Volatility is on the rise.
There is a little bit of extra the 2nd time around (red circle) compared to the channel’s size. 120 pips would not be unusual.
It is always the one chart that you temporarily stopped paying attention to. 14x 4H of immunity.
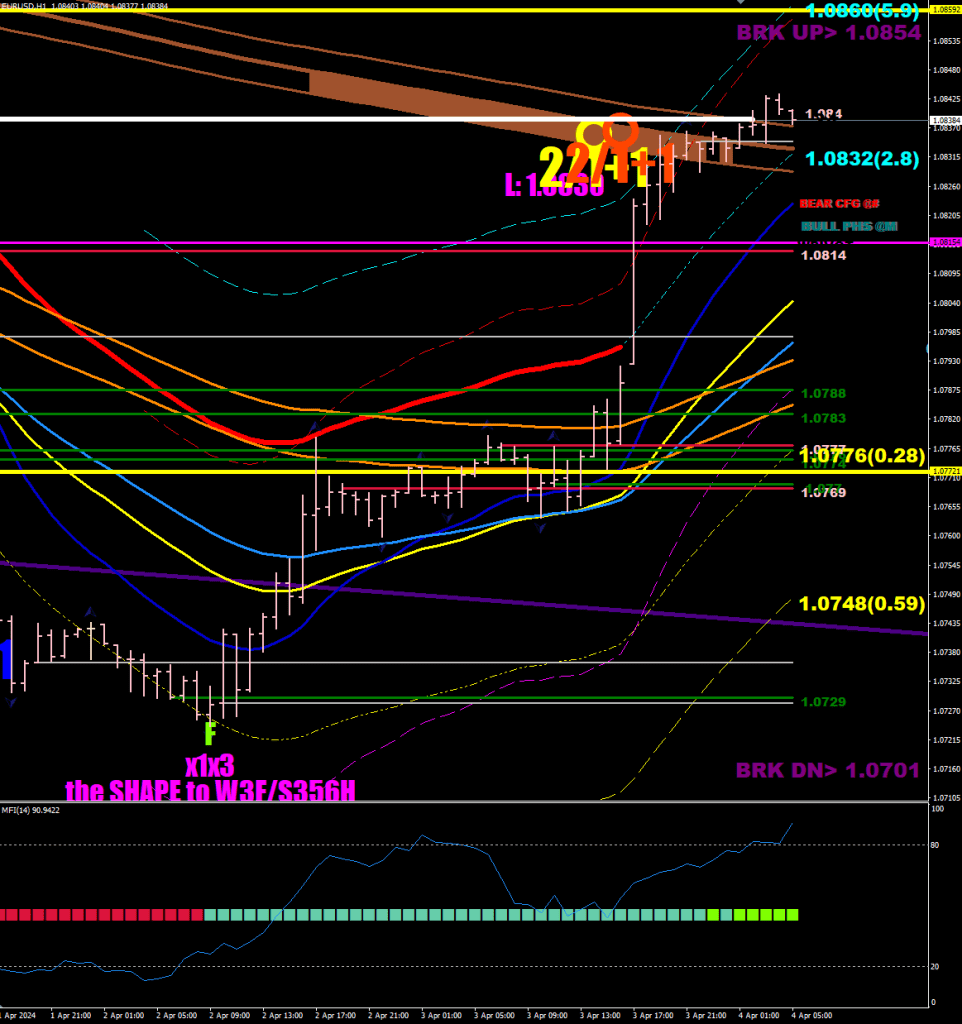
The bumper line is at 1.06. The box of the low therefore was not shaded. Another leg is coming to a shaded box.
The third x1 without a single x3 is still an x3, but made of three x1s, capiche?
The strong uptrend with this kind of velocity / ascent cannot stick.
The money flow extreme on the weekly cannot be the high / low. This is certain to go outside the Window Envelope (Blue Line). Coul see a 4x-4.5x stretch, and that would be still just regaining regular volatility.
It is good to know that someone can hold a candle to Morten Harket after all.
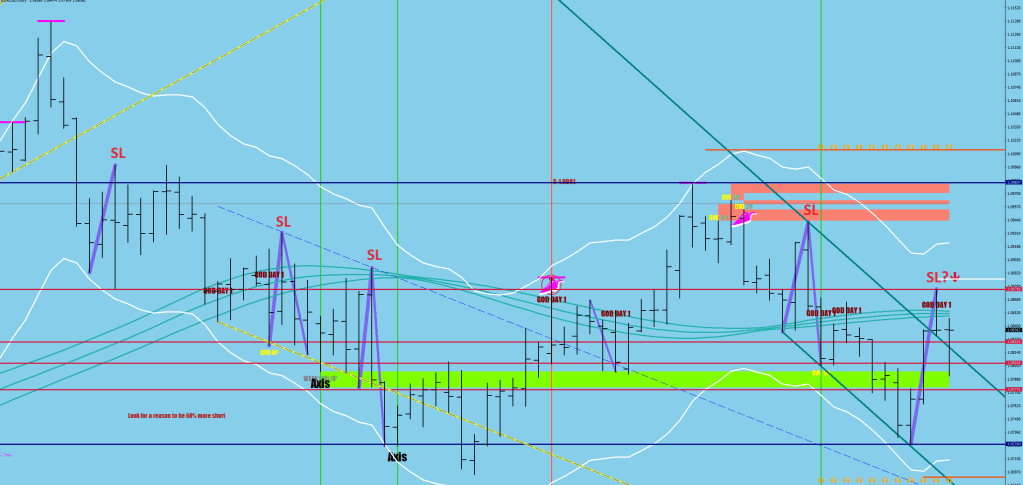
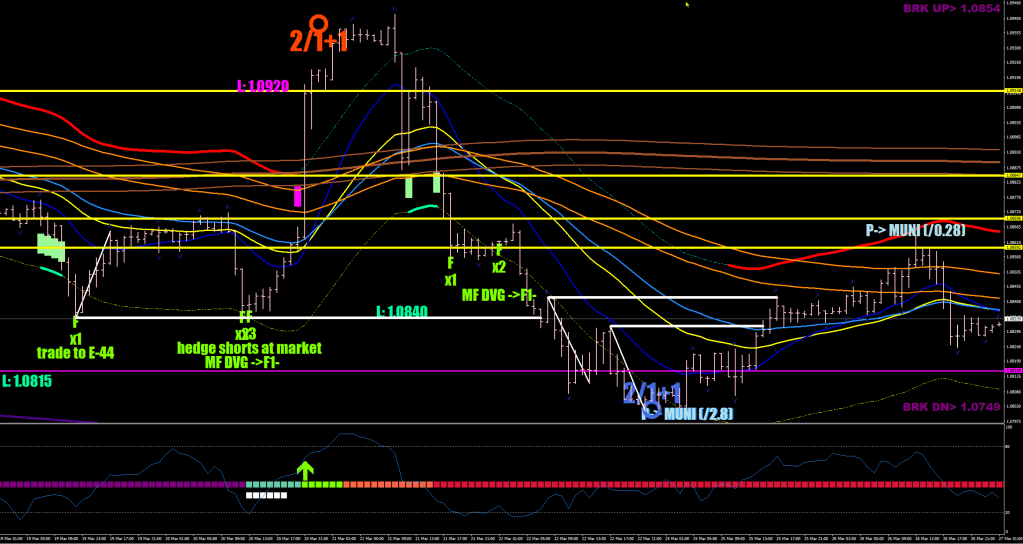
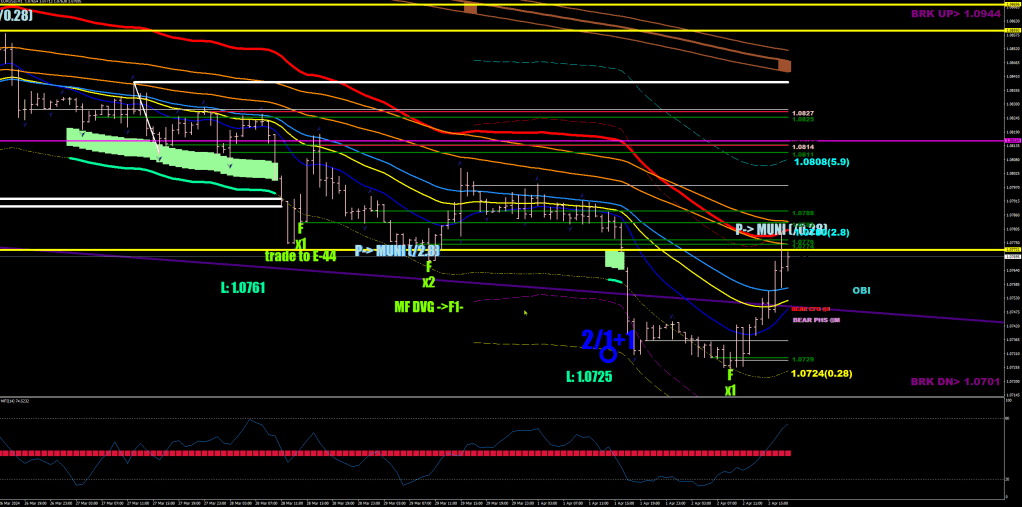
So, this was not the first Fx1, and I had no intel for it.
As you can see, once the lower Safety line was tripped, 1.0725 was a level of interest (statistical 34 pips extra). I should have been conscious of the upper Safety in glowing red asking for the ball.
I added the new intel trrough Google Remote Desktop. This new version sucks, and I try to avoid things requiring copy and paste.
   if (fd[i]==1 && (dir[i+1]>=0 || Low[i]>iMA(symbol,0,356,0,MODE_SMA,PRICE_MEDIAN,i) || Low[i+1]<E16[i+1]-380*Point || Low[i+2]<E16[i+2]-380*Point)){
                       ObjectCreate("Taller"+IntegerToString(i), OBJ_TEXT, 0, Time[i], Low[i]-90*Point);
                       ObjectSetText("Taller"+IntegerToString(i), "trade to E-44", 26, "Impact", Chartreuse);
                     }
                     else if (fd[i]==1) {
                         ObjectCreate("Taller"+IntegerToString(i), OBJ_TEXT, 0, Time[i], Low[i]-90*Point);
                       ObjectSetText("Taller"+IntegerToString(i), "trade to 2.8", 26, "Impact", Chartreuse);
                     }
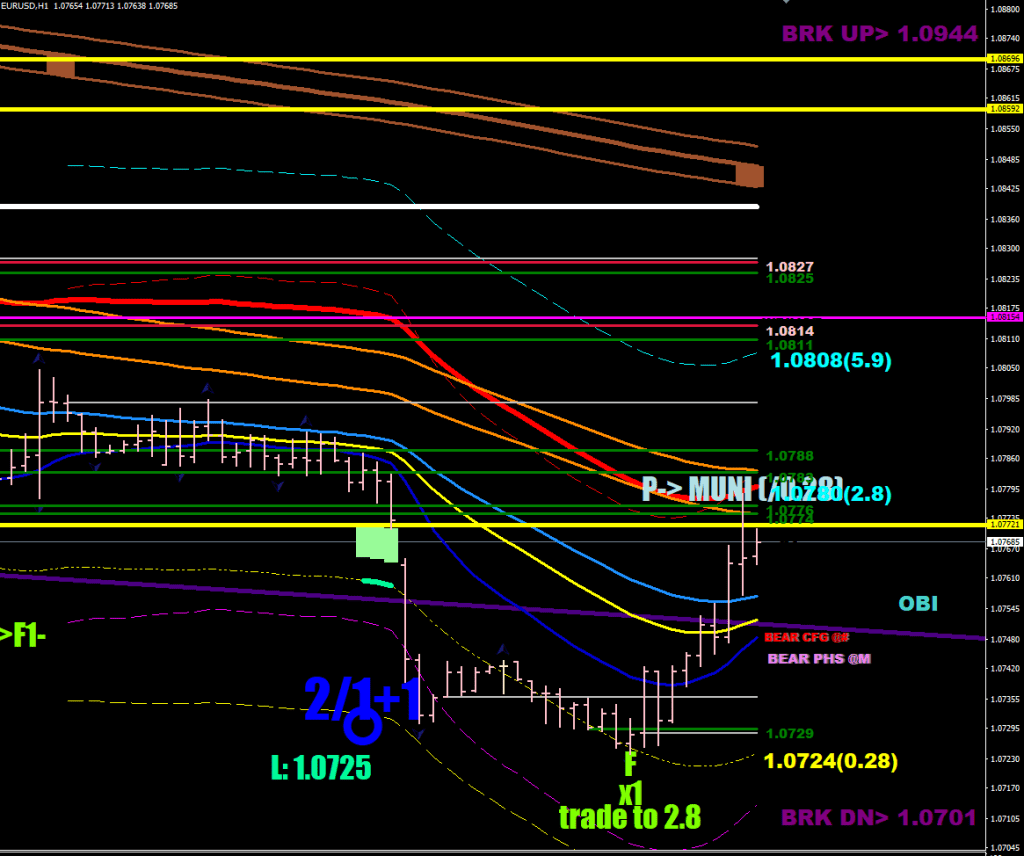
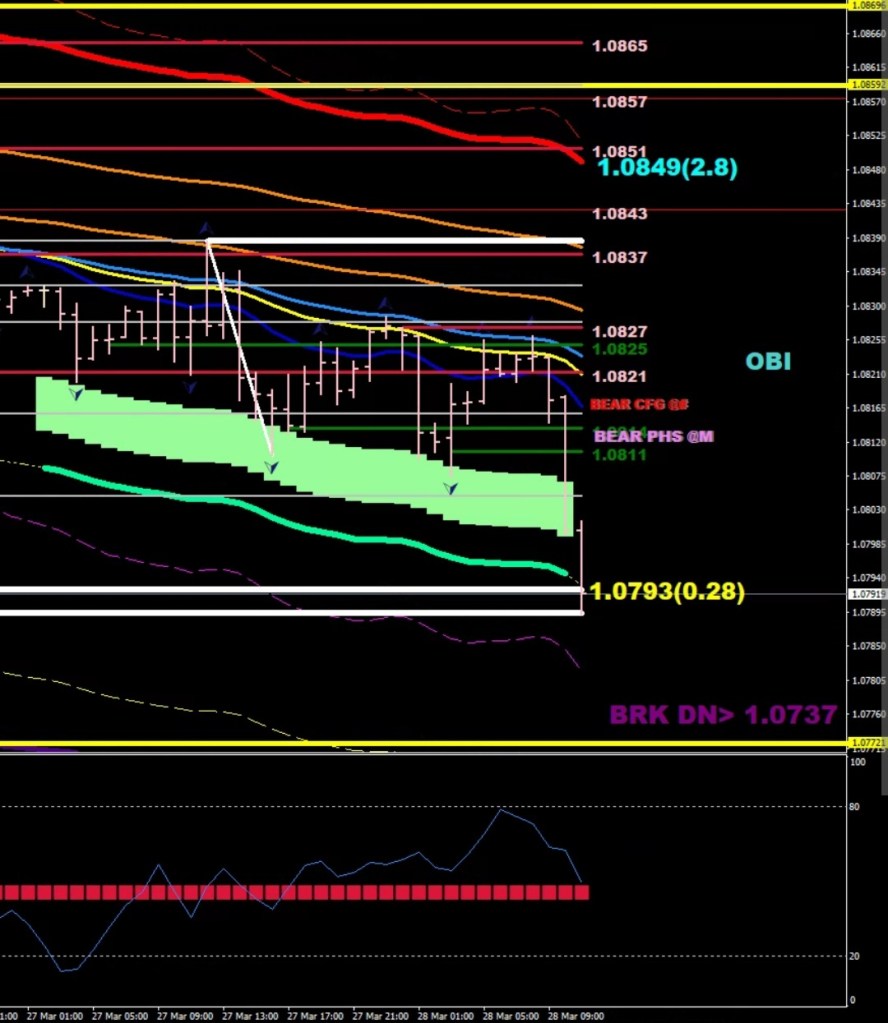
There should be more dowside to catch up with the white stretch line.
The 11.4 stochastic reading in the magenta box is white, not ideal. Between 8.5 and 4 it would be ideal for a turn.
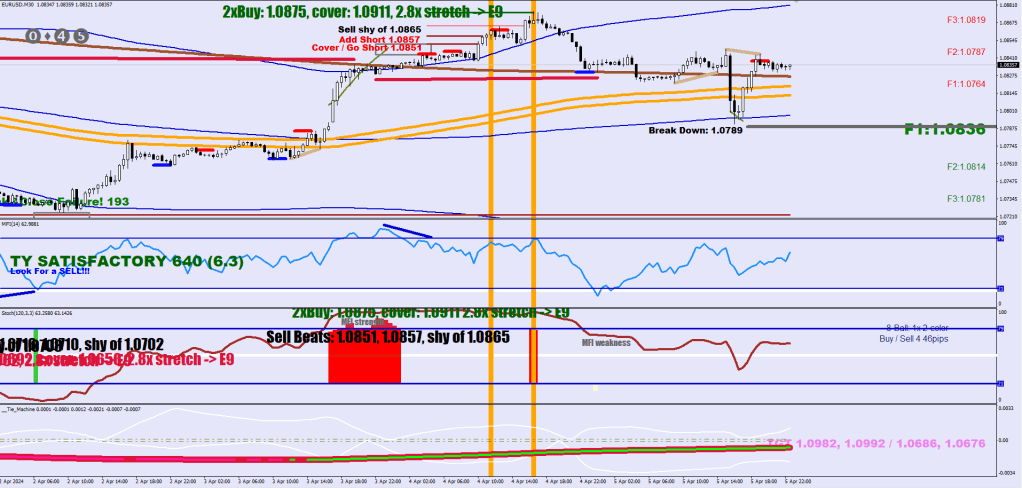
My hedge scale-in was ok, albeit I did end up ratcheting things higher.
I missed out on an opportunity to cash out the hedge into the doji above and then scale back in once more.
I auto-tageted the E-32, which was pessimistic. Should had auto targeted the Municipal Trench instead. Still made $1039 mostly with the hedge, that’s a 4.8% daily gain, close 5x my daily average of 0.9%.
I’m looking for x2 and x3 in the 1.0692-1.0656 zone.
René has finally given up on the FTMO scam, and is now trading for real. Way to go man!
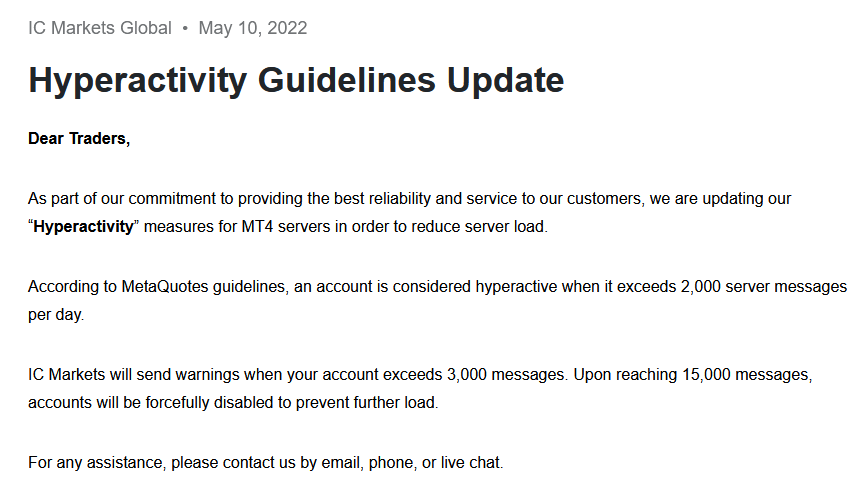
I used IC demos before until I got two Hyperactivity bans. Me, auto trading and IC Markets are incompatible.
Tryptophan or crypto fan?
Crypto is the biggest scam that humanity could come up with. Yep, Elon Musk is a weak second.
My coworker has a Coinbase account. I had him sell off his Etherium holdings near the peak two weeks ago. Until then he never sold anything.
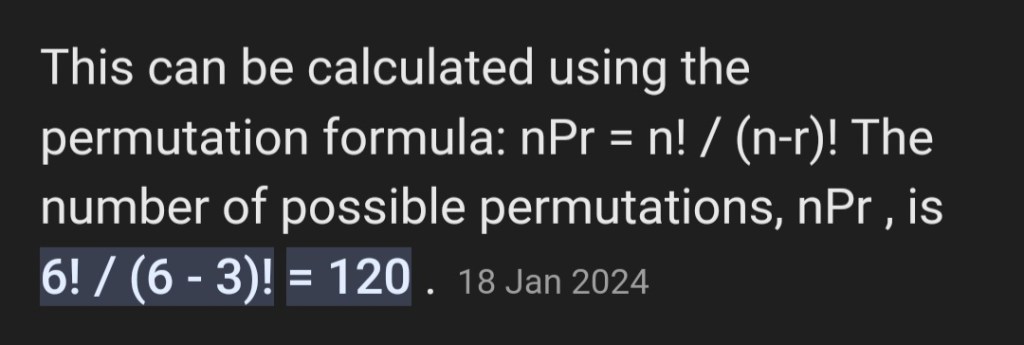
Last week he was suspended from trading due to new regulations. He was trying every possible combination to get through the questionnaire. I think it was 6 questions with 3 possible answers. I tried to help, but failed too. Imagine wanting to sell something and finding no control over your holdings!
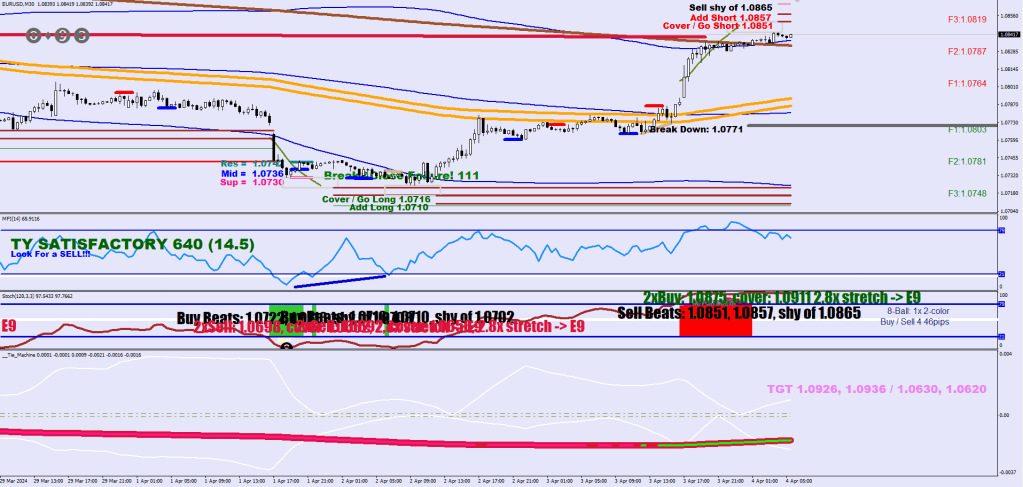
I have added two limiter lines to the Bands routine, 2.8x fluctuation maximum away from the mean.
 int FSize=32;
 double FMax = FSize*6/5;

  E9P[i]=iMA(symbol,0,9,0,MODE_EMA, PRICE_MEDIAN,i)+FMax*2.8*10*Point;
  E9M[i]=iMA(symbol,0,9,0,MODE_EMA, PRICE_MEDIAN,i)-FMax*2.8*10*Point;
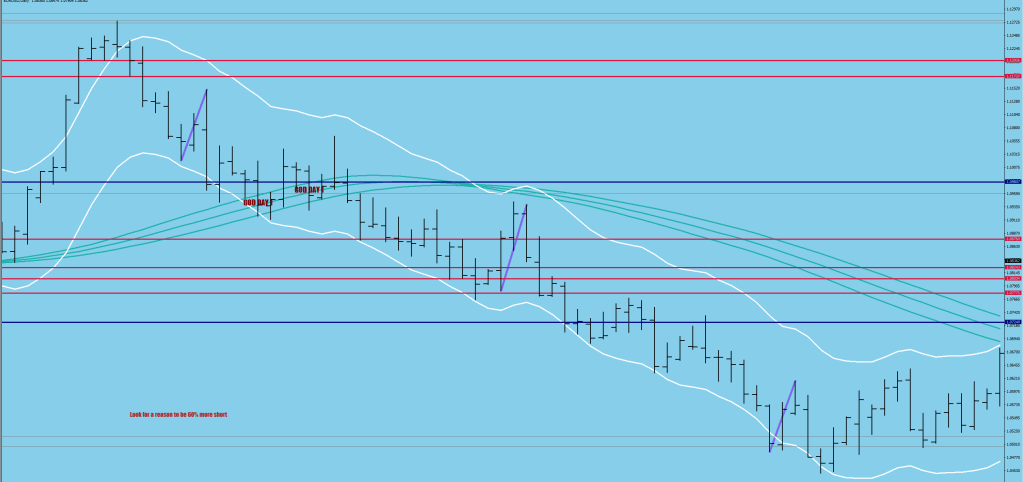
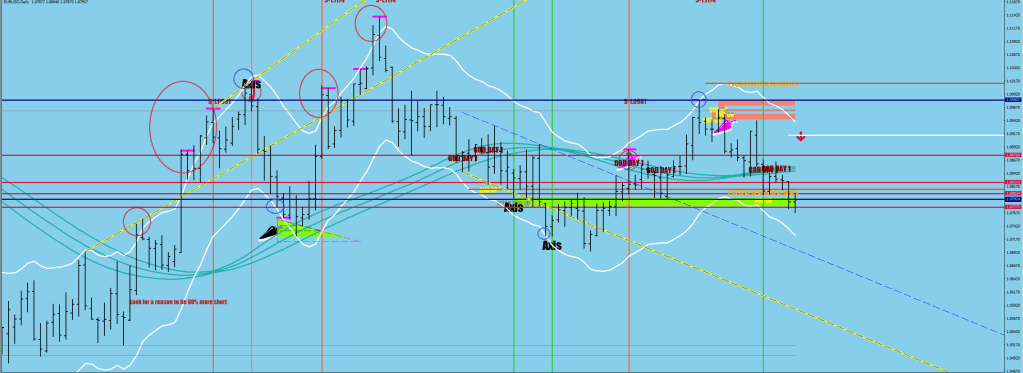
The blue circles are grazes, the red ovals are going outside for more than once intraday / barely getting outside. The red ones are in “normal” volatility times, the blue ones are the symptom of “bare minimum” volatility.
The following things are observations.
Of course, the red-blue on the first run up talks of vaning volatility, hence you see the correction next.
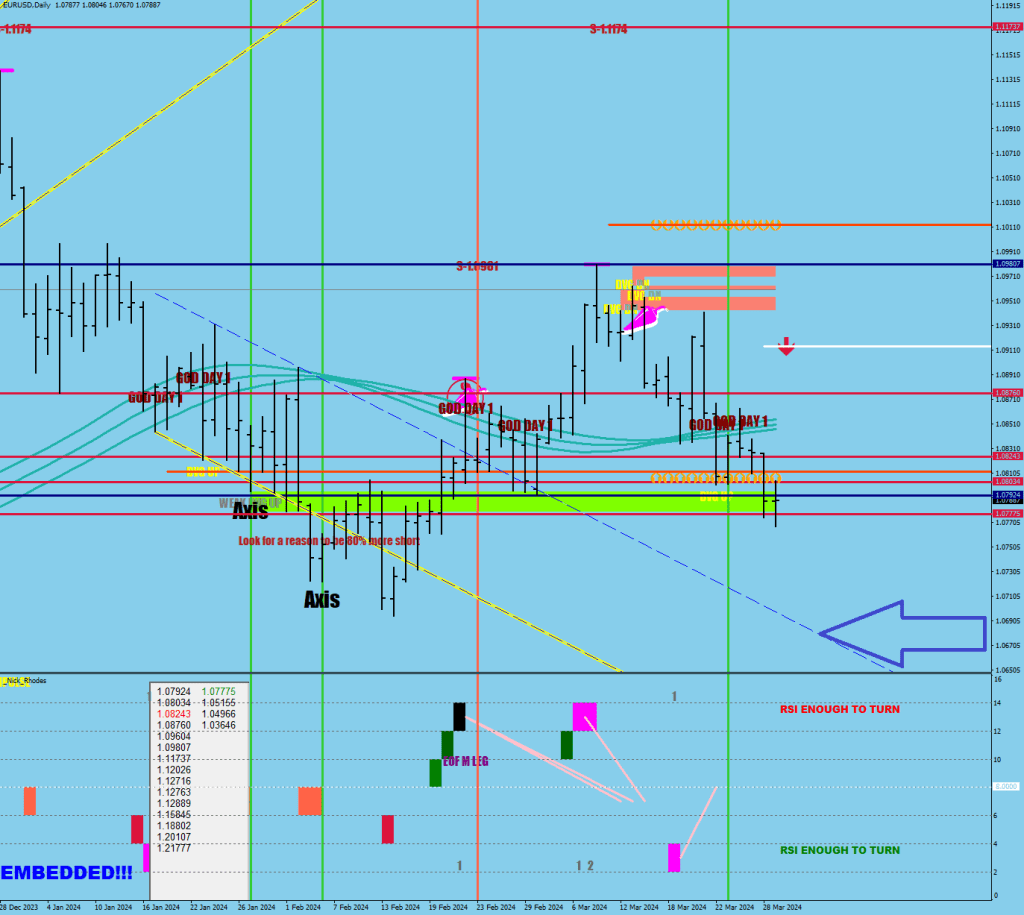
If the first print is a blue one, than the following day can give a signal regarding continuation by taking out the high or low. The two examples on the downside got ultimately exceeded by 55 and 27 pips before the divergent turns materialized.
Obviously, the minimum expectation now is that the volatility would have to get high enough to catch up to the bands to even start the divergent turn (if the following day of the graze would be a lower low first).
When the volatility was still normal, you could go by the Nick Rhodes vertical lines to spot the Measuring leg and then play the textbook daily higher high lower low trend thing after a one day break to arrive at the Divergent leg (outside the white lines again) to find an optimal exit.
The reason why Cem Karsan is looking for a blow off top on the S&P is that when volatility starts increasing, the market would start accelerating in the direction that it’s been going first before setting up the reversal divergence (push & echo).
Who knew that you don’t even need Bollinger Bands let alone Vix to measure volatility, simple EMA dispacements can do?!
x3 is still missing. In fact, it could come in at a whole lot lower.
The volatility is currently abysmal, I would like to see a 2.8x stretch from the mean at a very minumum to call a bottom (upper left gray numbers).
Where the swing low and the interrupted blue meets, that looks to be a confluence of interest. As above, is below. 1.0690
The things to learn from Tom Hougaard? What broker to use, which futures markets to trade, how to maximize leverage (sizing, snowballing in).
What not to learn? Narcissism is not a trading strategy.
The phenomenon that he points out about the FTSE is just that. May or may not continue into the future, so overall the show is “here’s nothing, grab it well”.
Now, if only he could get as far as isolating conditions with careful filtering and starting to build flow charts resembling that of logical circuits, and ditching the idea of one market must behave like another, he could start following in my footsteps. He does not see beyond a group of candles and the timeframes he vouches for would never prove consistent.
His vanity would never let him admit to how bad he is at finding the trade and knowing the right sequence of the events, the bigger picture, so he takes his hide in the quantum world, where temporarily chaos may rule.
I knew a French guy, who put his life on an algo that works on 1 or 3-minute time frame on futures and currencies. I bet, after 10+ years searching, he still hasn’t find a one routine works with multiple instruments in the quantum space. He had me chase ghosts on an IG back tester. Every odd run came back with wildly different results as the even runs. Like an observer looking at a quantum state at random times.
If you want to understand the story, the what comes next, look on the 30 min, 1H charts. Statistics are important, they are the edge, but they do not exist on 5 minutes and below. One instrument is nothing like another.
[Verse 1] I am a non-critical system Stuck on an overcritical rock Lacking the skills, knowledge or training To qualify as an astronaut But could I be a passenger? Stowaway or cargo? Baggage?
[Chorus 1] In space no one can hear you cry I smile and mouth the word goodbye I’ll seek out a colony Whichever one will take me Take me to the stars
[Verse 2] An object in motion stays in motion An object at rest stays at rest Sound waves can’t travel in a vacuum And nobody passes my empathy test But I don’t need an audience Loneliness beats ignorance any day
[Chorus 2] In space no one can hear you cry A satellite to resupply I’ll survey the galaxy Hitchhiking from rover to rover Take me to the stars
[Chorus 3] In space no one can hear you cry Self-conscious of their naked eyes If you join in my fantasy I promise to accept you
So, there is this dilemma of keeping a memory of a volatility expansion.
As a first step I can see making a version of the 15-min ATR targets and make a plot for the previous consolidation mean and some “previous W3” boxes plots – and then I need to do some more thinking of what and how could be carried over to a daily chart.
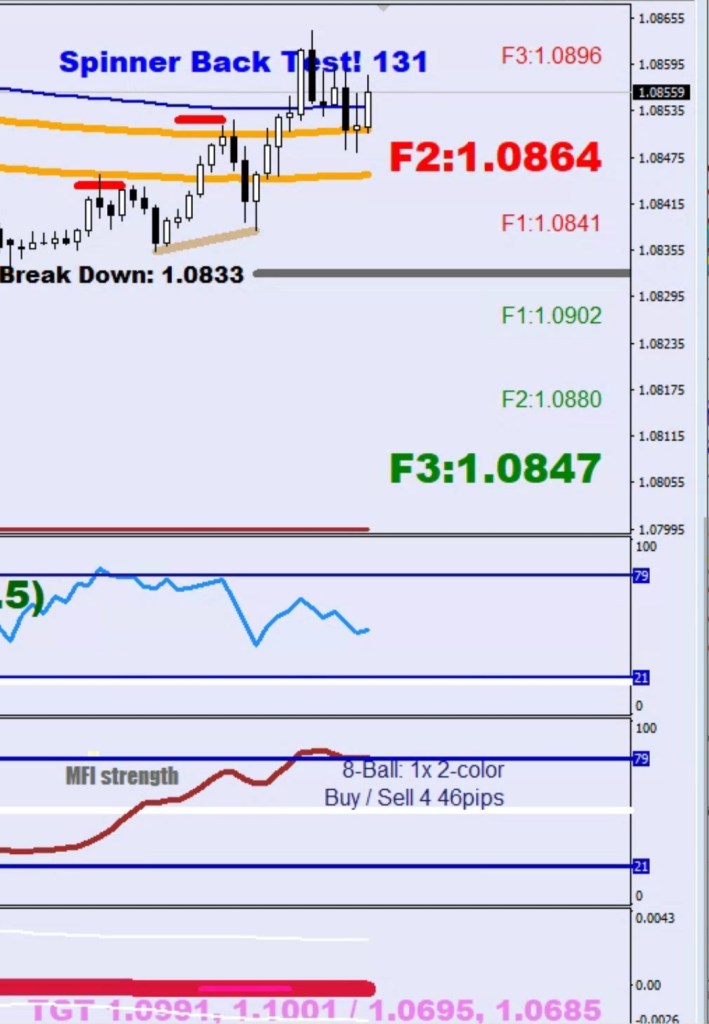
As a reminder, a Vicious Sell means that the lower Safety Line (0.28) is going to get taken out next.
Also, we have just come back to a virgin spinner.
So, a gypsy gal at one of the brothels in my home town told me back in the days that they were the property of “Szeva”.
Of course I was interested in finding out how the good old guy’s life has shaped up and YouTube has its segments.