Holler If You’re Near Me

Do not miss this one chance to fold on the one opportunity in a lifetime.

Apparently, 35% win rate is enough to make you a Market Shapiro Wizard, but 98.9% isn’t good enough to even get noticed.

On the other hand 35% win rate isn’t going to get you hundreds of percents of gains per year.

Opportunity comes once in a limelight

I earn to be called a professional trader most months.

In January I made $5,828.75 from trading whilst my salary was $4,365.58 (£3,443.86).

In Febuary I made $4,836.55 from trading whilst my salary was $3,103.46 (£2,447.11).

In March I made $5,037.63 from trading whilst my salary was $3,022.94 (£2,393.67).

In April I made $6,000.74 from trading whilst my salary was $4,284.34 (£3,422.87).

I have nothing to hide, the detailed statements are accessible. I don’t make up excel spread sheets with imaginary trades / holdings.

If Forex Factory’s numbers are correct, I made 19.8% gains in January and 22% in Feb, 20% in March & 27.1% in April. I guess mine is also a 20% success trading strategy: 20% gains per month as a minimum.

In February there was a withdrawal attempt for $5100 that got reversed (without explanation) and ended up showing up as a deposit too, but there was never any money going in from me.

The broker’s active sabotage resulted in 2 unrequested entries that I wrote a nasty letter over.

I have been with you for 5 years now guys. In fact, I am merely days away from asking for a Pro Ecn.

I closed 30,379 trades to date. Do you know how many had close by references? Exactly zero.

The two entries were made by a human being.

How do I know this? Because there is most certainly no way to put a close by link to only a part of an ordher, furthermore an automatic partial close out of any trade would never result in the charge of the incurred swap for the entire position (breach #2).

Please reverse those two entries that were made during my sleep, find the resposible person and take appropriate actions.

Mom’s spaghetti? What is this, a requiem for Eminem?

The point is that lots of trading wisdom may amount to nothing, and doing the exact opposite of your guidelines may get you results faster. There is no argument to be had, there is no “yes, but”, there are only bottomline figures for measurements, and how you get there does not matter. I chose to make 3 dollars at a time, take losses on my own terms and I don’t have time for multiple instruments or digesting news feeds, and I have no problems with having a 98% win rate. I’m an in and out burgler.

…case imported tuna fish comes once in a lifetime.

Nobody likes a Crowded House.

Kazakhstani version of 2Pac maybe?

I do not have any agenda other than you should not be so certain about how trading must be done. Also I want to call attention to how far behind your own potential you are.

Let me tell you, once you made 100% gains and pulled back out the core capital to give it new purpose, all the traditional risk models cease to make any sense. Your risk would become zero, you would officialy become the bank.

01-04/2024

At The Moment

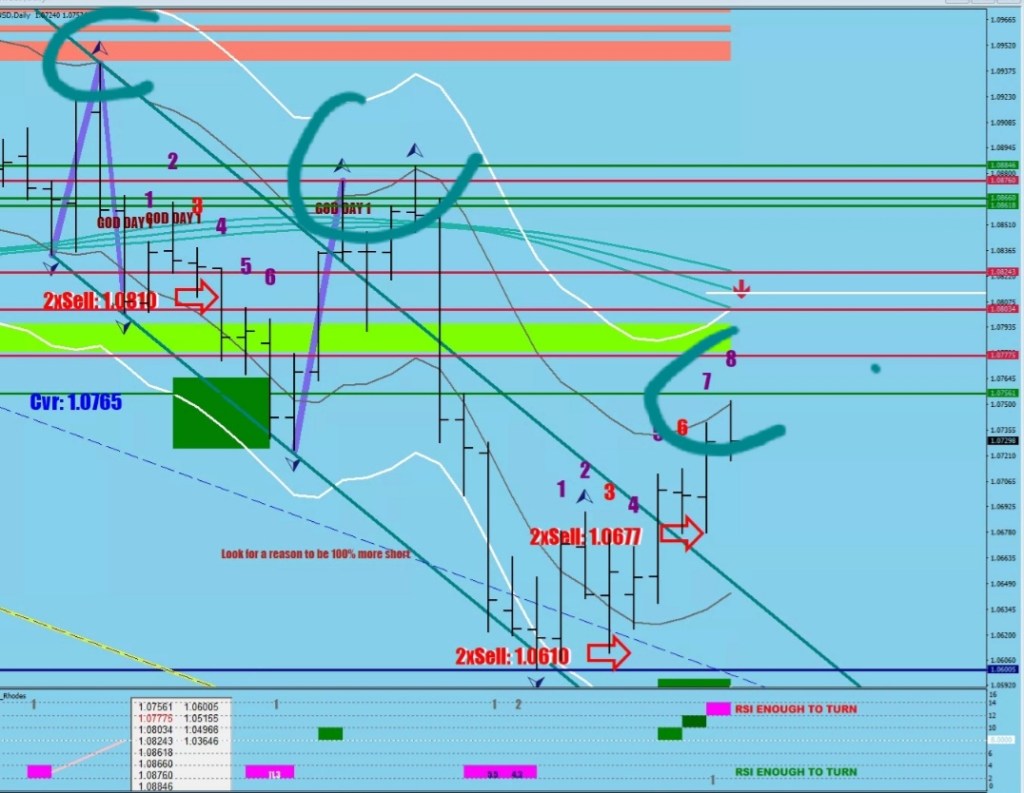
…I’m having difficulties calling this rally over: there are 3 F-s seem to be missing.

The x0 flip back was missing a filter. I settled on the E-16.

///Flip back down 100x "2" on downsdide & no touch of the 2.8 safety for 40 hours

High[i]<iMA(symbol,0,16,0,MODE_EMA,PRICE_MEDIAN,i)
     

The white low (day 6’s low) does not seem to want to give. The 3 P/NRs remind me of Bulkowski’s 3 peaks… and the house on the hill is yet to be made.

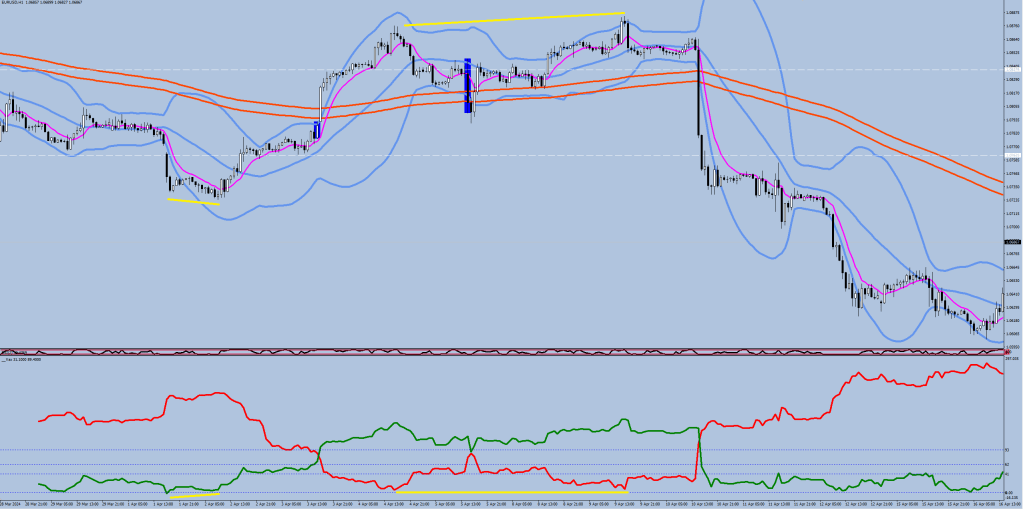
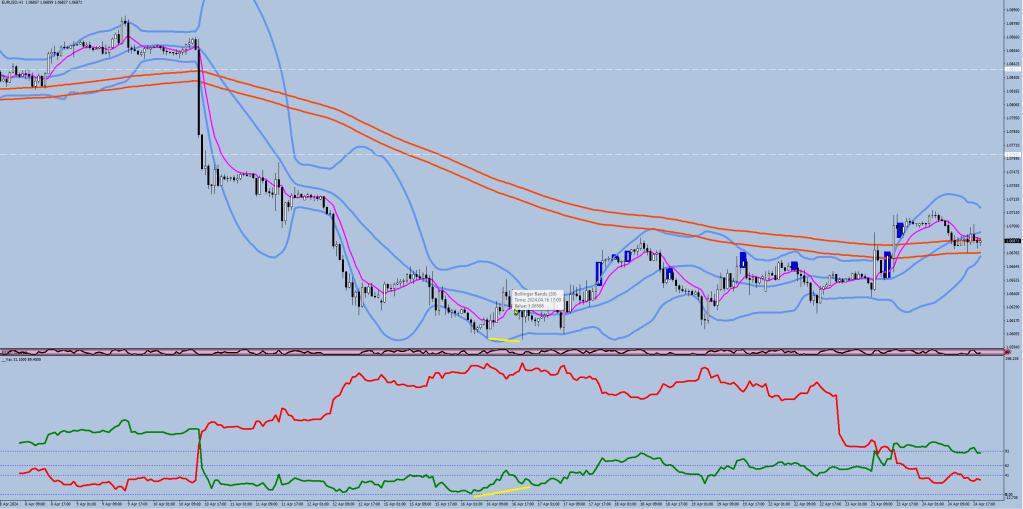
The volatility divergence is not yellow for a reason: a key filter that I came up with at the beginning was that the candle following the divergence fractal (next hour) had to close back on the other side of the 8 EMO (magenta). It is not the case, only the 2nd hour managed to do it. This looks more like a prepped high for a break out.

   if (iFractals(symbol,0,MODE_UPPER,i) && iHigh(symbol,0,iHighest(symbol,0,MODE_HIGH,80,i))==iHigh(symbol,0,i)
   && ExtATRBuffer[ArrayMinimum(ExtATRBuffer,80,i+1)]<10 
   && ExtATRBuffer[ArrayMaximum(ExtATRBuffer,10,i+14)]<62
   && ExtATRBuffer[ArrayMinimum(ExtATRBuffer,80,i+1)]<ExtATRBuffer[i] 
   && ExtATRBuffer[i]<45
   && ((Close[i-1]<iMA(symbol,0,8,0,MODE_EMA,PRICE_OPEN,i-1)) || (i>1 && Close[i-2]<iMA(symbol,0,8,0,MODE_EMA,PRICE_OPEN,i-1))) 
   && ExtATRBuffer2[ArrayMaximum(ExtATRBuffer2,80,i+10)]<ExtATRBuffer2[i]
   )
   {
      ObjectCreate("Frog"+IntegerToString(i),OBJ_TREND,indicator_window, Time[i], ExtATRBuffer[i], Time[ArrayMinimum(ExtATRBuffer,80,i+1)], ExtATRBuffer[ArrayMinimum(ExtATRBuffer,80,i+1)]);
      ObjectSet("Frog"+IntegerToString(i),OBJPROP_COLOR,clrYellow); 
      if (ExtATRBuffer[i]>41)  ObjectSet("Frog"+IntegerToString(i),OBJPROP_COLOR,clrPink); 
      if (Close[i-1]>iMA(symbol,0,8,0,MODE_EMA,PRICE_OPEN,i-1)) ObjectSet("Frog"+IntegerToString(i),OBJPROP_COLOR,clrGray); 
      ObjectSet("Frog"+IntegerToString(i),OBJPROP_WIDTH,6);  
      ObjectSet("Frog"+IntegerToString(i),OBJPROP_RAY_RIGHT,false);
      ObjectSet("Frog"+IntegerToString(i),OBJPROP_BACK,true);           
   }

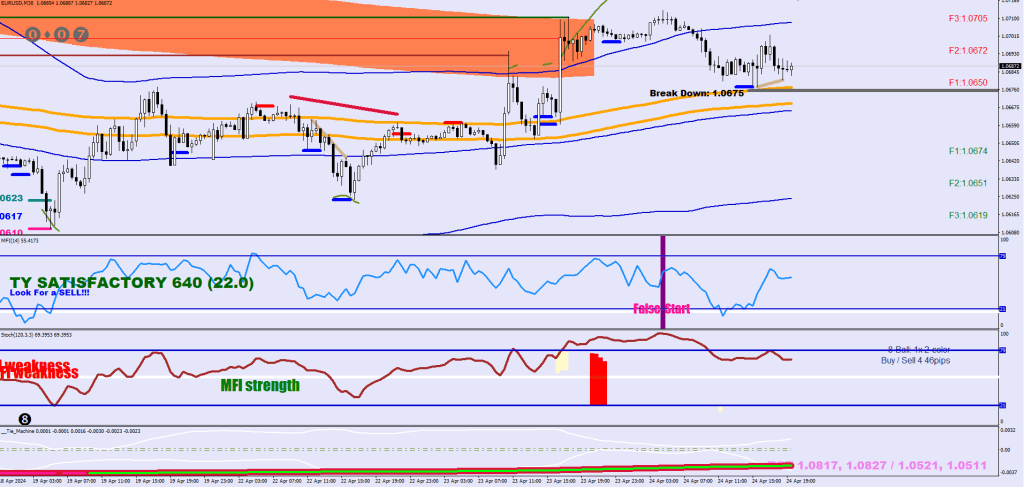
How far could this go? An upside break out with the current level of consolidation could muster an 1.0802-1.0817 print.

The money flow does not seem to go oversold enough to prompt a reversal zone below. The purple trendline is holding.

The last dip in the green below the 0.28 line shows up as an early bird buy.

The sell off on Friday demoted the Nick Rhodes temporary magenta print to a block below where the RSI2 is stong enough for a turn.

The Hotsteppa line (white + red arrow) happens to be around the E-50 and is currently hanging out at 1.0813 of all places. This line by the way is the tangible heritage of my Energy Bands (as part of the free Nick Rhodes), it is their average six days back.

c0[i]=(c11[i+6]+c22[i+6])/2;
  cval[i] = (.0200/55)*adj*(ChoppinessIndex(ChoppinessPeriod,i+3)+ChoppinessIndex(ChoppinessPeriod,i+4)+ChoppinessIndex(ChoppinessPeriod,i+5))/3;

 c11[i] = (iHigh(NULL,0,i+8)+iHigh(NULL,0,i+7)+iHigh(NULL,0,i+5)+iHigh(NULL,0,i+6))/4+cval[i]*.93*m*Trange[i]*volatility
+(VOLA-50)/10000*m;

   c22[i] = (iLow(NULL,0,i+8)+iLow(NULL,0,i+7)+iLow(NULL,0,i+5))/3-cval[i]*1.62*m*Trange[i]*dvolatility*1.2
+(VOLA-50)/10000*m;

I have 1.7 lots more shorts than longs. I will try to equate them first – if shorts come into money by closing them, if that does not occur, I would have to add longs – or the combination of both.


I’ve dusted off and re-purposed some of my poems for an AI experiment.

Volatility Visor

or wiser?

So I made a flexible displacement option from the E-9.

It takes a bit of fiddling to form fit for the right decimal for the resistsnce.

1.4x does it for dynamic resistance.

Of course the first thing is to get the mean right.

Money flow reversal zone tolerance level is 1.0756.

A bit of fresh air this is from the static levels and trendlines people. Curling back up leaves a bit more headroom for a day to day conversation.

This also means if you are Australian and thinking that the main mean is the daily 20, you are simply wrong.

The 3rd P/NR print. Dumped almost all longs. 8.3 lots short on balance.

The volatility divergence still needs to be set. The attempt was too steep, so it is Pink, not Yellow. Could use another higher high to get the divergence right.

In conclusion be advised: everything starts and ends with volatility, wich means distance.

Vax

Vix is a single number. You can measure absolute maximum distance from a moving average, but how useful is that?

Sophistication starts when you go with a sample size and measure maximum stretch on the upside and on the downside. 2 volatility reads, yes. It makes possibble to see a lot of the underlying changes.

Of course, Counterforce was meant to do this. But so does Vax, only with lines instead of histograms, no limiting and no negative numbers.

#property copyright "Copyright © 2024, Macdulio" 
#property link      "https://forexfore.blog" 
#property description "V1.0"
#property description "Vax"
#property strict

//--- indicator settings
#property indicator_separate_window
#property indicator_buffers 3
#property indicator_color1  clrRed
#property indicator_color2  clrGreen
#property indicator_color3  clrPurple
#property indicator_color4  clrBlue
#property indicator_color5  clrRed
#property indicator_color6  clrDarkKhaki
#property indicator_color7  clrWhite
#property indicator_level1 0
#property indicator_level2 41
#property indicator_level3 62
#property indicator_level4 93
#property indicator_levelcolor clrBlue
#property indicator_levelstyle STYLE_DOT

extern double valuetomonitor = 5.5;
extern int lookback = 100;
extern int indicator_window = 3;
extern int sample = 200;
extern double FSize=32;
double upper[], middle[], lower[];
double avg;
double FMax = FSize*6/5;
double iHi4[];
double iLo4[];    
  string symbol = Symbol();  
double ExtATRBuffer[],ExtATRBuffer2[],ExtATRBuffer3[],ExtATRBuffer4[],ExtATRBuffer5[],stoch60[];
double corr[],corr2[], RSI2[], squeeze[];

int init(){
  
   SetIndexBuffer(0,ExtATRBuffer);   
   SetIndexStyle(0,DRAW_LINE,STYLE_SOLID,4,indicator_color1);
   SetIndexBuffer(1,ExtATRBuffer2);   
   SetIndexStyle(1,DRAW_LINE,STYLE_SOLID,4,indicator_color2);

   return(0);
}

//+------------------------------------------------------------------+
//| Average True Range                                               |
//+------------------------------------------------------------------+
int start(){
  
  ArrayResize(ExtATRBuffer, Bars); 
  ArrayInitialize(ExtATRBuffer, EMPTY_VALUE);   
    ArrayResize(ExtATRBuffer2, Bars); 
  ArrayInitialize(ExtATRBuffer2, EMPTY_VALUE);   
      ArrayResize(ExtATRBuffer3, Bars); 
  ArrayInitialize(ExtATRBuffer3, EMPTY_VALUE);  
      ArrayResize(ExtATRBuffer4, Bars); 
  ArrayInitialize(ExtATRBuffer4, EMPTY_VALUE);  
     ArrayResize(ExtATRBuffer5, Bars); 
  ArrayInitialize(ExtATRBuffer5, EMPTY_VALUE);   
  ArrayResize(iHi4, Bars); 
  ArrayInitialize(iHi4, EMPTY_VALUE);   
  ArrayResize(iLo4, Bars); 
  ArrayInitialize(iLo4, EMPTY_VALUE);   
     ArrayResize(stoch60, Bars);   
 ArrayInitialize(stoch60,  EMPTY_VALUE);
  ArrayResize(RSI2, Bars);   
 ArrayInitialize(RSI2,  EMPTY_VALUE);
   ArrayResize(corr, Bars);   
 ArrayInitialize(corr,  EMPTY_VALUE);  
    ArrayResize(corr2, Bars);   
 ArrayInitialize(corr2,  EMPTY_VALUE);  
    ArrayResize(middle, Bars);   
 ArrayInitialize(middle,  EMPTY_VALUE);  
   ArrayResize(squeeze, Bars);   
 ArrayInitialize(squeeze,  0); 
  ArrayResize(upper, Bars);   
 ArrayInitialize(upper,  EMPTY_VALUE);  
 ArrayResize(lower, Bars);   
 ArrayInitialize(lower,  EMPTY_VALUE);  
    
   int i,j,k;

  for(i=Bars-100; i>=0; i--){ 
   
     if (Period()==240)   iHi4[i]=iMA(NULL,0,52,0,MODE_EMA, PRICE_HIGH,i);
     else if (Period()==30) iHi4[i]=iMA(NULL,0,414,0,MODE_EMA, PRICE_HIGH,i);
     else if (Period()==60) iHi4[i]=iMA(NULL,0,207,0,MODE_EMA, PRICE_HIGH,i);
     if (Period()==240)  iLo4[i]=iMA(NULL,0,52,0,MODE_EMA, PRICE_LOW,i);
     else if (Period()==30) iLo4[i]=iMA(NULL,0,414,0,MODE_EMA, PRICE_LOW,i);
     else if (Period()==60) iLo4[i]=iMA(NULL,0,207,0,MODE_EMA, PRICE_LOW,i);
      stoch60[i]=iStochastic(symbol,60,60,3,3,MODE_SMA,0,MODE_SIGNAL,i);
      RSI2[i]=iRSI(symbol,0,2,PRICE_MEDIAN,i);
}

deletetxt1("Pepper");
deletetxt1("Panace");
deletetxt1("PLOT");

for(i=lookback; i>=0; i--){ 
      middle[i] = iMA(NULL, 0, 20, 0, MODE_SMA, PRICE_TYPICAL, i);
      avg  = findAvg(20, i);
      upper[i] = middle[i] + avg;
      lower[i] = middle[i] - avg;
  
 
 ExtATRBuffer[i]= -1*(iHigh(symbol,0,iHighest(symbol,0,MODE_HIGH,sample-1,i+1))-Low[i])*-10000;
 ExtATRBuffer2[i]=(High[i]-iLow(symbol,0,iLowest(symbol,0,MODE_LOW,sample-1,i+1)))*10000;

if (Period()==60){ 
  
  corr[i]=corr[i+1];
   corr2[i]=corr2[i+1];
   if (ExtATRBuffer4[i+6]!=EMPTY_VALUE) {corr[i]=iHigh(symbol,0,iHighest(symbol,0,MODE_HIGH,60,i))-1360*Point; corr2[i]=iHigh(symbol,0,iHighest(symbol,0,MODE_HIGH,60,i))-2100*Point;} 
   if (ExtATRBuffer5[i+6]!=EMPTY_VALUE) {corr[i]=iLow(symbol,0,iLowest(symbol,0,MODE_LOW,60,i))+1360*Point; corr2[i]=iLow(symbol,0,iLowest(symbol,0,MODE_LOW,60,i))+2100*Point;}


}

}

deletetxt1("AverD");

int twodigits = NormalizeDouble(ExtATRBuffer2[0],0);

if (MathAbs(ExtATRBuffer[0])>ExtATRBuffer2[0]) twodigits = NormalizeDouble(MathAbs(ExtATRBuffer[0]),0);

//string tds = IntegerToString(twodigits);

int tens = round(twodigits/10);

int ones = twodigits-tens*10; 

string stens, sones;

//Print("tens=",tens);
//Print("ones=",ones);


switch(tens)
{
case  1:   stens=CharToStr(140);
        break;
case  2:   stens=CharToStr(141);
        break;
case  3:   stens=CharToStr(142);
        break;        
case  4:   stens=CharToStr(143);
        break;
case  5:   stens=CharToStr(144);
        break;
case  6:   stens=CharToStr(145);
        break;        
case  7:   stens=CharToStr(146);
        break;                
case  8:   stens=CharToStr(147);
        break;                        
case  9:   stens=CharToStr(148);
        break;                      
  default: stens=CharToStr(139);
      break;
  }
  
//deletetxt1("AverD");

switch(ones)
{
case  1:   sones=CharToStr(140);
        break;
case  2:   sones=CharToStr(141);
        break;
case  3:   sones=CharToStr(142);
        break;        
case  4:   sones=CharToStr(143);
        break;
case  5:   sones=CharToStr(144);
        break;
case  6:   sones=CharToStr(145);
        break;        
case  7:   sones=CharToStr(146);
        break;                
case  8:   sones=CharToStr(147);
        break;                        
case  9:   sones=CharToStr(148);
        break;                      
  default: sones=CharToStr(139);
      break;
  }

 
string jointstring=stens+sones;

ObjectCreate("AverD",OBJ_LABEL,indicator_window, 0,0);

ObjectSet("AverD",OBJPROP_CORNER,3);
    ObjectSet("AverD",OBJPROP_XDISTANCE,20);
  ObjectSet("AverD",OBJPROP_YDISTANCE,27);
  
ObjectSetText("AverD",jointstring,40,"Wingdings",DimGray);
if (twodigits>30)  ObjectSetText("AverD",jointstring,40,"Wingdings",Yellow);  
if (twodigits>58)  ObjectSetText("AverD",jointstring,40,"Wingdings",DeepPink);  


deletetxt1("Crush");  
deletetxt1("Leap");  
deletetxt1("Frog"); 
deletetxt1("Countess");
deletetxt1("Missing");
deletetxt1("KAROLY");
  
int counter = 9;  
  
for(i=lookback; i>=0; i--){   

       if (Close[i]<iLo4[i] )  {ObjectSetText("Crushi"+i, "Vol Crush > ", 21, "Impact", clrWhite); ObjectSetText("Crush"+i, "Vol Crush -> ", 19, "Impact", clrNavy); ObjectSetText("Crushy"+i,DoubleToStr(NormalizeDouble(iHi4[i],4),4), 21, "Impact", clrWhite); ObjectSetText("Crushd"+i, DoubleToStr(NormalizeDouble(iHi4[i],4),4), 19, "Impact", clrNavy);   }
       
       else if (Close[i]>iHi4[i] ) { ObjectSetText("Crushi"+i, "Vol Crush > ", 21, "Impact", clrWhite); ObjectSetText("Crush"+i, "Vol Crush -> ", 19, "Impact", clrNavy);  ObjectSetText("Crushy"+i, DoubleToStr(NormalizeDouble(iLo4[i],4),4), 21, "Impact", clrWhite); ObjectSetText("Crushd"+i, DoubleToStr(NormalizeDouble(iLo4[i],4),4), 19, "Impact", clrNavy);  }

}

double rou=0;
double rod=0;

if (Period()==30){
deletetxt1("Libec");

i=0;
while(i<10){
   if (High[i]-iMA(NULL,0,17,0,MODE_EMA, PRICE_MEDIAN,i)>rou) rou=High[i]-iMA(NULL,0,17,0,MODE_EMA, PRICE_MEDIAN,i);
   if (iMA(NULL,0,17,0,MODE_EMA, PRICE_MEDIAN,i)-Low[i]>rod) rod=iMA(NULL,0,17,0,MODE_EMA, PRICE_MEDIAN,i)-Low[i];
i++;
}

  ObjectCreate("Libec"+4,OBJ_LABEL,indicator_window, 0,0);
   ObjectSetText("Libec"+4, DoubleToStr(rou*10000,2)+" ("+DoubleToStr(iMA(NULL,0,17,0,MODE_EMA, PRICE_MEDIAN,0)+rou,4)+")", 11, "Arial Black", DarkViolet);  
  ObjectSet("Libec"+4,OBJPROP_CORNER,2);
    ObjectSet("Libec"+4,OBJPROP_XDISTANCE,20);
  ObjectSet("Libec"+4,OBJPROP_YDISTANCE,67);
  if (rou>rod) ObjectSet("Libec"+4,OBJPROP_COLOR,clrDarkGreen);
  else if (rou<.0010) ObjectSet("Libec"+4,OBJPROP_COLOR,clrGray);
   else ObjectSet("Libec"+4,OBJPROP_COLOR,clrBlack);


  ObjectCreate("Libec"+5,OBJ_LABEL,indicator_window, 0,0);
   ObjectSetText("Libec"+5,DoubleToStr(rod*10000,2)+" ("+DoubleToStr(iMA(NULL,0,17,0,MODE_EMA, PRICE_MEDIAN,0)-rod,4)+")", 11, "Arial Black", DarkViolet);  
  ObjectSet("Libec"+5,OBJPROP_CORNER,2);
    ObjectSet("Libec"+5,OBJPROP_XDISTANCE,20);
  ObjectSet("Libec"+5,OBJPROP_YDISTANCE,47);
  if (rod>rou) ObjectSet("Libec"+5,OBJPROP_COLOR,clrCrimson); 
  else if (rod<.0010) ObjectSet("Libec"+5,OBJPROP_COLOR,clrGray);
   else ObjectSet("Libec"+5,OBJPROP_COLOR,clrBlack);

}


  return(0);
}
//+------------------------------------------------------------------+
   void deletetxt1(string text){
   for(int iObj=ObjectsTotal()-1; iObj >= 0; iObj--){
      string   on = ObjectName(iObj);
      if(StringFind(on, text) == 0)  ObjectDelete(on);
}  }

   double findAvg(int period, int shift) {
      double sum=0;
      for (int x=shift;x<(shift+period);x++) {     
         sum += High[x]-Low[x];
      }
      sum = sum/period;
      return (sum);
   }

Based on the need for \ volatility divergence, there should be a higher high print with the red line not making it down to 25.

x0 Time Out

I adddd 1 filter to the x0, which is 40 hours of failing to get ti the upper Safety Line (2.8).

It looks to me that the market is about to fail the purple trendline just below the 2.8.

I’ll try to scale into a full hedge by 1.0685 and double down on the shorts at 1.0610 targeting 1.0565.

It is quite possible that the bow has 3 more days to go, as the Embedding prevails.

Other: I have dusted off an older poem of mine and tried Suno for the first time.

My Autumn + AI music

Take A Bow

I might be pioneering something here – wouldn’t be the first time.

A connection between stochastic embedding, a counter and statistics – can tell you with great probability if price is in a bow, so you get to fade the move starting F1++ to an F3- for an LL, HH or an LL/HH attempt.

The count is usually 3 or 6. That’s your stats. 8 or larger = show must go on.

Filtering away

for(i=200; i>=0; i--){

if (bupcounter>0) bupcounter++;
if (bdncounter>0) bdncounter++;

///counter starts  
   if (Low[i+2]>Low[i+1] && Low[i+1]<iMA(symbol,0,9,0,MODE_EMA, PRICE_MEDIAN,i+1)-FMax*2.8*10*Point && Low[i]>iMA(symbol,0,9,0,MODE_EMA, PRICE_MEDIAN,i)-FMax*2.8*10*Point )
   bupcounter=1;
 
   if ((High[i+1]>iMA(symbol,0,9,0,MODE_EMA, PRICE_MEDIAN,i+1)+FMax*2.8*10*Point || High[i+2]>iMA(symbol,0,9,0,MODE_EMA, PRICE_MEDIAN,i+2)+FMax*2.8*10*Point  || High[i+3]>iMA(symbol,0,9,0,MODE_EMA, PRICE_MEDIAN,i+3)+FMax*2.8*10*Point)
   &&
   High[i+2]<High[i+1] && High[i]<High[i+1]+20*Point && High[i]<iMA(symbol,0,9,0,MODE_EMA, PRICE_MEDIAN,i)+FMax*2.8*10*Point )
   bdncounter=1;

//stochastic lost
   if (!(iStochastic(symbol,1440,18,3,3,MODE_SMA,0,MODE_SIGNAL,i+2)<26 && iStochastic(symbol,1440,18,3,3,MODE_SMA,0,MODE_MAIN,i+2)<26)) 
   bupcounter=0;   

   if (!(iStochastic(symbol,1440,18,3,3,MODE_SMA,0,MODE_SIGNAL,i)>73 && iStochastic(symbol,1440,18,3,3,MODE_SMA,0,MODE_MAIN,i)>73)) 
   bdncounter=0;

///x-sample NL / NH reset

   if (i>0 && Low[i-1]>Low[i] && bupcounter>=3 && Low[i+1]==iLow(symbol,0,iLowest(symbol,0,MODE_LOW,8,i+1))) bupcounter=0;    

   if (i>0 && High[i-1]<High[i] && bdncounter>=3 && High[i+1]==iHigh(symbol,0,iHighest(symbol,0,MODE_HIGH,3,i+1))) bdncounter=0;    
   

if (bupcounter>0){   
   ObjectCreate("Punto"+IntegerToString(i), OBJ_TEXT, 0, Time[i], High[i]+310*Point); 
   ObjectSetText("Punto"+IntegerToString(i), IntegerToString(bupcounter), 21, "Impact", Purple);
}

if (bdncounter>0){   
   ObjectCreate("Punto"+IntegerToString(i), OBJ_TEXT, 0, Time[i], Low[i]-70*Point); 
   ObjectSetText("Punto"+IntegerToString(i), IntegerToString(bdncounter), 21, "Impact", Purple);
}

Yea, no wouldn’t try to short this til the S-356 at least.

…the development can’t stop, won’t stop.

Limited Time Coffer

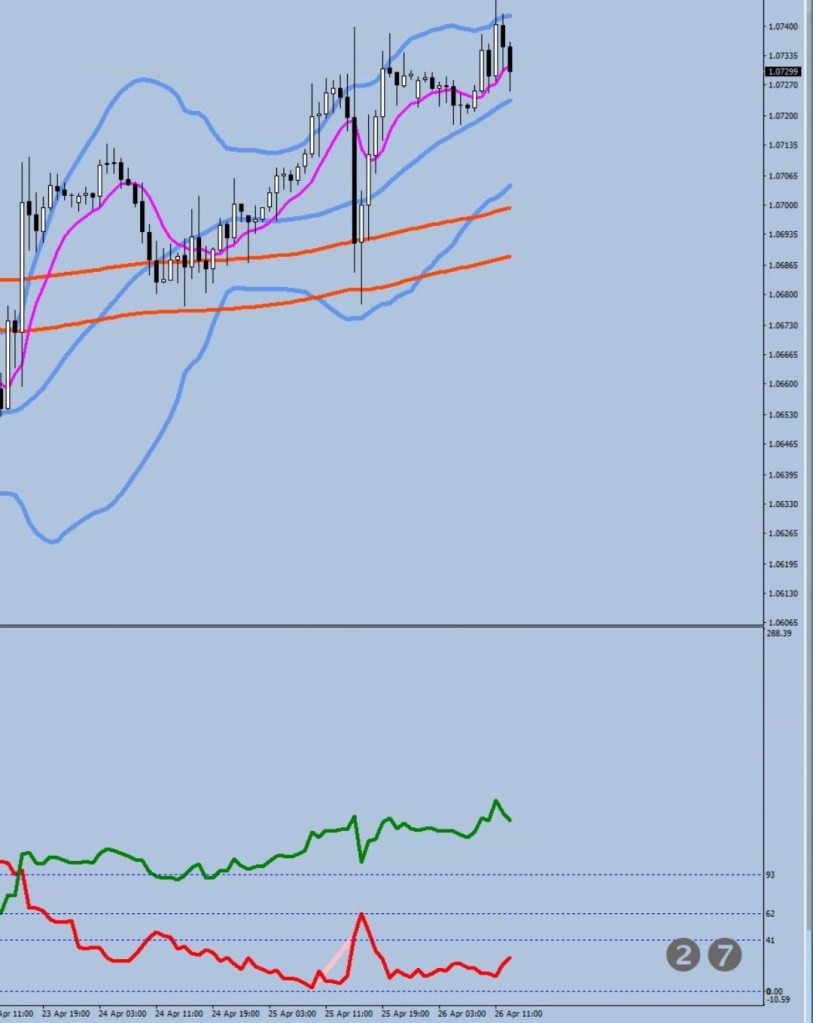
The market is in a weak uptrend right now, but if it does not get to the upper Safety Line within 48 hours, it will flip back into a strong downtrend.

It’s got till 12AM GMT. If the Safety will be popped by then, the uptrend shall remain in place without a time limit.

I’m telling you this to show that time, time outs are a crucial part of changes.

The vertical green was the first hour.

Once the Safety is popped the stumbling point is 34 pips higher from where the encounter would take place. 1.0694 is a good likelihood. The ultimate resistance is the hourly S-356, and Full Discharges around it would be a death sentence for bulls. The only way to clear that obstacle would be price coming back below the Safety line in a regressive manner (i.e. a volatility keel back) – at about 10% odds.

The S-356 is going to be at 1.0750 soon. A left shoulder could print in its neighbourhood (the thick part of the brown) and two more tries could follow with a dip in between that would miss the lower Safety line by 5-10 pips.

Ounces Of Nuances #3

They brought some broken furniture from the multi faith room today. A female coworker asked: what did they do to this? To which I responded: they prayed the shit out of it.

First a little practical application of Nick Rhodes.

When a withe stochastic value prints below 5 in the magenta box, thag is unsustainble. Since they daily stochastic has not embedded yet, by the daily close the stochastic reading must be higher.

i.e..:

In the white you accumulate.

In the blue you can start to cover.

I wrote the filter for the x0 flip back down, but to be fair I do not know why it works so well. There should be 100 #2 prints in the array, yet I’m sure it is not the case when it flips.

if (fd[i+1]==2 && fd[i+1]==fd[i+2]==fd[i+3]==fd[i+4]==fd[i+5]==fd[i+6]==fd[i+7]==fd[i+8]==fd[i+9]==fd[i+10]
               ==fd[i+11]==fd[i+12]==fd[i+13]==fd[i+14]==fd[i+15]==fd[i+16]==fd[i+17]==fd[i+18]==fd[i+19]==fd[i+20]
               ==fd[i+21]==fd[i+22]==fd[i+23]==fd[i+24]==fd[i+25]==fd[i+26]==fd[i+27]==fd[i+28]==fd[i+29]==fd[i+30]
               ==fd[i+31]==fd[i+32]==fd[i+33]==fd[i+34]==fd[i+35]==fd[i+36]==fd[i+37]==fd[i+38]==fd[i+39]==fd[i+40]
               ==fd[i+41]==fd[i+42]==fd[i+43]==fd[i+44]==fd[i+45]==fd[i+46]==fd[i+47]==fd[i+48]==fd[i+49]==fd[i+50]
               ==fd[i+51]==fd[i+52]==fd[i+53]==fd[i+54]==fd[i+55]==fd[i+56]==fd[i+57]==fd[i+58]==fd[i+59]==fd[i+60]
               ==fd[i+61]==fd[i+62]==fd[i+63]==fd[i+64]==fd[i+65]==fd[i+66]==fd[i+67]==fd[i+68]==fd[i+69]==fd[i+70]
               ==fd[i+71]==fd[i+72]==fd[i+73]==fd[i+74]==fd[i+75]==fd[i+76]==fd[i+77]==fd[i+78]==fd[i+79]==fd[i+80]
               ==fd[i+81]==fd[i+82]==fd[i+83]==fd[i+84]==fd[i+85]==fd[i+86]==fd[i+87]==fd[i+88]==fd[i+89]==fd[i+90]
               ==fd[i+91]==fd[i+92]==fd[i+93]==fd[i+94]==fd[i+95]==fd[i+96]==fd[i+97]==fd[i+98]==fd[i+99]==fd[i+100]
              ) { 
               fd[i]=0; dir[i]=-1;
               ObjectCreate("Tall"+IntegerToString(i), OBJ_TEXT, 0, Time[i], Low[i]-40*Point); 
                     ObjectSetText("Tall"+IntegerToString(i), "x"+IntegerToString(fd[i]), 26, "Impact", Cyan);
               }
 

The last subtle total eclipse is the move up of the bumper line.

As a reminder, it is a 4H 200-sample low / high displacement by 100 pips. Most tradeable lows / highs print outside this line, and they get a shaded powder box. I have been talking about the market having to go below 1.06 – and the reason was the bumper line, but it just moved up a bit and crossed the last 4H candle. 1.0613 happens to be the weekly S2 as well.

Since we are getting a well formed bottom, I would expect the market to come back beyond the Daily E-9, into the mud before the S-356 (hourly).

The width being 30.8 is greater than 27 pips, therefore the shaded area appears as a resistance zone, and most likely the continuation point would land in it before the H2 leg down.

Stylishly, Bon Jovi’s Keep The Multifaith for closing.

I took this picture during an eclipse. I was driving through California, did not know it was going to happen. Everybody pulled over, the temperature dropped like 20 degrees.

This one was another eclipse with double shadows @ my workplace in Berkeley.

What’s Gonna Work?

No one knows what will happen next.

Hoewer, here are my clues.

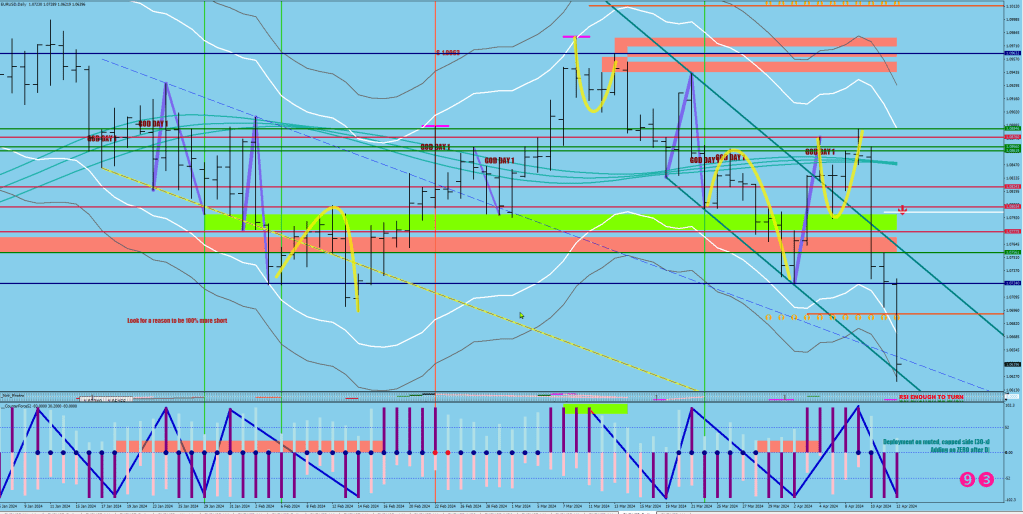
I thought we would see a Big Bow Wow, 3-7 days long and make a lower low then.

We ended up getting a Little Bow Wow, a 3x failure at Crack 4 / F1 (yellows).

My preferred route here would be a liquidity break up that is 1 or 2 days long max (93-110 pips up).

…before a lower low with a Big Bow Wow.

This is just a new Measuring leg. The Municipal channel would be an excellent place to go short.

Currently descending below the trendline at 1.0714.

There was a partial, a full discharge and a Point of No Return has printed as well. A serious stumbling block.

This looks like a support to me. Next weekly level down would be 1.0547.

We could touch the lower guard rail at 1.0715 or a bit beyond, but stay below the E9 (Green River) before turning back down.

The slower the move up would be, the lower this could tag on the downside. Probably a 3.5-4x stretch to set up the divergence.

This is Hump 2, there will be a Hump 3.

The level of interest yet again & rap references.

Weekly S3 is at 1.0527

Bring The Bow Back

Two things.

One is the coda at the end of a complex wave.

The yellow bows, that usually result in a higher high / lower low after a bow with F2 to F3– counter directional volatility at the peak of the arch are to toll on the ringer.

The second thing is the divergence I talked about is relative to the consolidation mean (as opposed to the E-9) to spot a reversal. This is difficult to measure for a number of reasons: due to the change in the 3-day ATR which is one factor, and also the multi timeframe nature of looking for the consolidation mean on a 15 min metric and charting on the 1 hour.

I went with red ovals (14 pips VS 11 pips) and as a bonus added a diamond substitute for the consolidation tying them together.

An F2 bow back could bend price to 1.0682+ before making the lower low around 1.06.