The Expiry Function

I certainly blew a fuse in the 90s when I saw the following two commercials in quick succession in New Zealand. The first one was an extremely graphic DUI, where the guy relieved over and over again the same sequence is events, where his car hits a little girl who bounces up in the air. “She was only 4 years old!” – he was bursting out repeatedly at a maximum level of distress. The collision was played back a few times in a row. Without any delay came on the second commercial which was burgers sizzling on a grill – possibly some McDonalds stuff. I had some extra appreciation for this tasteful serving as a vegetarian, yet nothing could have ptepared me for the level of morbidity that in the UK comes standard.

Euston, we have a problem.

I did not have a camera with me that day in Forest Gate. Picture a small church with a garden with crypts surrounding in every direction. Most lids are cracked, moved a bit, it is a maze virtually, hard to find a path without lots of turns from the outer gate to the building’s entrance. I just could not believe my eyes: there was a party on this burial ground with speakers, a grill flipping stand where one guy was busy producing and handing out burgers (rare to medium rare to capture the spirit of the occassion I suppose, the bloodier the better) right on top of the crypt marbles. Crammy little place this London is. If I needed more signals, later that week I saw an AD for a church that was up for rental, and I was set to write my satire about the AIR-Church&B where they speak of their best customers highly: the absolute favoutire were the Satanists, whom turned the crosses back upright and meticulously washed up the sacrificial blood from the floors before handing back the keys.

Back to trading

What’s the Expi-rationale behind Expriration? TIME (& weakness).

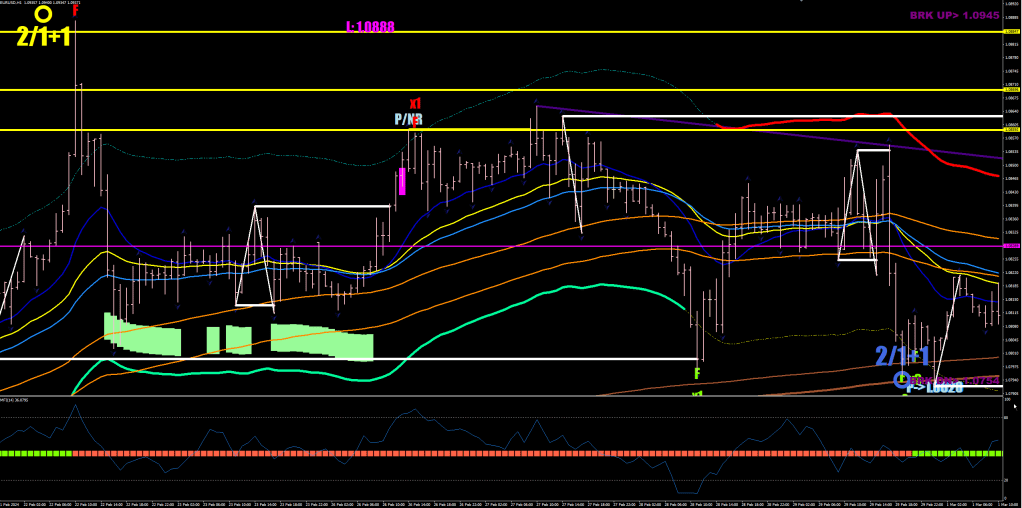
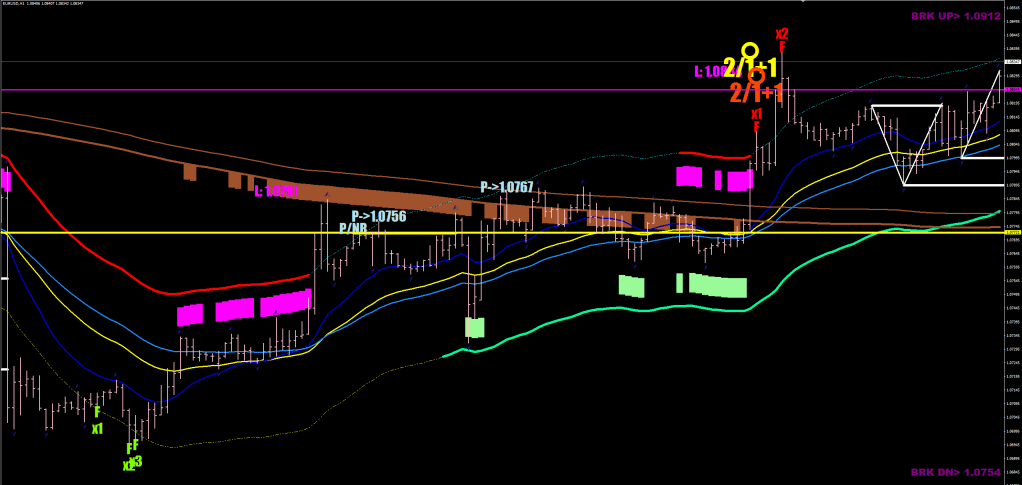
Just as the Loneliness Correction taking 16 hours and the Disregard Correction taking 21 hours, the Weak Trend gets cancelled in 35 hours (70* 30 minutes) when not making any progress beyond the Safety Line’s shield. See below the flip back from weak uptrend to strong downtrend.
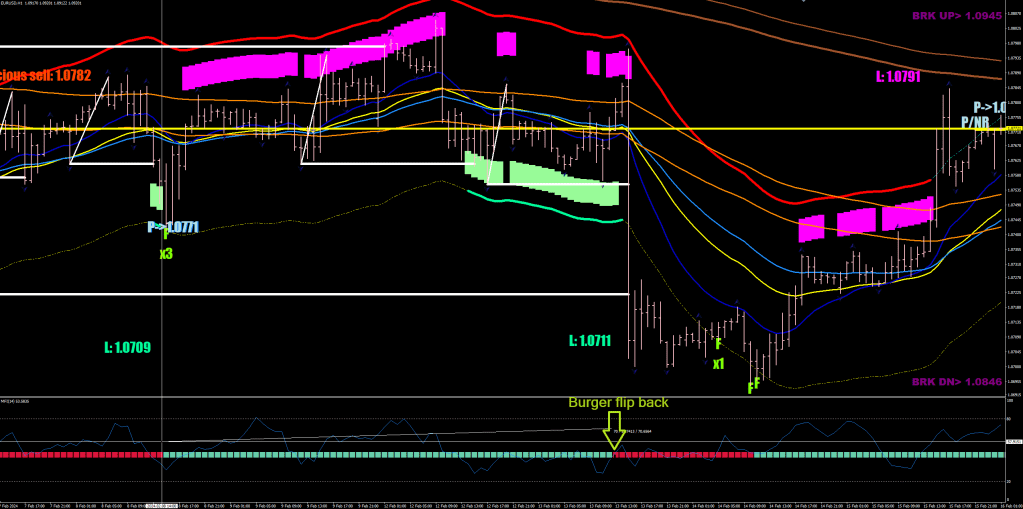
    
///Direction Flip Back Down For No Strength (Safety - 5 pips )

if (fd[i+71]==2 && fd[i+70]==3

&& High[i]<HighBuffer[i] && High[i+1]<HighBuffer[i+1] && High[i+2]<HighBuffer[i+2] && High[i+3]<HighBuffer[i+3] && High[i+4]<HighBuffer[i+4] && High[i+5]<HighBuffer[i+5]&& High[i+6]<HighBuffer[i+6] && High[i+7]<HighBuffer[i+7] && High[i+8]<HighBuffer[i+8] && High[i+9]<HighBuffer[i+9] && High[i+10]<HighBuffer[i+10]
&& High[i+11]<HighBuffer[i+11] && High[i+12]<HighBuffer[i+12] && High[i+13]<HighBuffer[i+13] && High[i+14]<HighBuffer[i+14] && High[i+15]<HighBuffer[i+15]&& High[i+16]<HighBuffer[i+16] && High[i+17]<HighBuffer[i+17] && High[i+18]<HighBuffer[i+18] && High[i+19]<HighBuffer[i+19] && High[i+20]<HighBuffer[i+20]
&& High[i+21]<HighBuffer[i+21] && High[i+22]<HighBuffer[i+22] && High[i+23]<HighBuffer[i+23] && High[i+24]<HighBuffer[i+24] && High[i+25]<HighBuffer[i+25]&& High[i+26]<HighBuffer[i+26] && High[i+27]<HighBuffer[i+27] && High[i+28]<HighBuffer[i+28] && High[i+29]<HighBuffer[i+29] && High[i+30]<HighBuffer[i+30]
&& High[i+31]<HighBuffer[i+31] && High[i+32]<HighBuffer[i+32] && High[i+33]<HighBuffer[i+33] && High[i+34]<HighBuffer[i+34] && High[i+35]<HighBuffer[i+35]&& High[i+36]<HighBuffer[i+36] && High[i+37]<HighBuffer[i+37] && High[i+38]<HighBuffer[i+38] && High[i+39]<HighBuffer[i+39] && High[i+40]<HighBuffer[i+40]
&& High[i+41]<HighBuffer[i+41] && High[i+42]<HighBuffer[i+42] && High[i+43]<HighBuffer[i+43] && High[i+44]<HighBuffer[i+44] && High[i+45]<HighBuffer[i+45]&& High[i+46]<HighBuffer[i+46] && High[i+47]<HighBuffer[i+47] && High[i+48]<HighBuffer[i+48] && High[i+49]<HighBuffer[i+49] && High[i+50]<HighBuffer[i+50]
&& High[i+51]<HighBuffer[i+51] && High[i+52]<HighBuffer[i+52] && High[i+53]<HighBuffer[i+53] && High[i+54]<HighBuffer[i+54] && High[i+55]<HighBuffer[i+55]&& High[i+56]<HighBuffer[i+56] && High[i+57]<HighBuffer[i+57] && High[i+58]<HighBuffer[i+58] && High[i+59]<HighBuffer[i+59] && High[i+60]<HighBuffer[i+60]
&& High[i+61]<HighBuffer[i+61] && High[i+62]<HighBuffer[i+62] && High[i+63]<HighBuffer[i+63] && High[i+64]<HighBuffer[i+64] && High[i+65]<HighBuffer[i+65]&& High[i+66]<HighBuffer[i+66] && High[i+67]<HighBuffer[i+67] && High[i+68]<HighBuffer[i+68] && High[i+69]<HighBuffer[i+69] && High[i+70]<HighBuffer[i+70]

&& HighBuffer[i]!=EMPTY_VALUE
) dir[i]=-1;

I’d say the start of the correction was no coincidence. The yellow line is a previous P/NR, the darker green field is the highlight of the dip into the Municipal Trench and the lighter green field is the shield of the lower Safety Line.

If you needed any more confluence two more conditions triggered the same time. The aforementioned MFI oversold hand in hand with the 120-sample stoch dipping back below the 50-line for the first time.

What kind of a correction was this?
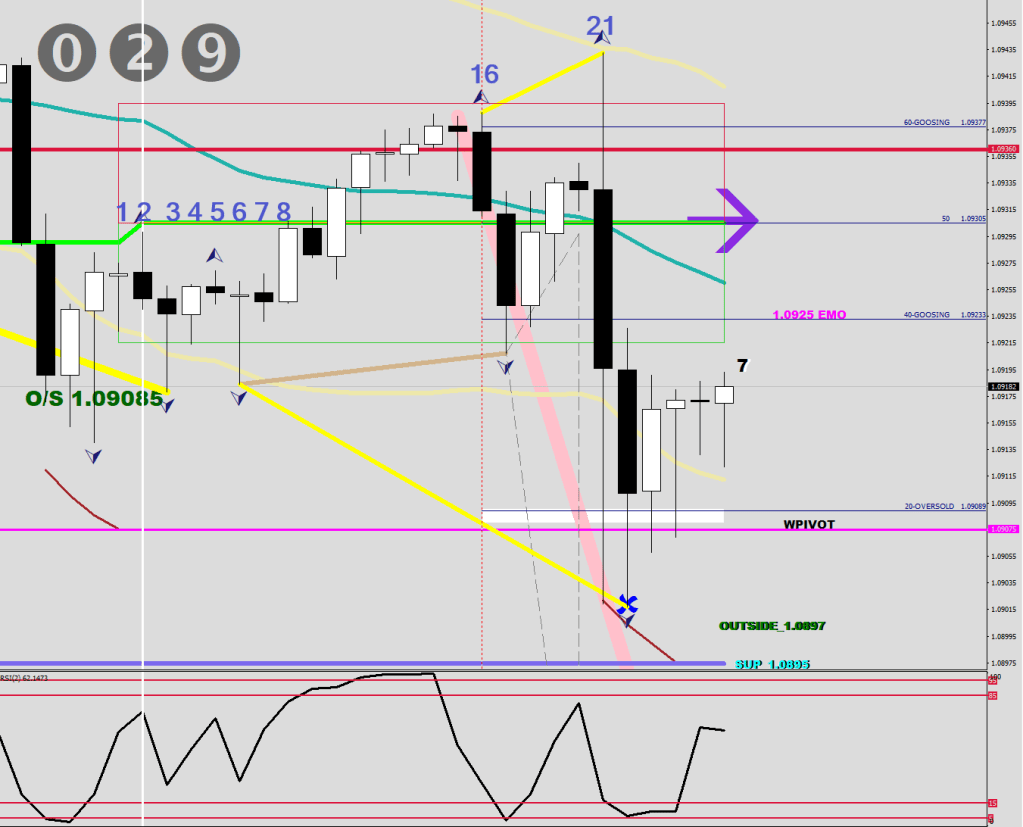
Well, if it had stopped at the 16th hour, it would had been a Loneliness correction, but since it went to 21, this was a Disregard correction. (It is not obvious, but price went up first on candle 21.) The difference is the degree of cooling down. A Disregard can be the origin of a more potent move, so this wold mean a New Wave over a New Leg.

I know why you are here. The auto trading stuff.

I have made 3 different EAs this year, the Municipal Trader, the W3 trader and the W3 + F3 trader.

I have been talking about what a loss of potential limiting the position size at 100 lots per trade was.

I have started feeding some volume to the weakest of the 3 routines based on bottom line score for the same period, the W3 trader.

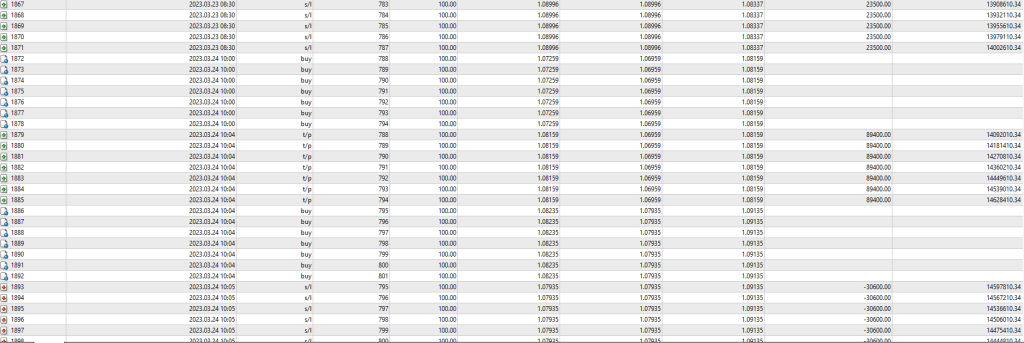
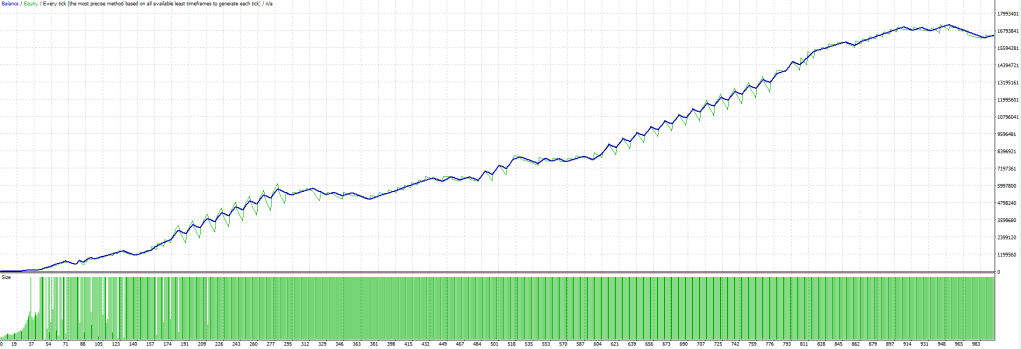
It was made to open maximum 2 longs and 2 shorts. Now I allow multiple chunks for one of the longs and one of the shorts for up to 1000 lots total. I’d say I opened up the volume faucet to about 60 percent, just to get a better idea about its potential.

I figured 10 million was attainable. The reality?

All of a sudden a $499 price tag for an ex4 seems like a joke. I am not in a kidding mode, I would sell one source code for $49k (one of the three, and nothing more) and not take all of my secrets with me and the same time not giving fuel to the next generation of scammers.
Nightshapes

Warning! The previous blog entry has high Lectin content. You might want to talk to somebody about the role of Butyrate trading.

There is 50 shades of red, but I only care for 2.

The pale one is a weak downtrend. It means that price is still above the S-356 where it has to prove itself to be upgraded. How? By failing to make a bottom, failing to make F (full discharge) prints.

When a Tomato relapses (most likely by the hands of the Municipals), the restart would come from the upper Safety line – see below.

This one failed the Municipal Trench, ricocheted to the 2.8 Safety and hammered out a bottom at the S-356 in a rather volatile manner, getting a third start just shy of the Safety.

The directional logic is the feature of the Axel S V1.6

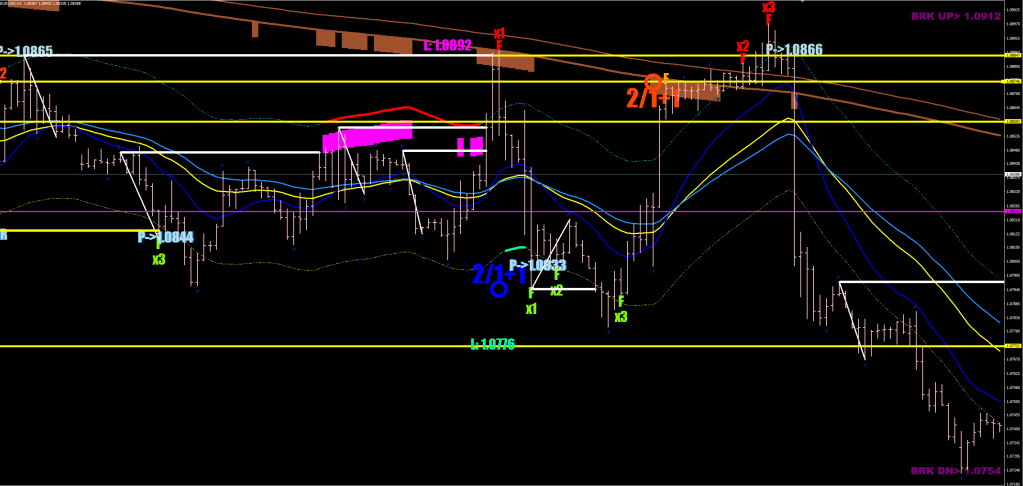
This one below went into a stong downtrend in 4 hours, as it had no hope of making a bottom above the S-356 band.

The following example shows a failure to make a top and a weak uptrend receiving an upgrade to a strong one.

You can see the same thing in reverse: the great scare of the Lower Safety line as well as finding support in the Municipal Trench (aiding the coast through the S-356).

Oh snap, juglling with 4 colours now?

I don’t know & I don’t understand why can’t a man be a man.

In other news, in a moment of weakness I added F3 fades to the W3 trader & ran a backtest.

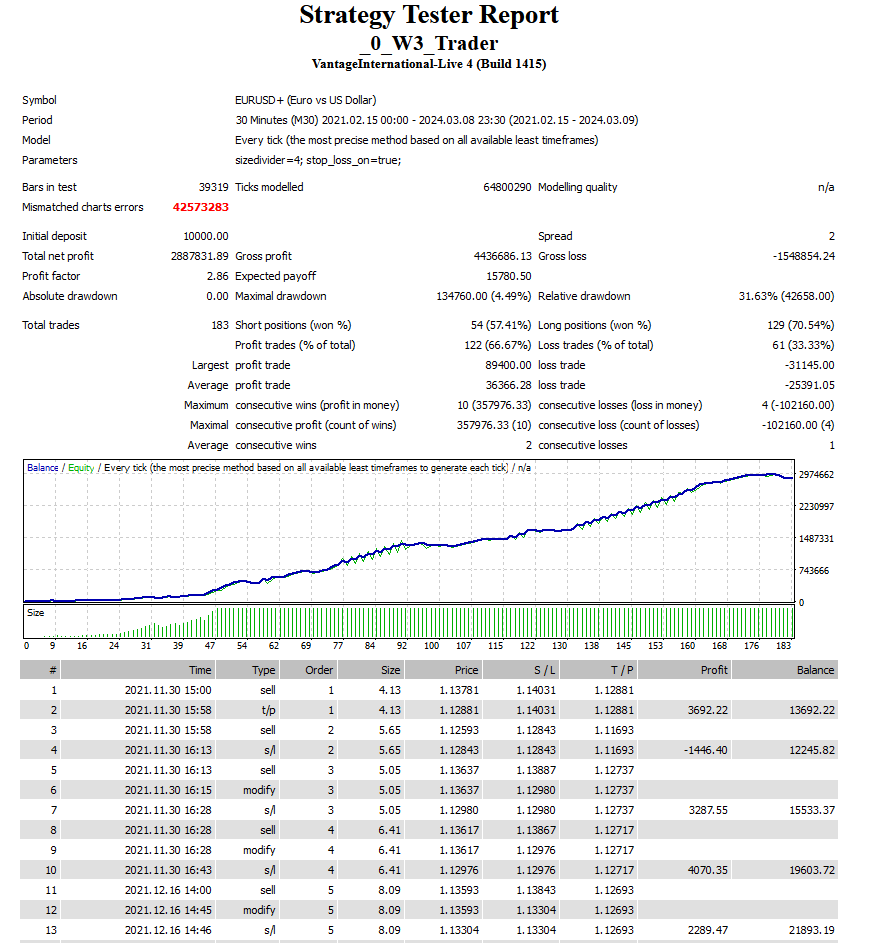
As a reminder, this is what the W3 could score (without lot size increase beyond 100 lots) from the 30th of November, 2021.

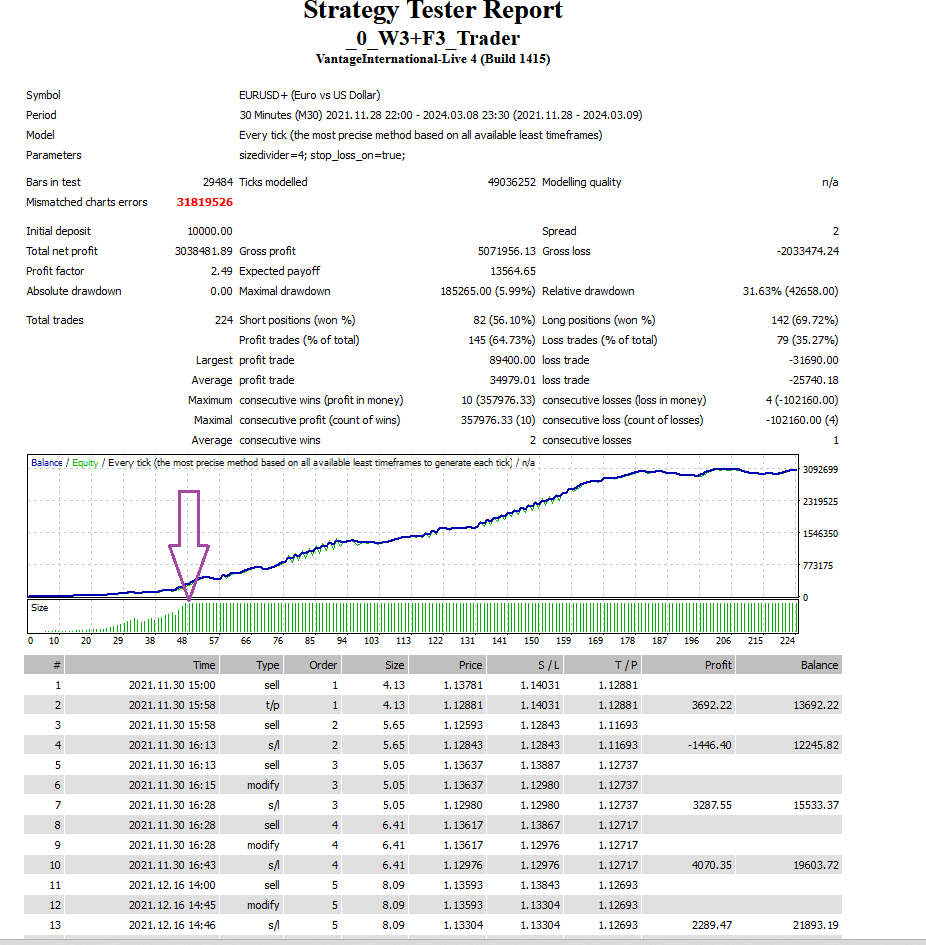
& this is what the W3 + F3 combo could achieve during the same period:

It seems to get increasingly hard to push far beyond the 3 million barrier within 2 years when the maximum lot size for a single position is capped by the broker at 100 lots. (I got to 3.65 million with a version of the Municipal trader once.)

Can you guess what my next move would be?

I am not going to investigate how to optimize the F3 fade, it would be too costly in time and may not be worth the effort. Also, I design these auto trading routines as complementers for hybrid trading where I would only call for the long side help and instead of being at mercy of the broker for spread changes, no stop losses would be applied, instead a gradual 3-step hedging would be implemented.

Changes Are Daunting

Are you getting the interaction blues?

I am teaching you in black and white the concepts of apples to roses from dawn to dust.

So yeah, this ended up becoming a triple divergence after price having made it again into the W3 box yesterday (sequel rights purchased).

Pay attention to how the 120 stochastic never left the overbought field (remained in embedding).

Instead of yesterday, today became the day to scale out of longs and go short beyond the yellow Goldilocks level, but before the W3 orange thingy.

Fridays can be tricky. This one is not a major Opex and the Euro Max pain was 102.

They certainly made an effort. Fridays are a big handicap of mine.

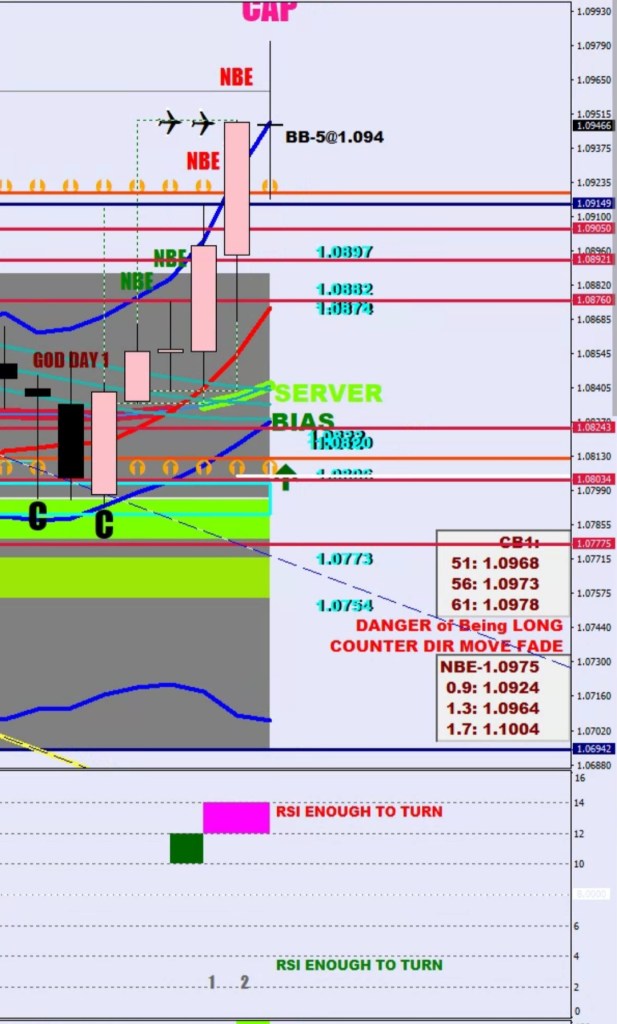
Closing on the high yest (within 25 pips) would have always called for a higher high next day, but now the Cap also qualifies as a Capitulation.

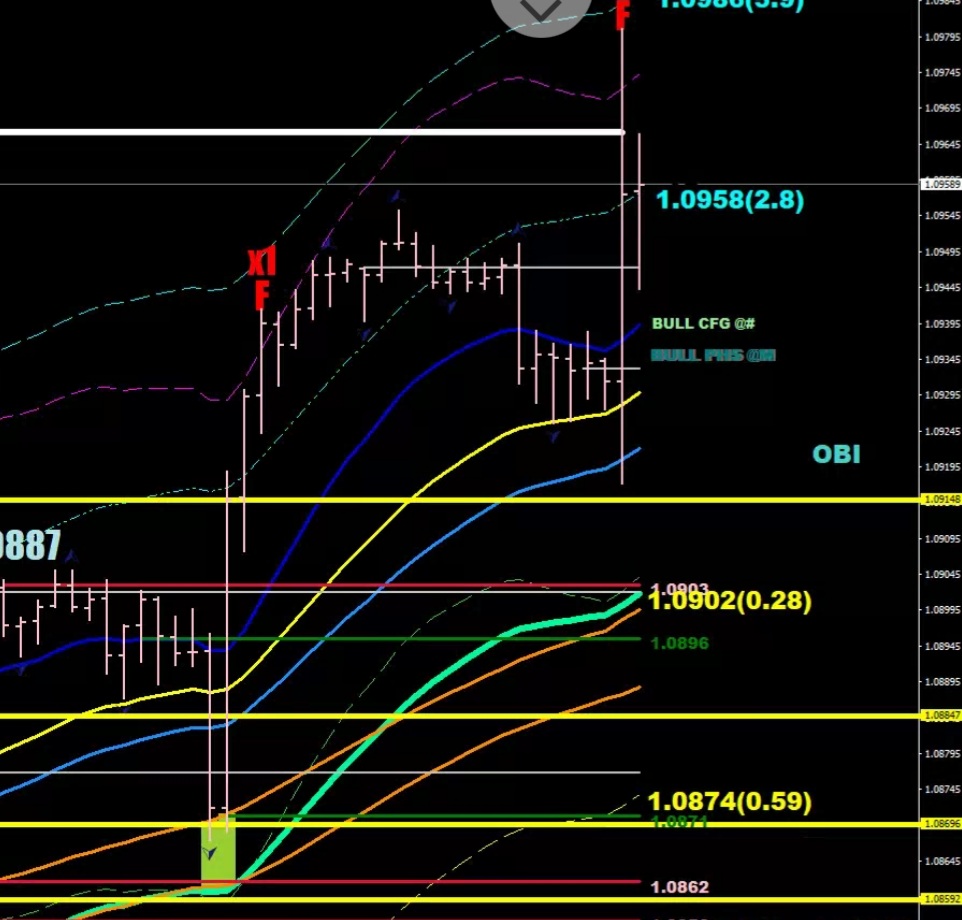
This was the 2nd F. The third one does not have to be a higher high, just has to get back and fail above the upper safety line (2.8)

Figuring Out The W3 Divergence-Level

There wasn’t much to figure on the go long condition: with upwards wind the municipal trench got dipped into. The other 2 possible conditions, the 120 stoch dip below 50 or the MFI going oversold did not occur.

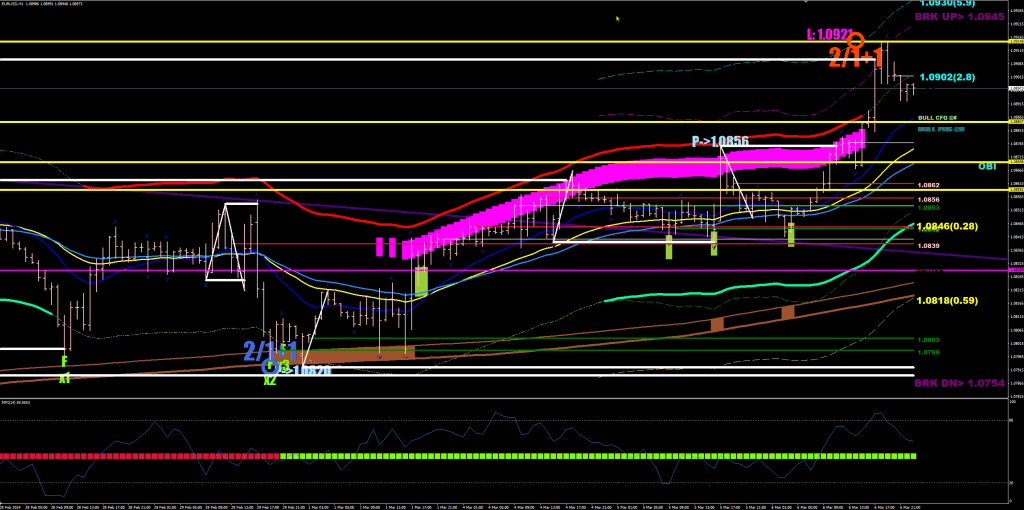
Now, since the previous day went into the W3 orange box (and carefully missed the far end by more than 5 pips to signal wanting to continue after a consolidation), there is a second roll on the dice.

A divergence would look like this: a stop before the new W3 box.

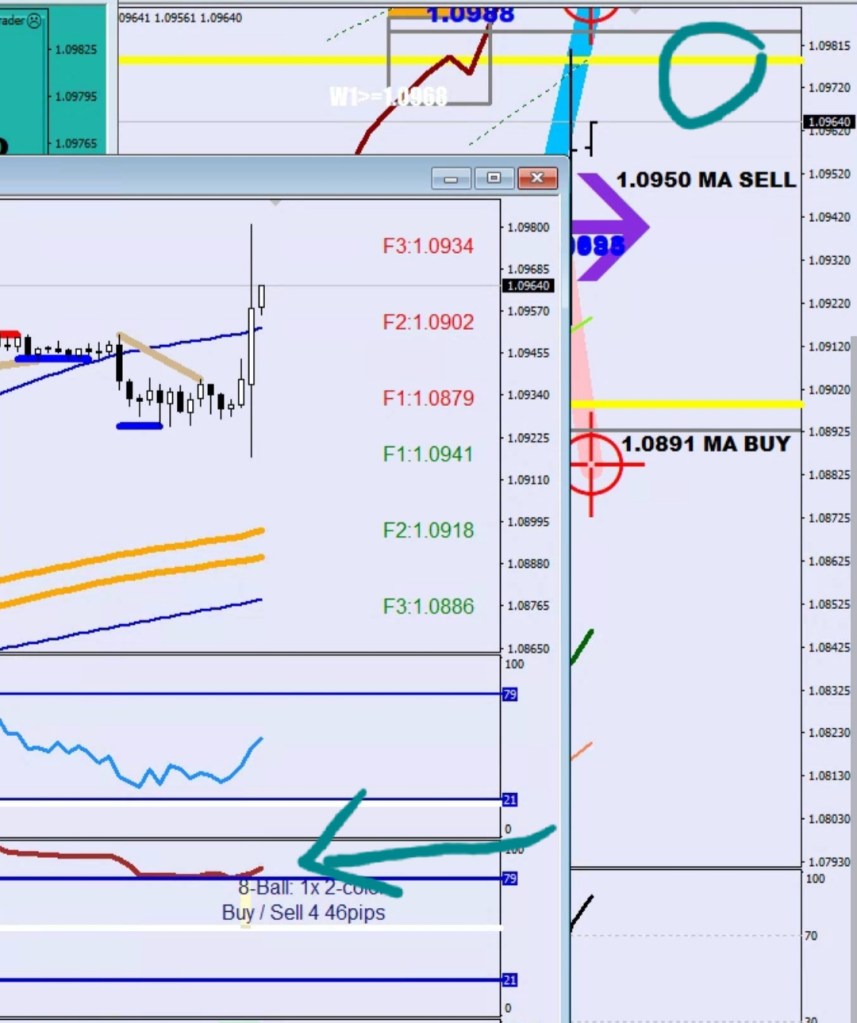
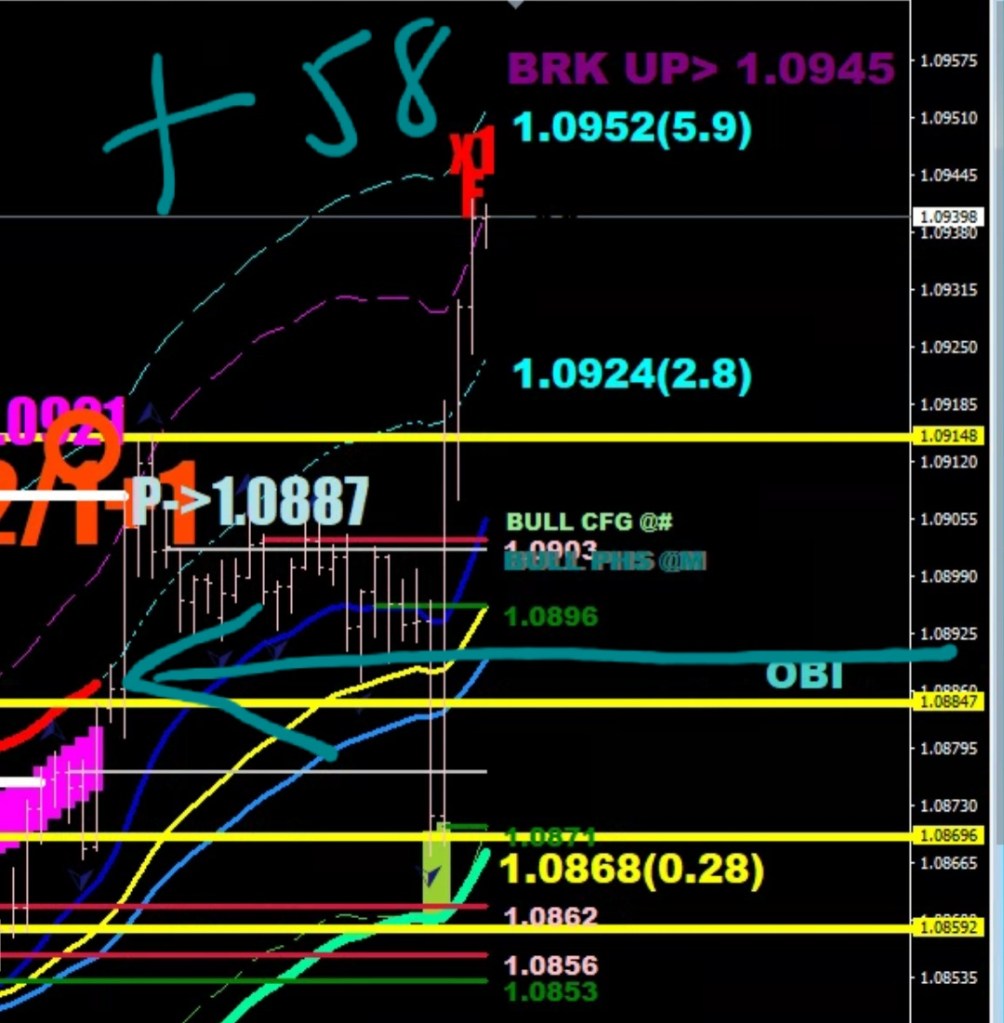
Since the close end of the box is at 1.0948, the Goldilocks level is ten pips closer. You want to be scaling out between these two numbers.
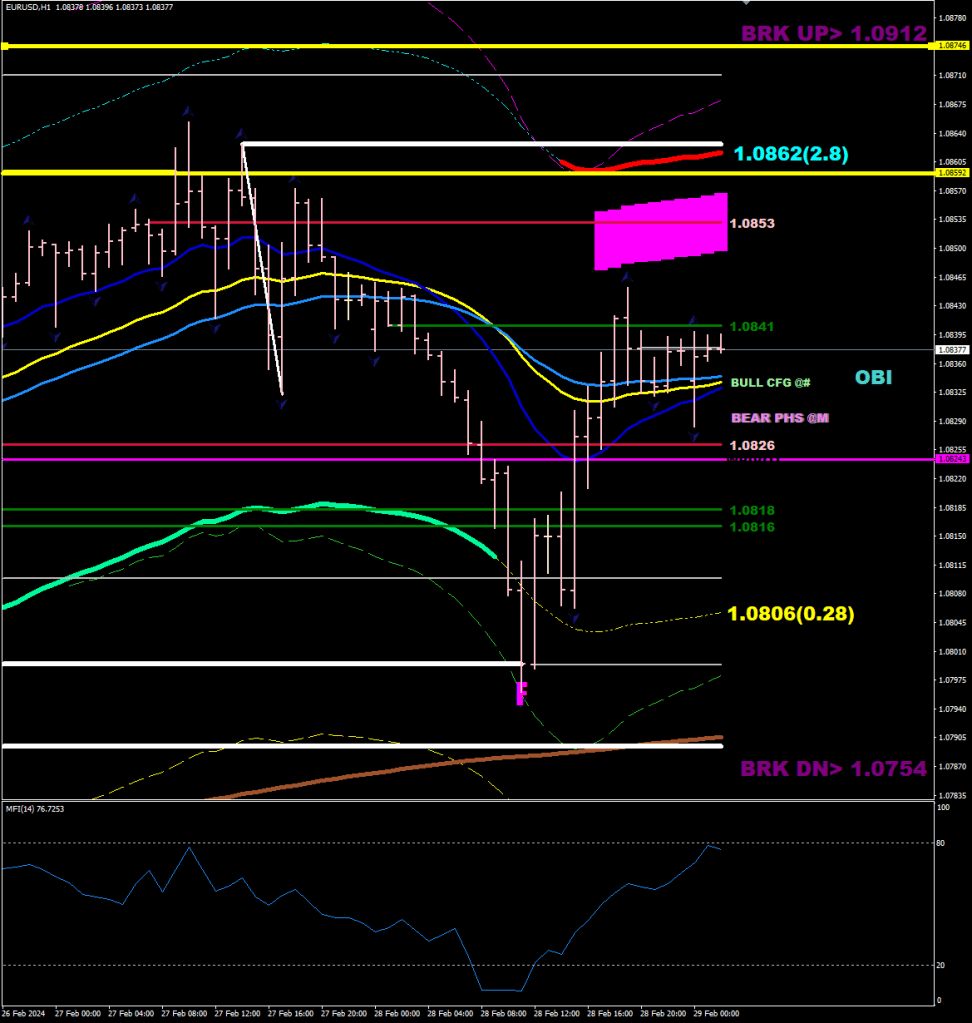
Goldilocks is in yellow.

There is a limit defined by the event of tripping over the upper safety line 58 pips out. This comes in at 1.0945.

All of these numbers have been settled for at least a day.

The money flow reversal’s trip over level is 1.0947 – you would like to see it go untoched.

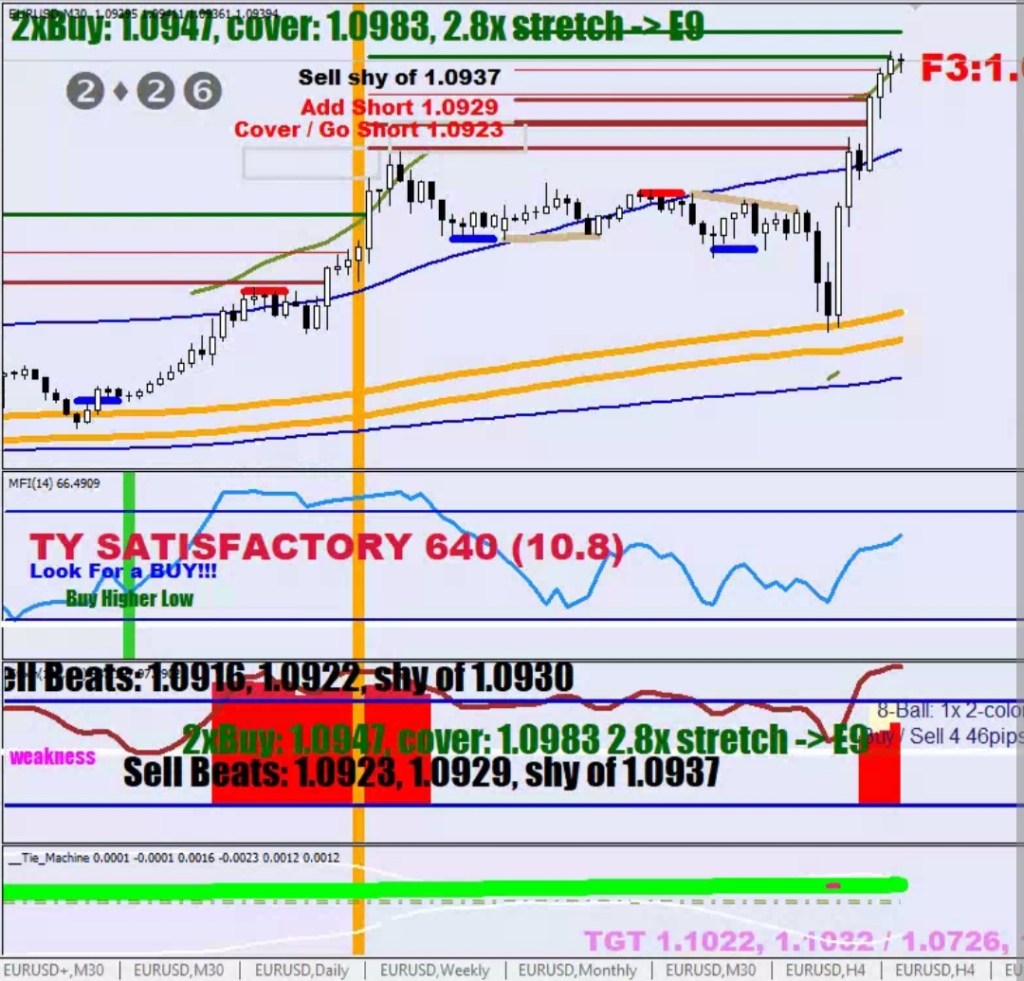
During the measuring leg the 2x buy level got tripped over, but price only made it to the first mile stone at 16 pips out before the correction.

It would be logical that the divergent leg would miss the 2x buy level for it would have to display relative weakness.

Why the divergence? Because this is an ABC correction up. The daily RSI2 got into the reversal zone gor the 2nd time, see Nick Rhodes.

What’s next? The lower safety line could be re-visited or undercut by a statistical 34 pips for a leg down.

The weekly R1 has been at 1.0944 for the last 3 weeks (see QuarterLoo). Perfect spot to end a Wave 2.

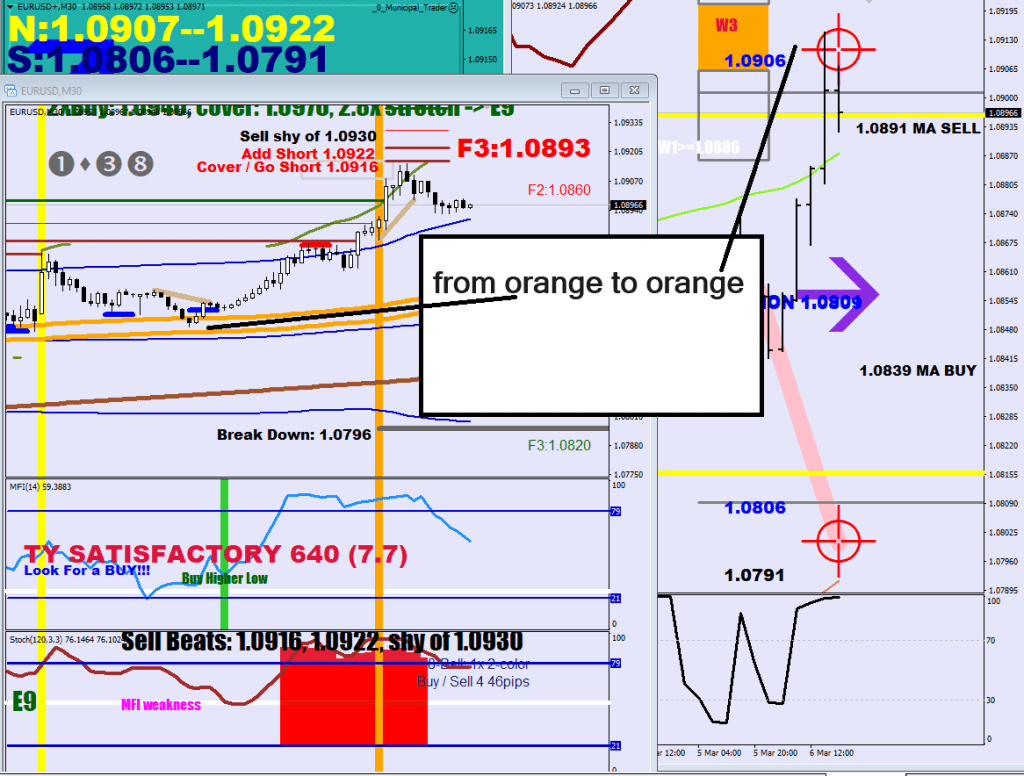
From Oranges To Oranges

If you had undergone forex training and you were thought anything else than the following:

“Forex trading is about the Municipals with wind beneth their backs targeting the W3 box”

you should demand your money back.

The Municipal Trench is the E-207 High to Low band on the 30-minute and for the 1H I use the E-103.

The Wind is blowing from the 3rd F (F x3), as you can see on the directional plot below.

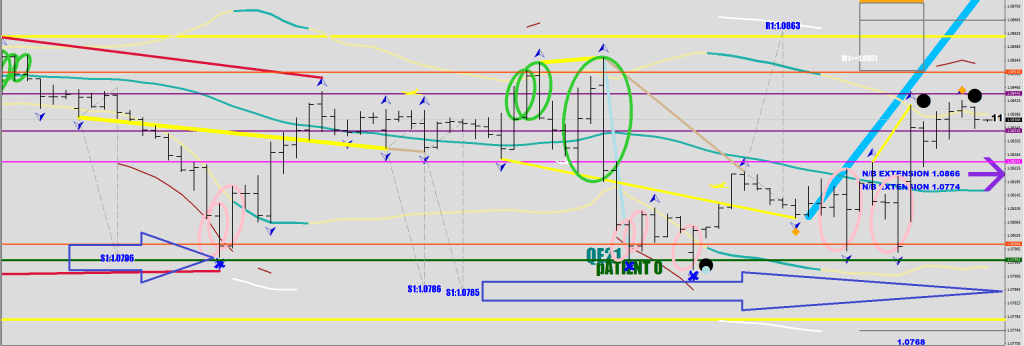
The W3 box is the 3-day ATR to 1.3x 3-day ATR distance measured from the last consolidation mean (purple arrow). The 15-Min ATR PRO is available for free in the downloads, and the Axel S has its latest free version, the 1.3 there as well.

I had to adjust tolerance on the Green (counted) F-s to 10 pips above the E-356 band.

 /////full down
if (i>0 && (High[i]>AxelL[i]&& Close[i]<AxelL[i]+50*Point
&& (Close[i+1]>AxelL[i+1] || Close[i+2]>AxelL[i+2]) && Low[i-1]>Low[i])
|| (Low[i]<AxelL2[i]) && Close[i]>AxelL[i]+100*Point)
{
ObjectCreate("Talz"+IntegerToString(i), OBJ_TEXT, 0, Time[i], Low[i]+20*Point);
ObjectSetText("Talz"+IntegerToString(i), "F", 26, "Impact", Yellow);
if (Low[i]<e16d2[i+1]) ObjectSetText("Talz"+IntegerToString(i), "F", 26, "Impact", Magenta);
if (Low[i]<iMA(symbol,0,356,0,MODE_SMA,PRICE_HIGH,i)+100*Point) {ObjectSetText("Talz"+IntegerToString(i), "F", 26, "Impact", Chartreuse);

fd[i]=fd[i+1]+1; if (fd[i]>3) fd[i]=3; if (fd[i+1]==3) fd[i]=1;
ObjectCreate("Tall"+IntegerToString(i), OBJ_TEXT, 0, Time[i], Low[i]-40*Point);
ObjectSetText("Tall"+IntegerToString(i), "x"+IntegerToString(fd[i]), 26, "Impact", Chartreuse);
if (fd[i]==3) dir[i]=1;
}

The directional logic is the best one anywhere currently, heavily relying on the triple Fs.

Not sure how this could be turned to bearish (turn wind direction) quickly, as the count is currently still Zero.

You should buy the 120-sample stochastic (30 min) dipping below 50 or the MFI going oversold or price dipping back into the Municipal channel, rinse and repeat until the 3rd F prints.

Prior to Having Priorities

aka Knee Jerk at your leisure or Russell & the carousel or Ruth becoming ruthless.

Growing a bit impatient here with having all.answers at my disposal yet still forgetting to raking it in. The last piece of the hustle is putting together the puzzle.

I pointed out the Triple F.

I have called the dip inside the Municipal channel a condition. Yet I set my mind to look for a relief condition.

///Municipal dip
if (i<100 && Low[i+1]<iMA(symbol,0,103,0,MODE_EMA,PRICE_HIGH,i+1) && Low[i+1]>iMA(symbol,0,103,0,MODE_EMA,PRICE_LOW,i+1) && Close[i+1]>iMA(symbol,0,103,0,MODE_EMA,PRICE_HIGH,i+1) && Low[i]>Low[i+1]) {
MuniH[i+1]=iMA(symbol,0,103,0,MODE_EMA,PRICE_HIGH,i+1); MuniL[i+1]=iMA(symbol,0,103,0,MODE_EMA,PRICE_LOW,i+1);
}

I have the MFI reversal zone auto plotted. Nobody else has all of these things down.

It would cost me nothing to take on a full hedge, yet I am refusing to do it.

Every 10-pip would make $650 without overhedging. 20 pips would top the best daily result this year (>$1215).

So from here on I’ll take my chances, as God has stopped keeping score.

Good luck & gridlock. This is the year of the healthy man.

False Premises

I just want you to know that noone leaves through the door they enter.

So, no incentive to gap it just yet.

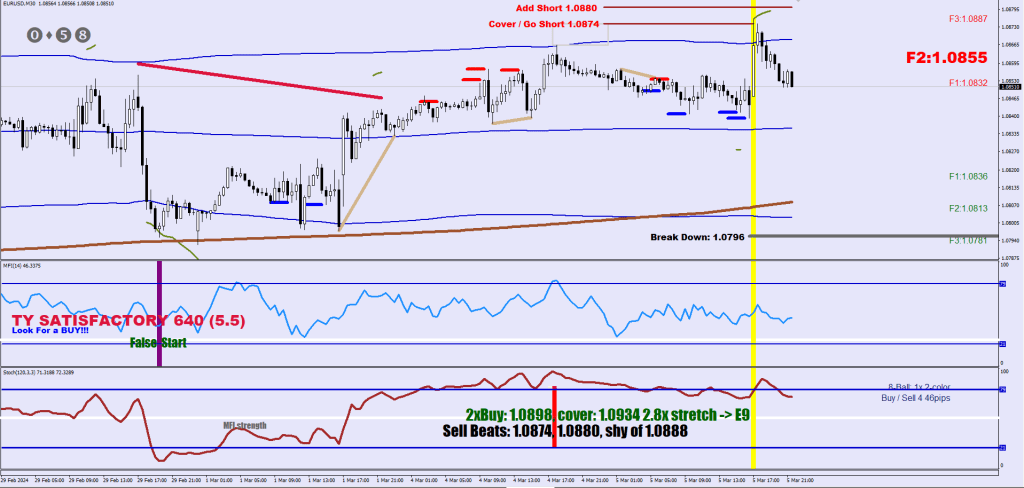
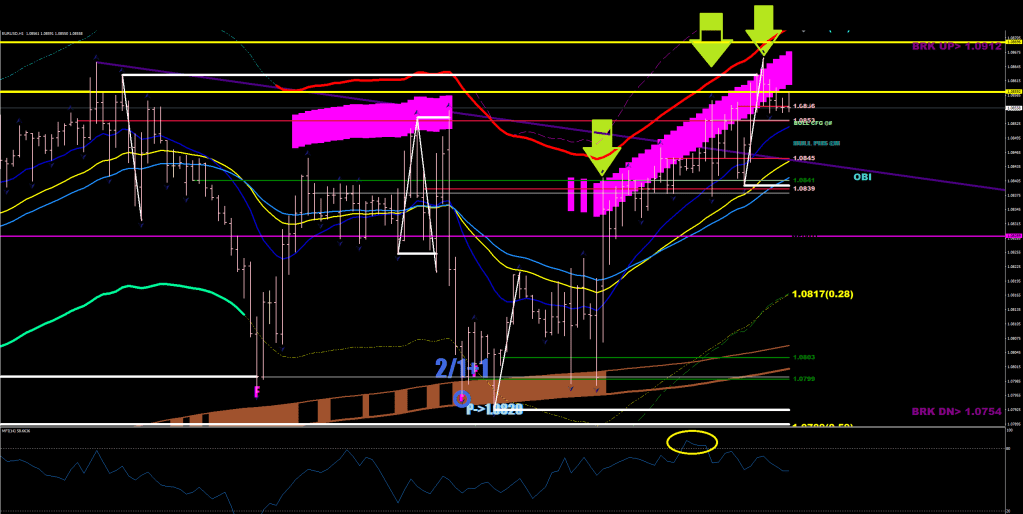
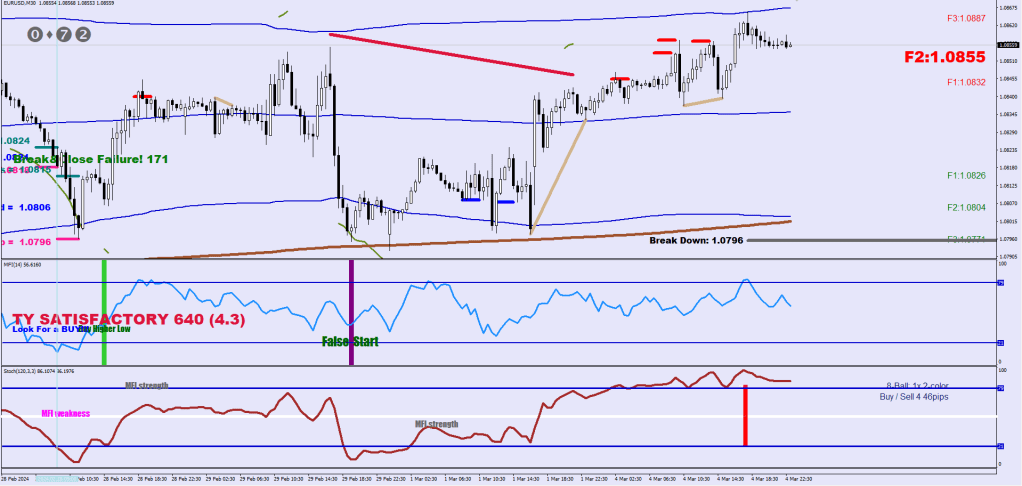
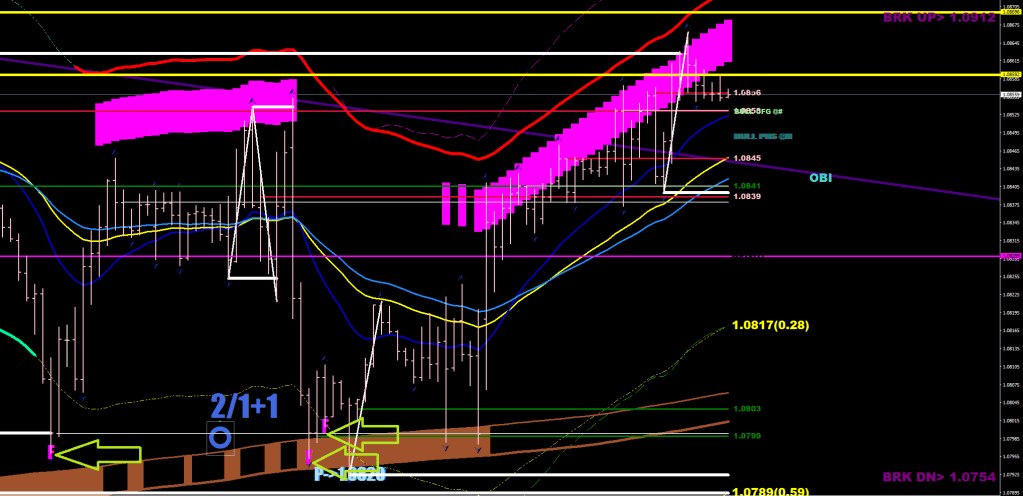
After the 3 F prints = Condition the market went for the Level, or 1.0865 (F2++).

The buying got embedded, the money flow got some boost right at the trendline (purple line, yellow oval) and the break up was on (in a bit volatile manner). The magenta field got exceeded on 3 different occassions (G1, G2, G3?) and a correction to a Relief condition is due (120 sample stoch back to 50 read or 14-sample 30-minute stoch getting more oversold than the recent low reading = continuation divergence), but I would not consider this to be a high probability trade, since we are in the reversal / sell zone yet again, between the Point of No Return yellow lines, the thick of it. No spinner / new money flow reversal zone has been printed due to lack of distance from the low and the lack of 200-sample high.

Talking about conditions, the Money Flow should always precede the Stoch 120 in getting overbought / oversold, otherwise a False Start call has to be made, and a short term reversal divergence should take care of the rest.

       //sudden oversold Stoch w/o MFI = False Start
if (iFractals(symbol,0,MODE_LOWER,i) && mfi[i]>38 && Stoch[ArrayMinimum(Stoch,3,i)]<10 && Low[i]>iMA(symbol,0,712,0,MODE_SMA,PRICE_MEDIAN,i) )
{
ObjectCreate("Creepy"+IntegerToString(i),OBJ_VLINE,1, Time[i], 0);
ObjectSet("Creepy"+IntegerToString(i),OBJPROP_COLOR,clrPurple );
ObjectSet("Creepy"+IntegerToString(i),OBJPROP_WIDTH,9);
ObjectSet("Creepy"+IntegerToString(i),OBJPROP_STYLE,STYLE_DOT);
ObjectSet("Creepy"+IntegerToString(i),OBJPROP_BACK,1);
ObjectCreate("Creepyy"+DoubleToStr(i), OBJ_TEXT, indicator_window, Time[i+1], 30);
ObjectSetText("Creepyy"+DoubleToStr(i), " False Start", 18, "Impact", DarkGreen);
}

Clearly, 3Fs matter more than anything else even if no counter is being added above the S-356.

Der Wish

Continued intricacies of the Der Wish Market Model. (Axel S V1.5)

The “Net” or The Mac line is actually a Mac Band.

From above the Upper Half would come into contact.

 if (i<100 && Close[i]<iMA(symbol,0,356,0,MODE_SMA,PRICE_MEDIAN,i) && Close[i+1]>iMA(NULL,0,44,0,MODE_EMA, PRICE_MEDIAN,i)) {
MacHigh[i]=iMA(symbol,0,356,0,MODE_SMA,PRICE_MEDIAN,i); MacLow[i]=iMA(symbol,0,356,0,MODE_SMA,PRICE_LOW,i);
}

if (i<100 && Close[i]>iMA(symbol,0,356,0,MODE_SMA,PRICE_MEDIAN,i) && Close[i+1]<iMA(NULL,0,44,0,MODE_EMA, PRICE_MEDIAN,i)) {
MacHigh[i]=iMA(symbol,0,356,0,MODE_SMA,PRICE_HIGH,i); MacLow[i]=iMA(symbol,0,356,0,MODE_SMA,PRICE_MEDIAN,i);
}

From below, the Lower Half.

The S-356 band is a net not unlike what you would see at a tennis court.

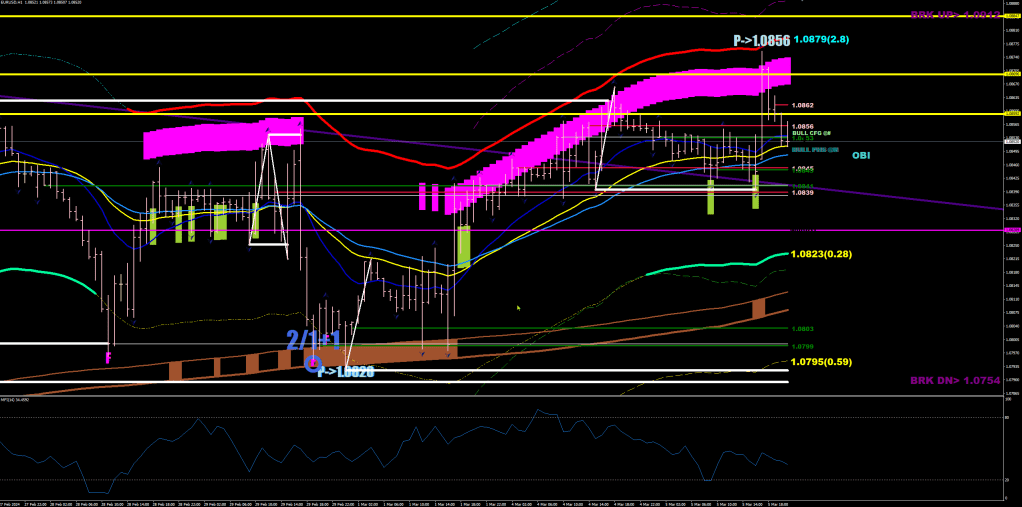
That said, if you go back to the first image, you would realize that the pressure is being applied from ever closer, thus a rip through the fabric is becoming ever more likely. Thanks to the movement of the E-32, the attack is coming from the “same place” (magenta field) , but in absolute term from a lower price. We now should see a move culminating in a Green Fx1 print.

S1 has been getting pushed back little by little.

If the net just does not want to give, there’s always after hours for the market maker to interfere if that is where the profit lies. An open below the new S1 = problem solved.

Quick Geek

Read if you are into context, candles and oscillators.
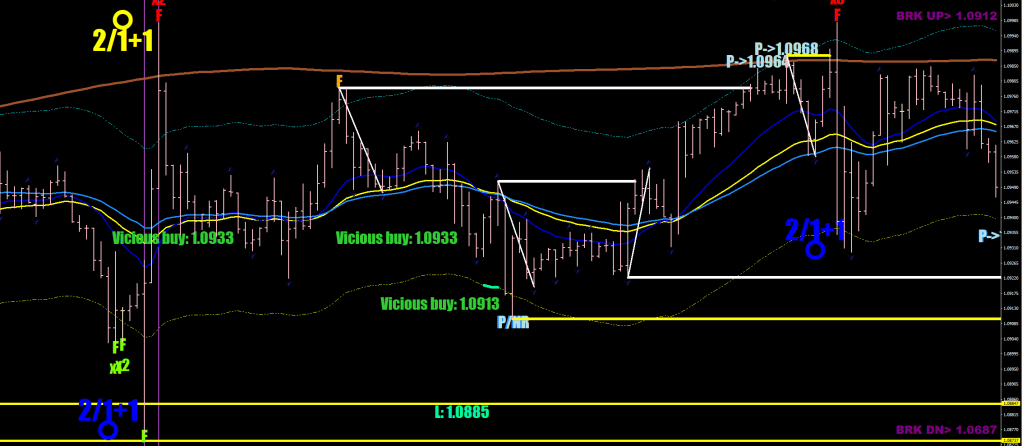
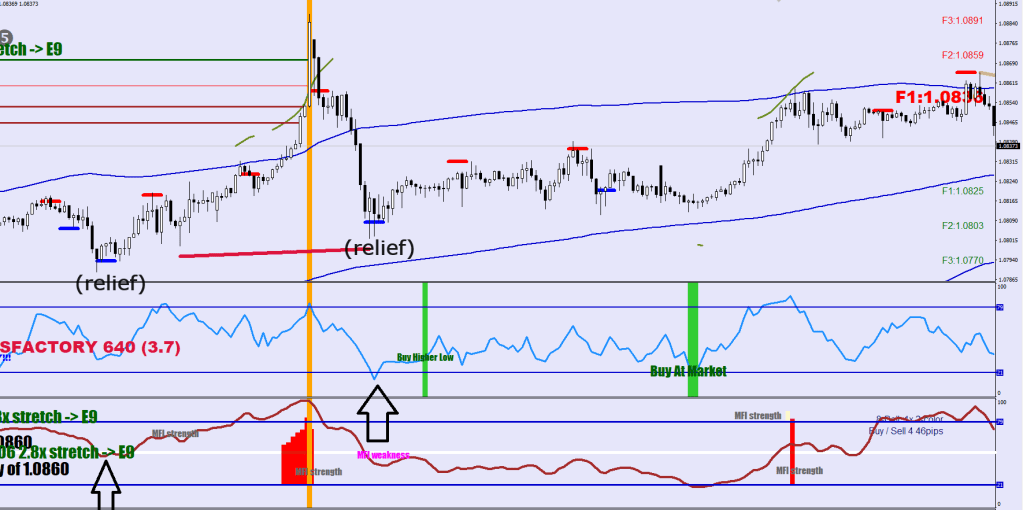
Let’s train your eyes to spot reliefs (re-calibrations).

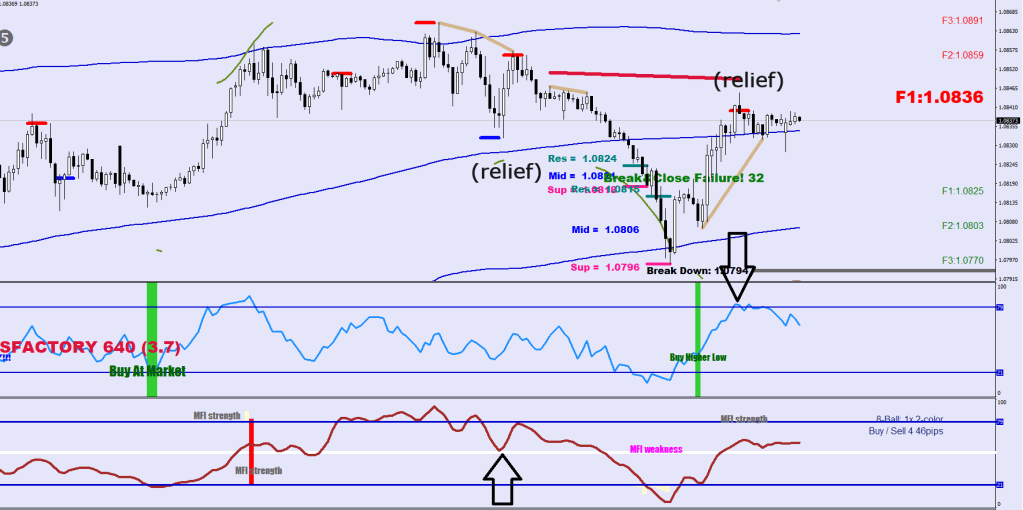
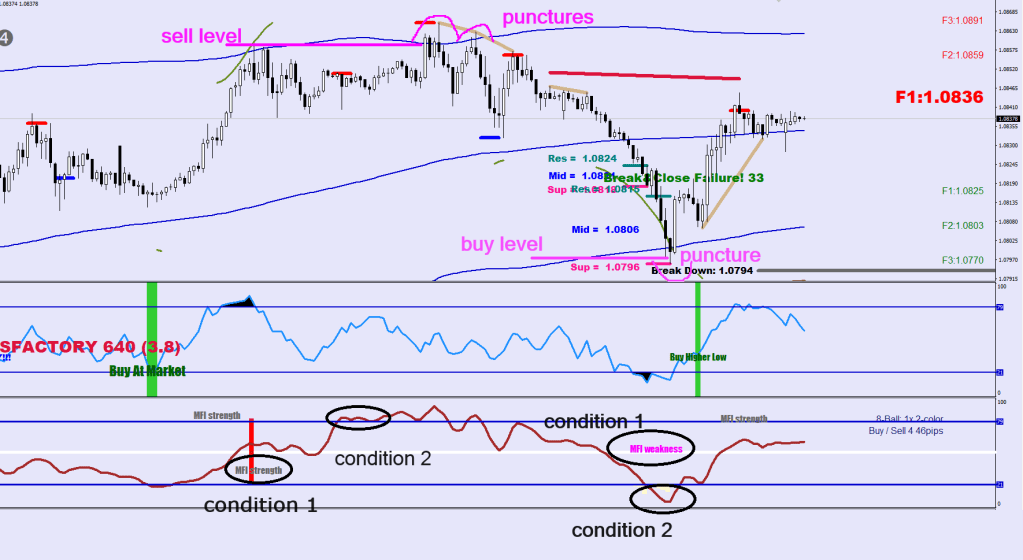
A relief is your 120-sample stochastic returning to the 50 level or your 14-sample MFI hitting an extreme opposite of the trading direction.

The combination of an MFI strength (/weakness) and a Stochastic strength (/weakness) provides with a level.

The puncture of this level is the action.

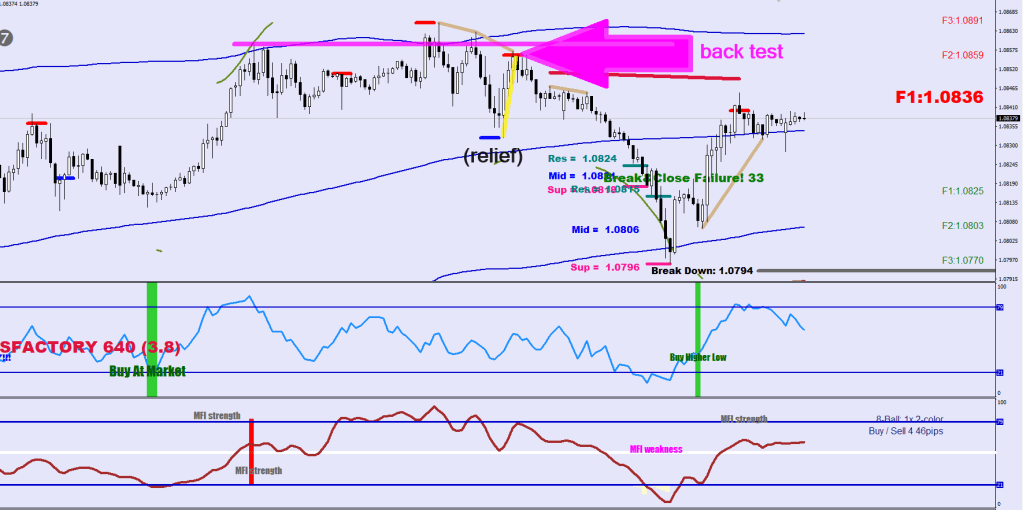
The most important thing on this chart is the yellow diagonal: after the relief the move back up was sold at will resulting in a lower high and a change of direction.

From here on the levels are provided by the conditon combos + punctures and the reliefs would occur on the upside until an MFI reversal zone would be printed and tested.

The interrupted green line is the E-16 displaced by 35 pips. The volatility expansion was too sudden, and this relief move back up is the punishment for it.
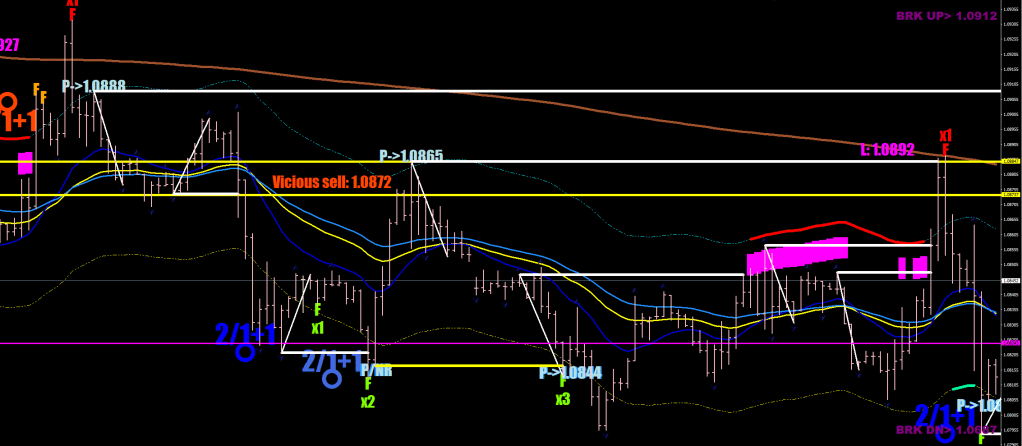
Vicious Love

Updates of the Axel S V1.5.

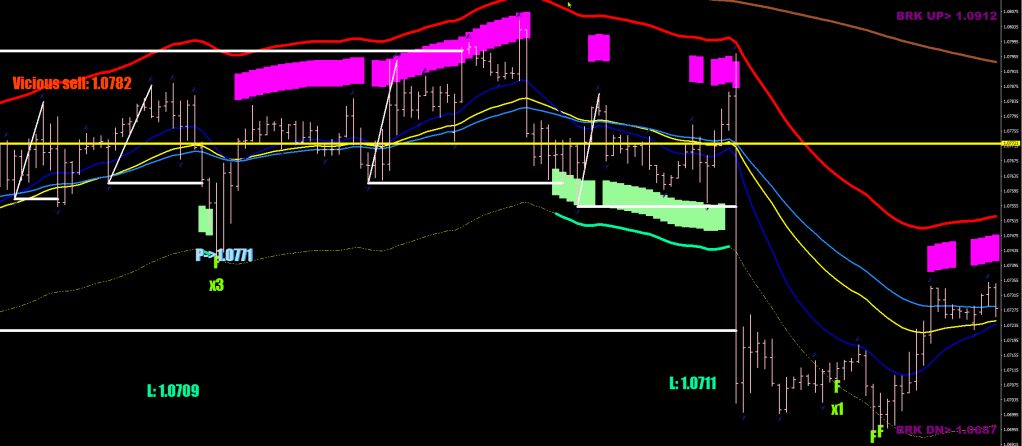
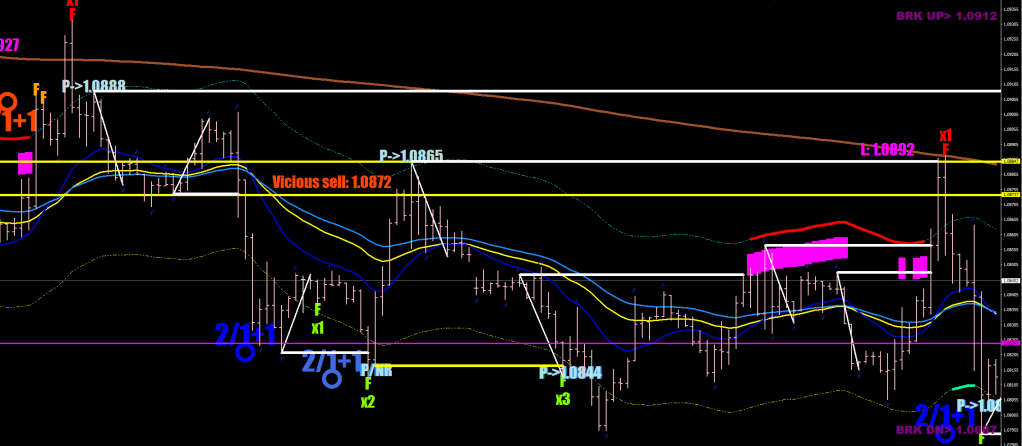
With the advent of the F counters, there are new possibilities afoot.

For instance, after a x2 print, you don’t expect price to relapse much before going for the last enchilada.

Thus, the Vicious Buy / Vicious Sell (Vicious = Safe) plots were born with 60-65 pips displacements.


if (High[i+5]-iLow(symbol,0,iLowest(symbol,0,MODE_LOW,46,i+5))<640*Point && High[i+4]-iLow(symbol,0,iLowest(symbol,0,MODE_LOW,46,i+4))<640*Point && High[i+3]-iLow(symbol,0,iLowest(symbol,0,MODE_LOW,46,i+3))<640*Point && High[i+2]-iLow(symbol,0,iLowest(symbol,0,MODE_LOW,46,i+2))<640*Point && High[i+1]-iLow(symbol,0,iLowest(symbol,0,MODE_LOW,46,i+1))<640*Point && High[i]-iLow(symbol,0,iLowest(symbol,0,MODE_LOW,46,i))>620*Point && (High[i]<High[i+1] || (Close[i]-iLow(symbol,0,iLowest(symbol,0,MODE_LOW,46,i))<600*Point && Low[i]>Low[i+1]) ) && fd[i]==2){
ObjectCreate("Frakk"+IntegerToString(i), OBJ_TEXT, 0, Time[i+10], iLow(symbol,0,iLowest(symbol,0,MODE_LOW,46,i))+690*Point);
ObjectSetText("Frakk"+IntegerToString(i), "Vicious sell: "+DoubleToStr(NormalizeDouble(iLow(symbol,0,iLowest(symbol,0,MODE_LOW,46,i))+600*Point,4),4) , 26, "Impact", OrangeRed);
}


if (iHigh(symbol,0,iHighest(symbol,0,MODE_HIGH,46,i+3))-Low[i+3]<640*Point && iHigh(symbol,0,iHighest(symbol,0,MODE_HIGH,46,i+2))-Low[i+2]<640*Point && iHigh(symbol,0,iHighest(symbol,0,MODE_HIGH,46,i+1))-Low[i+1]<640*Point && iHigh(symbol,0,iHighest(symbol,0,MODE_HIGH,46,i))-Low[i]>640*Point && fu[i]==2){
ObjectCreate("Frakk"+IntegerToString(i), OBJ_TEXT, 0, Time[i+10], iHigh(symbol,0,iHighest(symbol,0,MODE_HIGH,46,i))-610*Point);
ObjectSetText("Frakk"+IntegerToString(i), "Vicious buy: "+DoubleToStr(NormalizeDouble(iHigh(symbol,0,iHighest(symbol,0,MODE_HIGH,46,i))-650*Point,4),4) , 26, "Impact", LimeGreen);
}

Imagine being in the position of commanding good lot sizes. I smell serious gains here.

As for the shaded blocks, I wanted to have a visual reminder for the market having to prove itself: it is not enough to print a x3 and expect that the opposite safety line would get taken out next and everything is full throttle to the other direction. In fact, the back to back triple F blocks may display a failure to reach the safety line and relapse for the additional x3 F-s.

 ///upside prover
if (fd[i]==3 && High[i]>iMA(NULL,0,44,0,MODE_EMA, PRICE_MEDIAN,i) && Low[i]<AxelU[i] && AxelU46[i]!=EMPTY_VALUE){
HighBuffer[i]=AxelU[i]-50*Point; LowBuffer[i]=AxelU[i]-120*Point;
}

///downside prover
if (fu[i]==3 && Low[i]<iMA(NULL,0,44,0,MODE_EMA, PRICE_MEDIAN,i) && High[i]>AxelL[i] && AxelL46[i]!=EMPTY_VALUE){
HighBuffer2[i]=AxelL[i]+50*Point; LowBuffer2[i]=AxelL[i]+120*Point;
}