A dip in the Municipal Trench highlighted with Snow Patrol Vehicles.
Levels
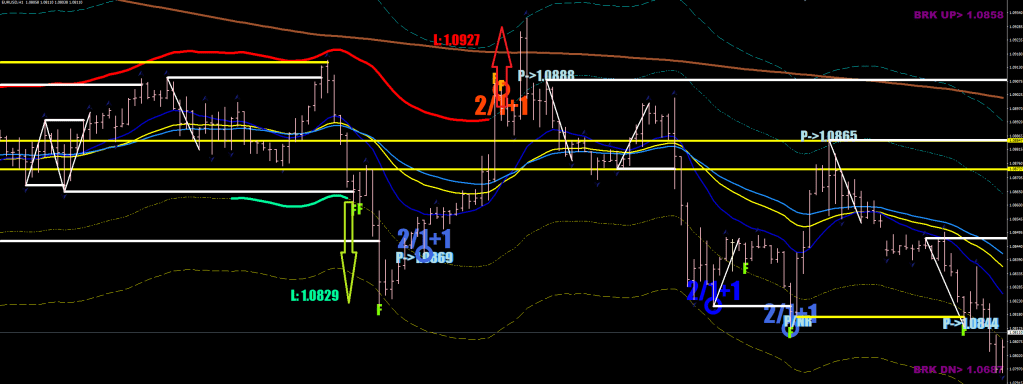
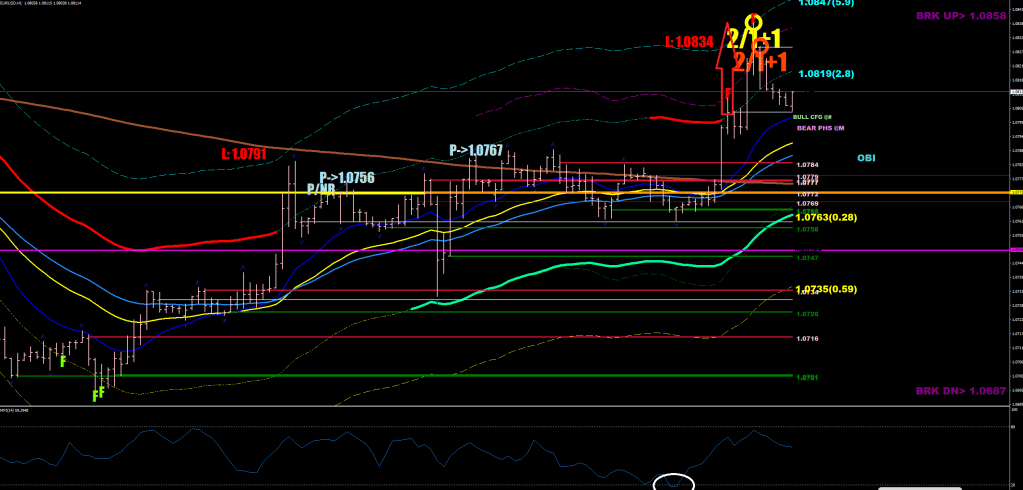
Now find the level if P/NR is not present and W3F is too far in one go (1.0881). F2++ was just missed at 1.0862 (black arrow).
What’s next?
This was a consolidation + a liquidity break.
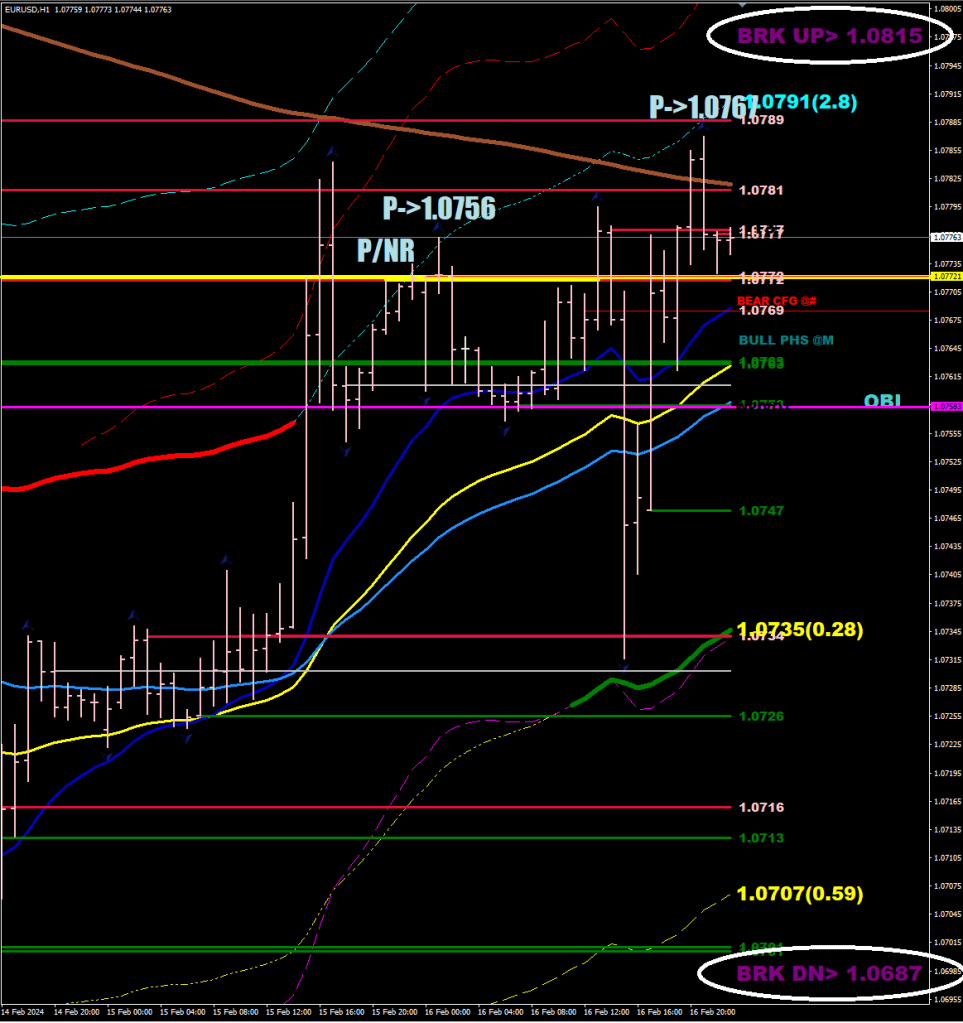
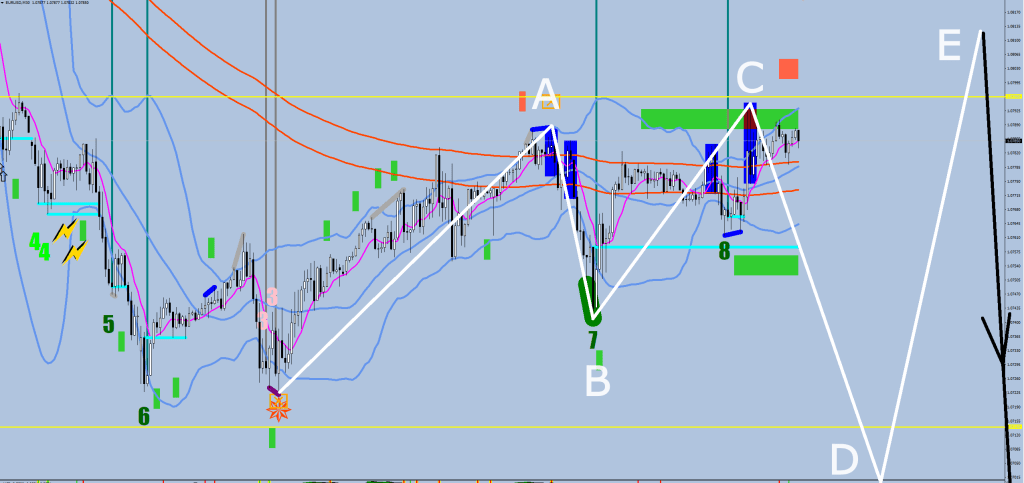
I think that P/NR (Point of No hepbuRn) would prove to be the lower low to kick off the move down.
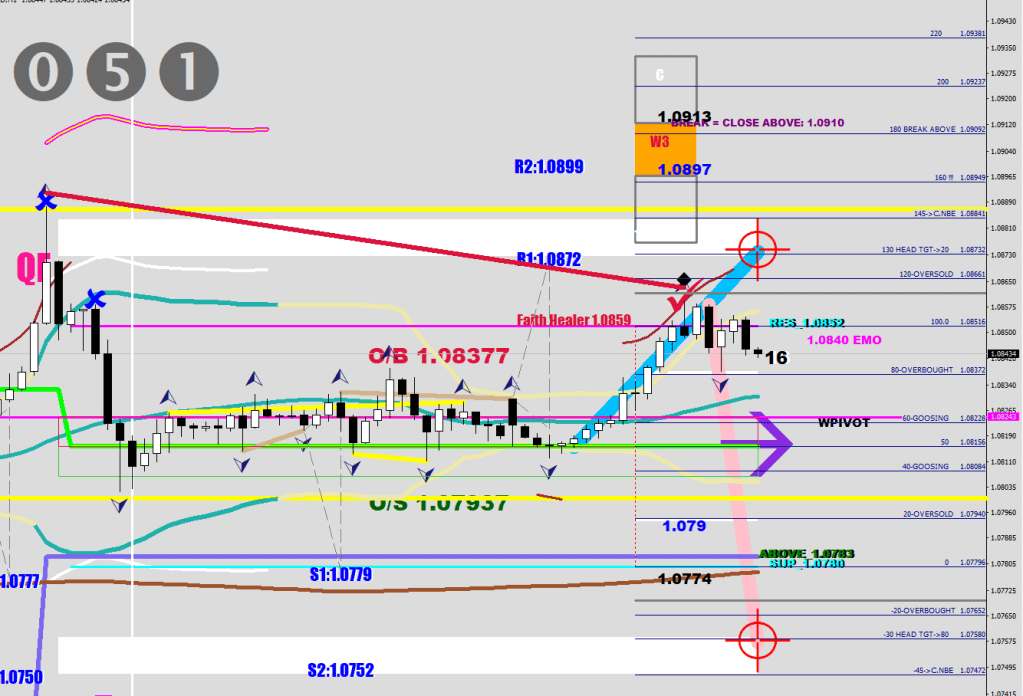
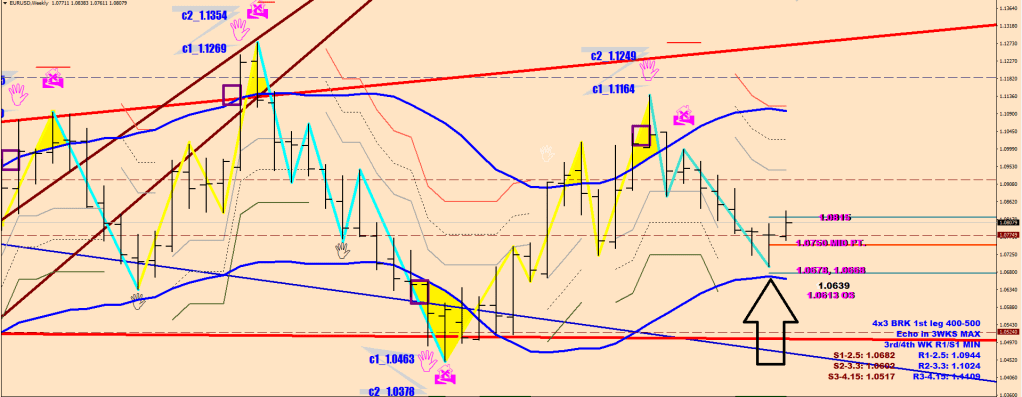
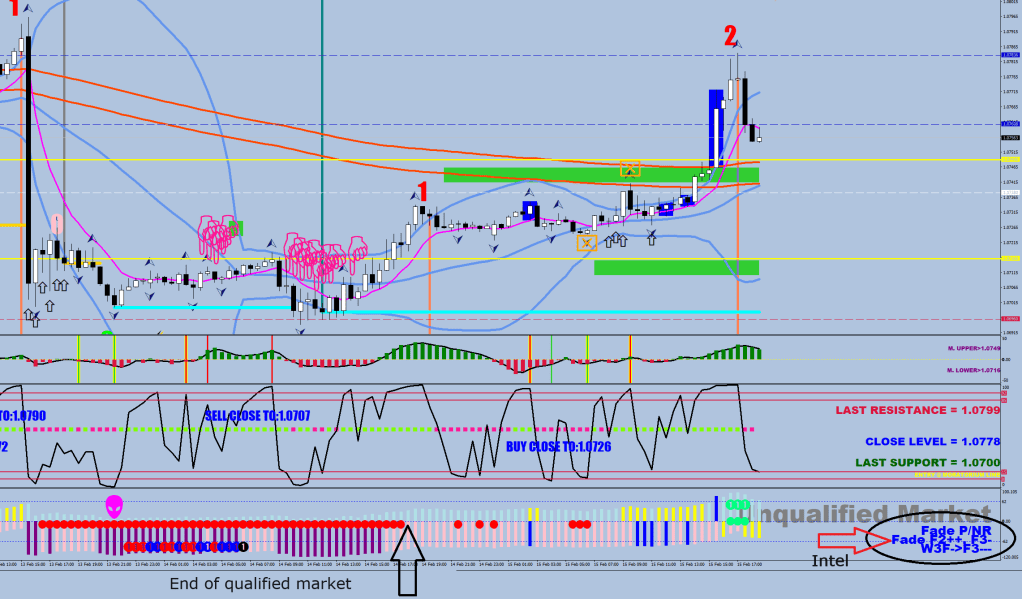
If the current sell condition was a freshly overbought Money Flow, then the level should be in the W3 box (1.0764-1.0748). A trip on the safety line would mean 1.0806 -34 to -46 pips or 1.0772 to 1.0760 for a cover zone. The overlap is 1.0764-1.0760. S2 is at 1.0752
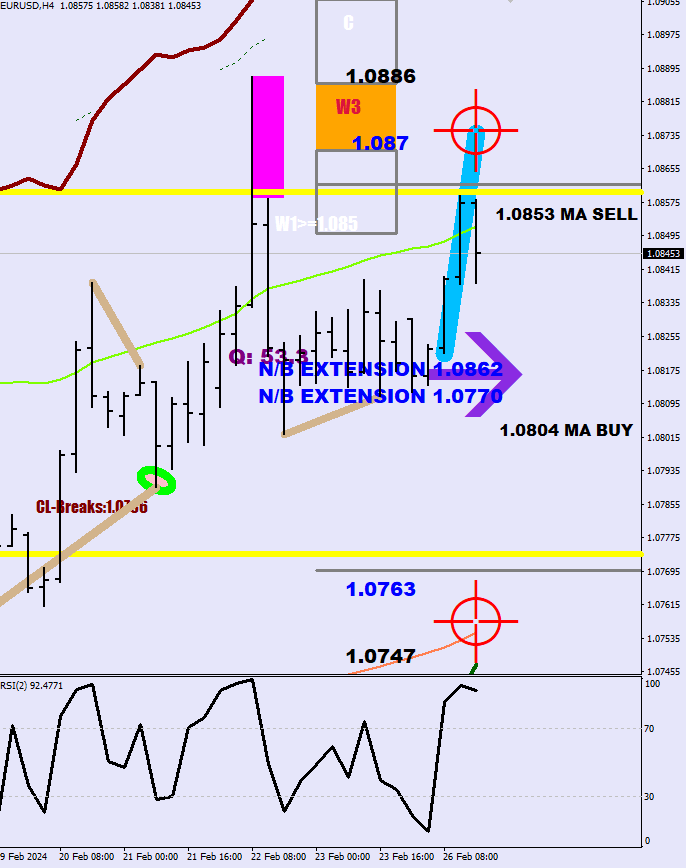
This is where a Wave 2 is expected to start from, at the top of the MA ribbon (MA Sell).
The Der Wish market model (Axel S V1.4) is becoming a precision tool as well.
The Red and Green F-s received a counter logic that includes time out resets. The difficulty was the spread out bunch to synchronize whilst finding a fresh start I used a 100-sample stagnation.
I was not conscious that I found everything I would ever need to find the turns in 2021. It took 3 more years and these recent updates.
The idea of a Full Discharge was an innocent idea of mine, rooted in nobody’s works. The idea of the “Safety” goes back to 2017ish rooting in the concept of “Embedding”.
Full Discharge up
i>0 && ((Low[i]<AxelU[i] || Low[i+1]<AxelU[i+1])  && Close[i]>AxelU[i] && (Close[i+1]<AxelU[i+1] || Close[i+2]<AxelU[i+2]) && High[i-1]<High[i])
Sell side pictures
With the following one some discression had to be used:
Current picture below
Full Discharge Down
i>0 && (High[i]>AxelL[i]&& Close[i]<AxelL[i]+50*Point
          && (Close[i+1]>AxelL[i+1] || Close[i+2]>AxelL[i+2]) && Low[i-1]>Low[i])
          || (Low[i]<AxelL2[i]) && Close[i]>AxelL[i]+100*Point)
Buy side pictures
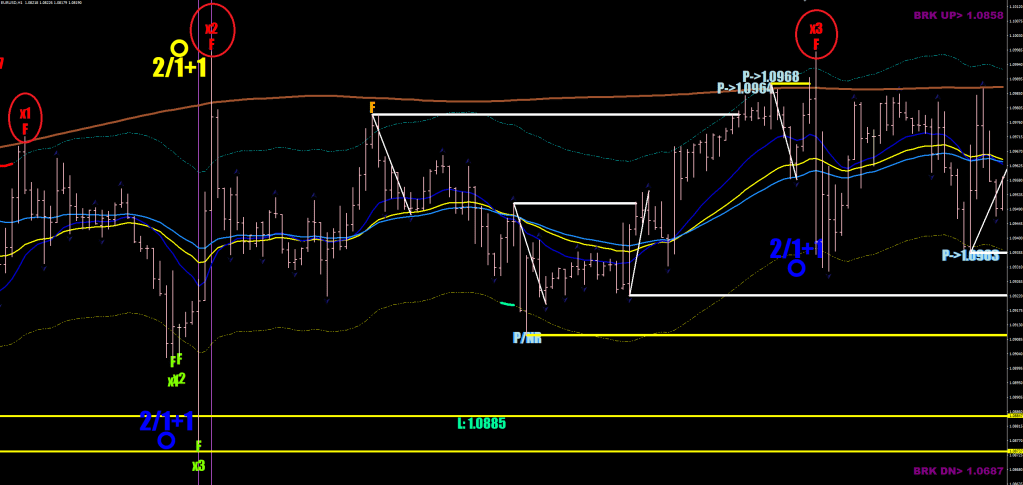
You could add additional rules such as wait for x2 to print before going aggressive, x3 could receive a small beat (i.e. down below), and do not forget to plot the S-356 (in Sienna).
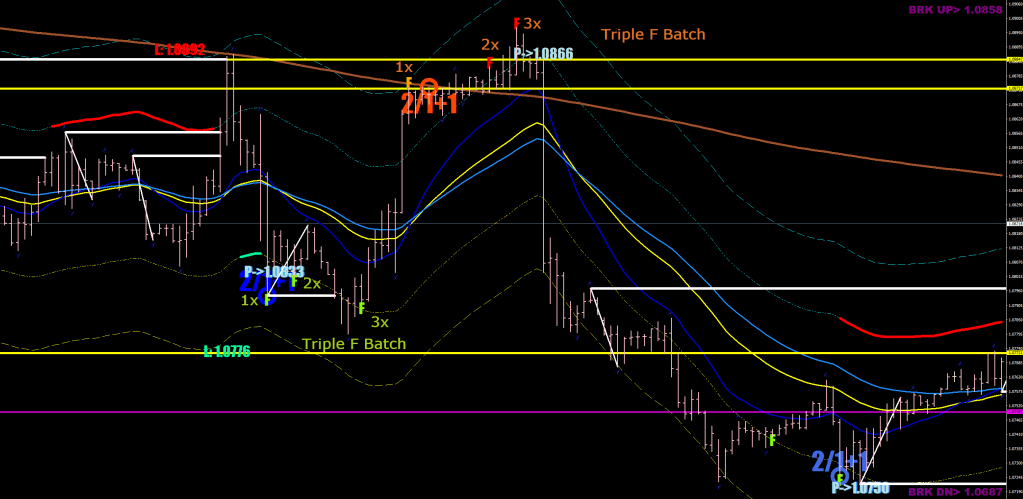
I spoke about the difference of a triple F batch and the triple F spread in the previous entry.
The UK is the place where you get to vote with your monthly 3 pounds between a limping donkey and a girl that’s about to be raped.
It would be a long one, so grab a stiff tea.
Live & pay attention.
Nick Rhodes did in fact call the bottom. That red print after a triple reversal divergence was in fact Magenta until the day ended. RSI does re-calibrate and using arb levels runs a risk of missclassification. Perhaps it was due to .1 difference in the settled reading or even less.
Beautiful visuals: fake out above the descending channel. 1.0876 was a listed level.
Yesterday’s pro volume was a hint that they were up to no good.
A bit more about conditions and levels.
Plausible buy conditions include (beyond a previously posted example of Money Flow oversold), a dip into the Municipal Trench (E-207) or the 120-sample 30-min Stochastic returning below the 50 mark after having marked time up there.
As for targets, the thick yellow lines are previous P/NR levels.
..and so it’s time to name this market model.
3 wishes granted. Der Wish would do.
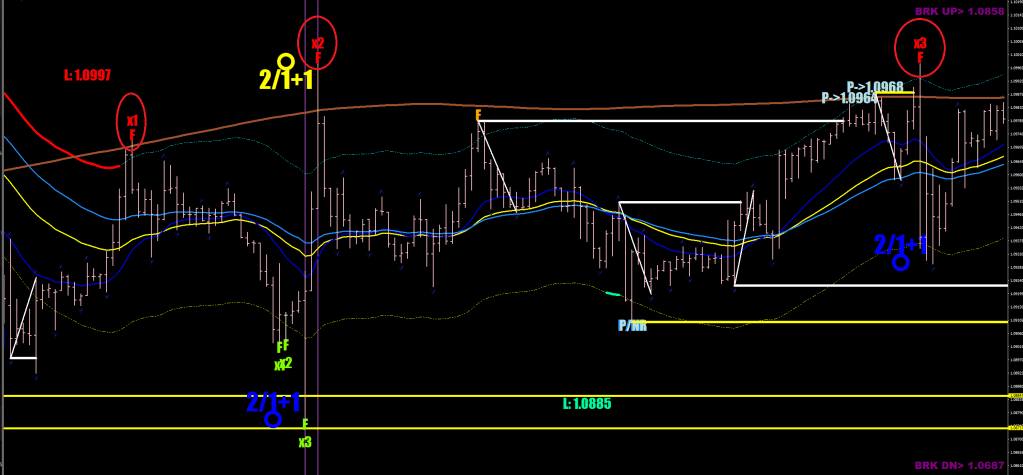
The market is going between Triple F prints and may turn back at the net, the S-356 per hourly.
A Triple F Batch has good momentum behind, and the S-356 may be only a temporary obstacle.
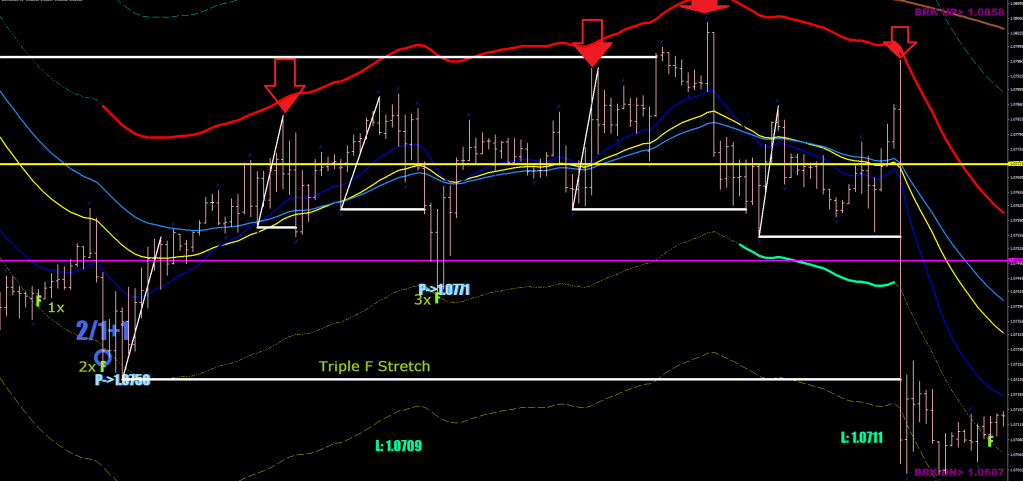
A Triple F Stretch may not get further than a scare-exertion on the opposite Safety Line. All bark, but no bite.
Last chapter is about the digestion of how a reversal zone works.
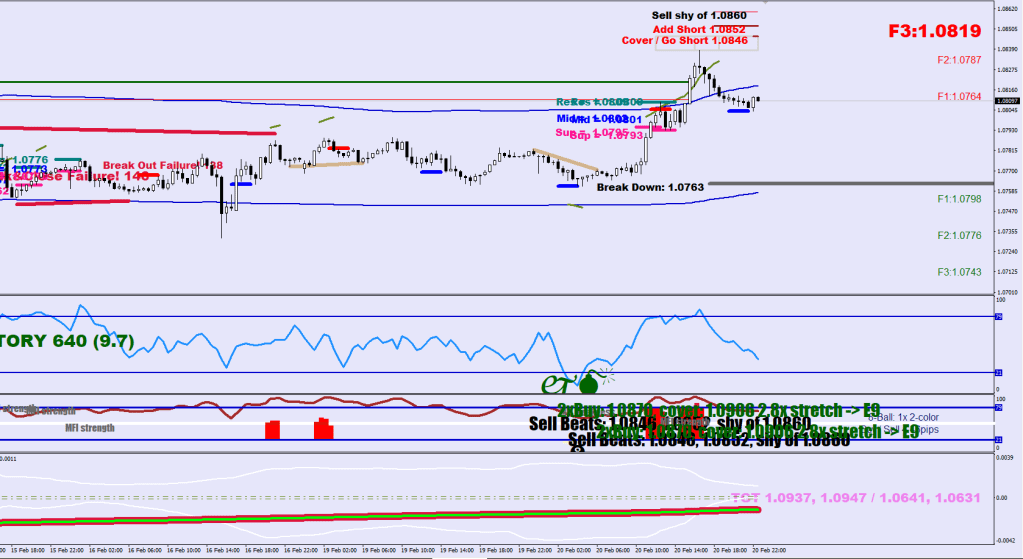
The shy of level is the Tolerance Level. The 2x level is the Must Overhedge level. It has a potential other end 36 pips out, but it could fail at 26 or 16.
During lots of news coming out like today, in the illiquid market they can easily get a break out move started. The 16-pip is sort of a minimum the hedge level would stumble over. Protective trail stop (CODE 2) highely suggested.
I’ve been twerking on the railroad all the live-long day…
All you can do is evolve. Find more statistically relevant data.

Make notes, i.e:

Triple F batch -> F2-... -> F2++ to F3-
Triple F can turn into more by consolidating around the S356.
Embedded Dynamite (money flow oversold) -> W3c / Safety Breach Target.


First the throw off.
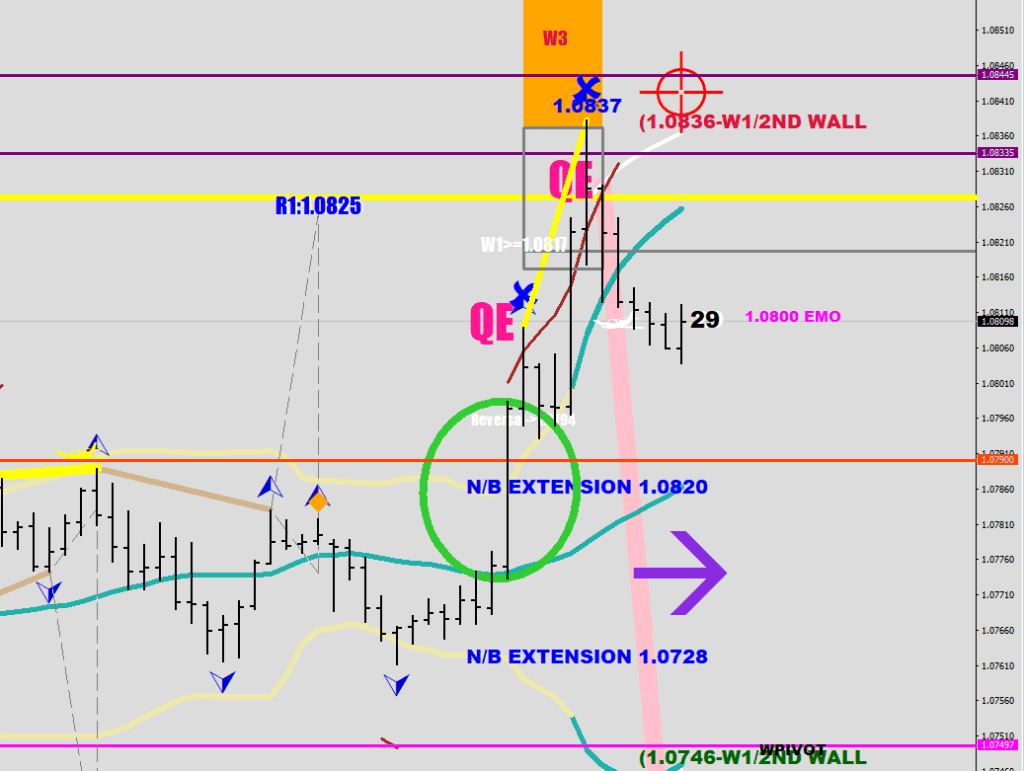
Notice how the Impulse Waves all end up stepping outside the Window Envelope (Blue Lines), whilst the corrections fall short of it by 15-25 pips (Black Arrows).
Price turned where a corrective eave would, yet I think this is a Wave 4 up.
Now, here comes statistical knowledge. Once the Safety Line is hot and gets breached, the maximum expectation would be around 34 pips extra.
This is the 1.4 version of the Axel S., no more free updates beyond V1.3.
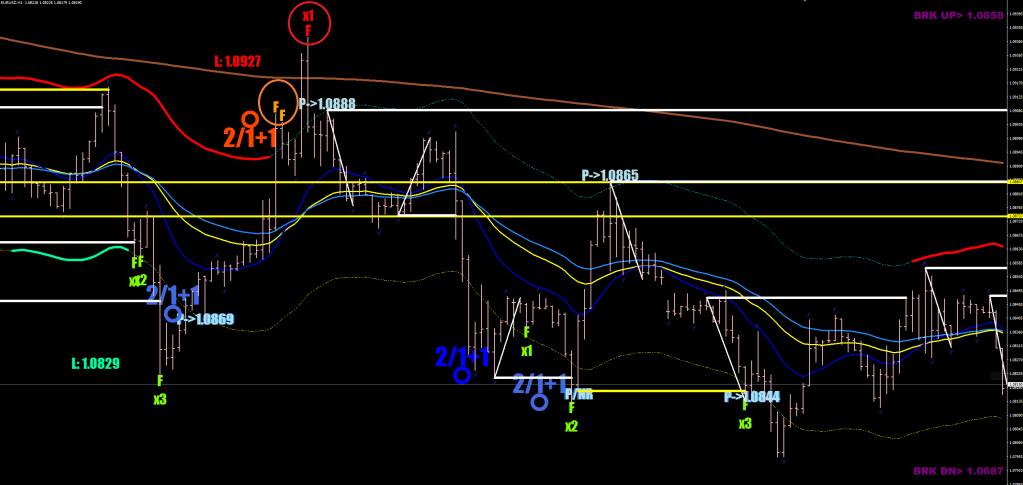
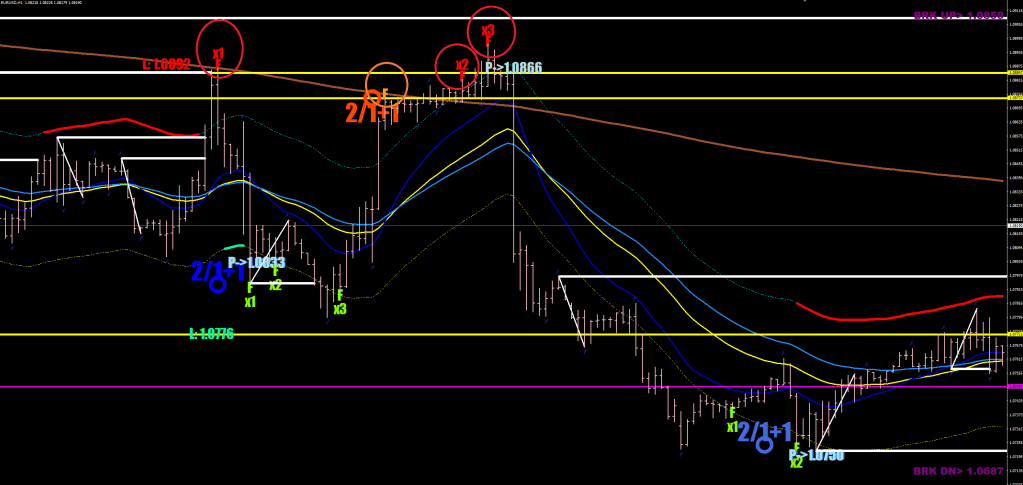
There is always a condition and a level on any given day. In our case the W3 close end (1.0837) coincided with the Safety Set Back level.
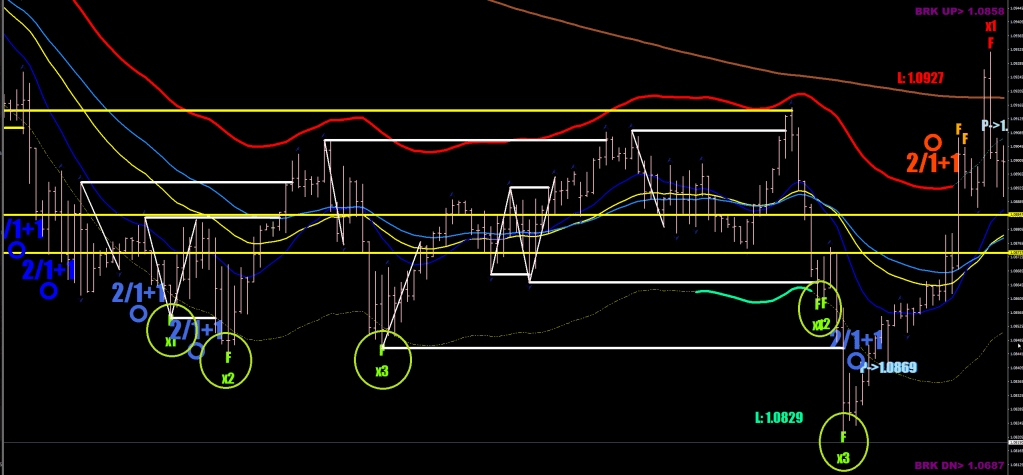
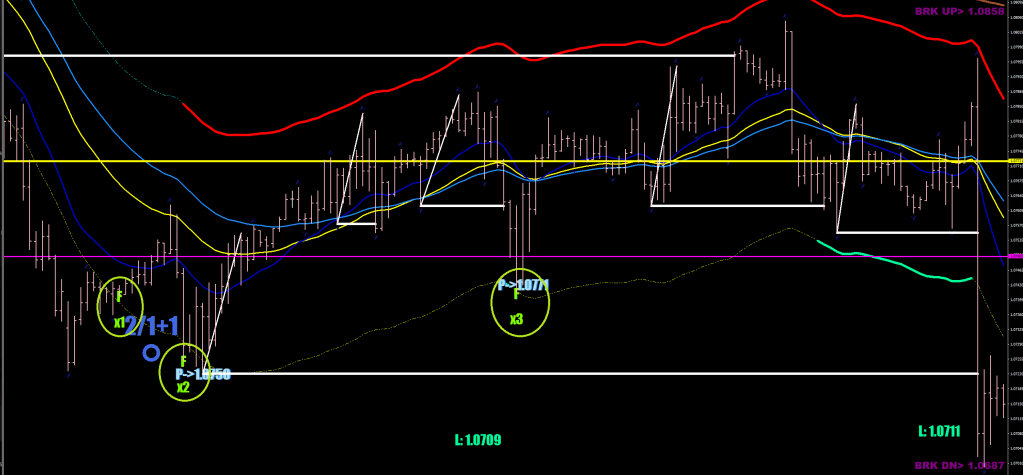
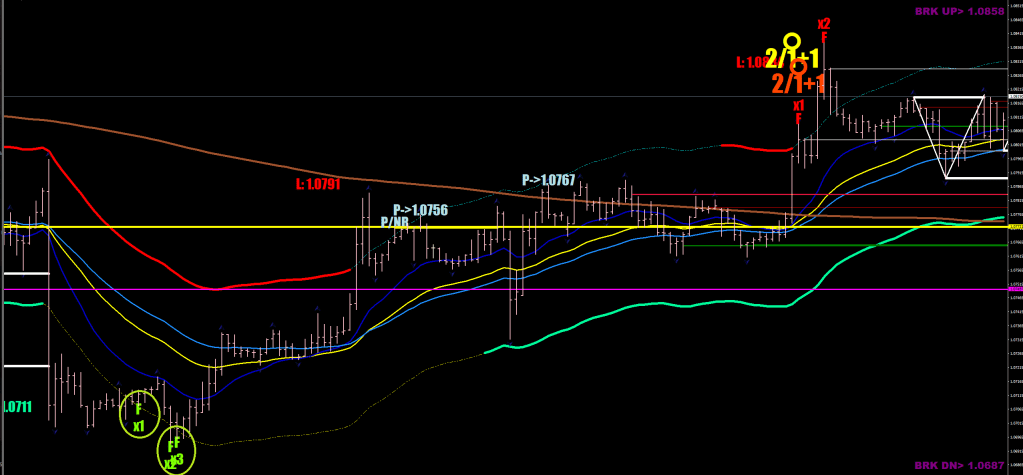
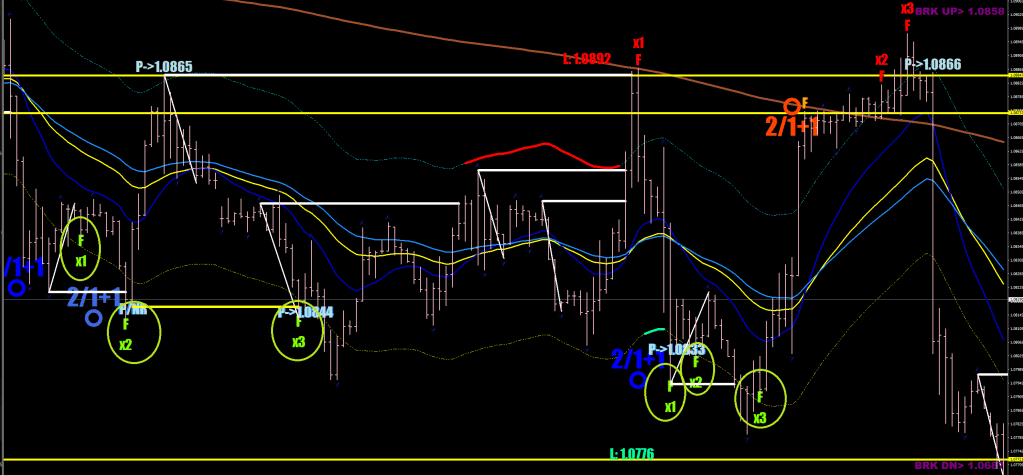
The condition can be a Triple F Batch. Three Green F-s are a Go Long At Market.
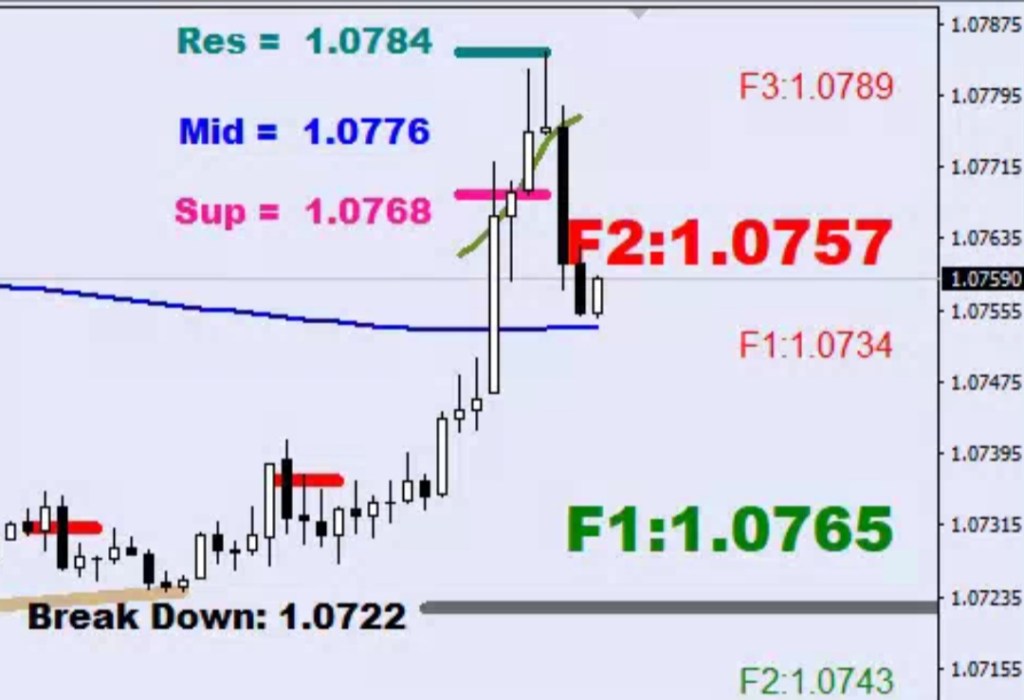
The target on the first leg up was F3 minus or 1.0784 at the time, for that was 90 pips away from the 200-sample low.
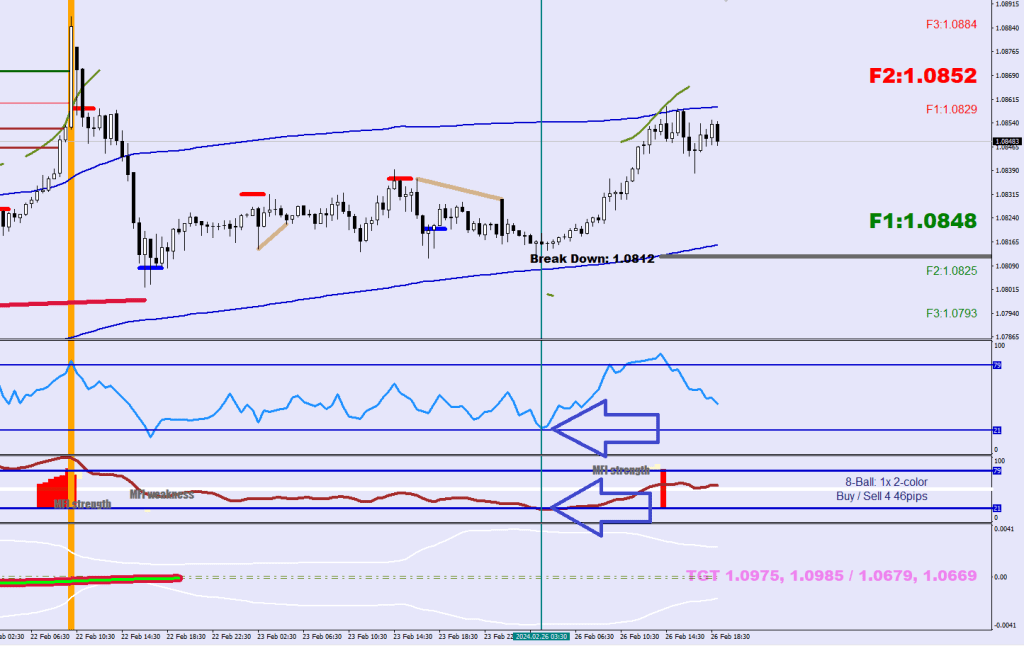
We are currently missing the third F & the money flow situation has plotted a new reversal zone.
Every day there’s a choice between making $100 and $3000.
3 Full Discharges = holdings dumped, the market has just gone from one sided to almost balanced.
After a 3F, the minimum move would be F2-, or in our case 1.0752.
Since the market went from qualified bear to unqualified, the sell zone became F2++ to F3-, namely 1.0767 to 1.0784. The high was 1.07845.
Had I picked up 5 lots naked (7.3 total) around 1.0707 at market, a 73 pips travel to1.0780 would have meant $5329 minus commission. It is very expensive to be a pussy.
It isn’t only in space where bursting out in gas may be dangerous.
When we travelled to KRK, my friend’s father used to tell over and over the same stories. One I had to listen to was about a deep sea welder, whom dropped a cross below his 65m work site to bless it. He was overwheight and once he farted down below and his led belt fell off catapulting him upwards without brakes. You can guess the rest.
On the other hand, I kept you well informed sparing the guessing. I told you we were gunning for the Cyan triangle / Blue Line combo. We still are.
There was never an “if price wants to go up” / “if price was to go down.”
I kept you on the cue.
Does this look like a low to you w/o RSI2 going low enough to facilitate a turn? It looks more like a back test of that descending channel before a major drop.
This was a “loneliness” correction, lasting 16 hours. The orange box was a consolidation, but not a correction. There is a difference: a correction would at a minimum make it to the S30 / E32 within 16 hours.
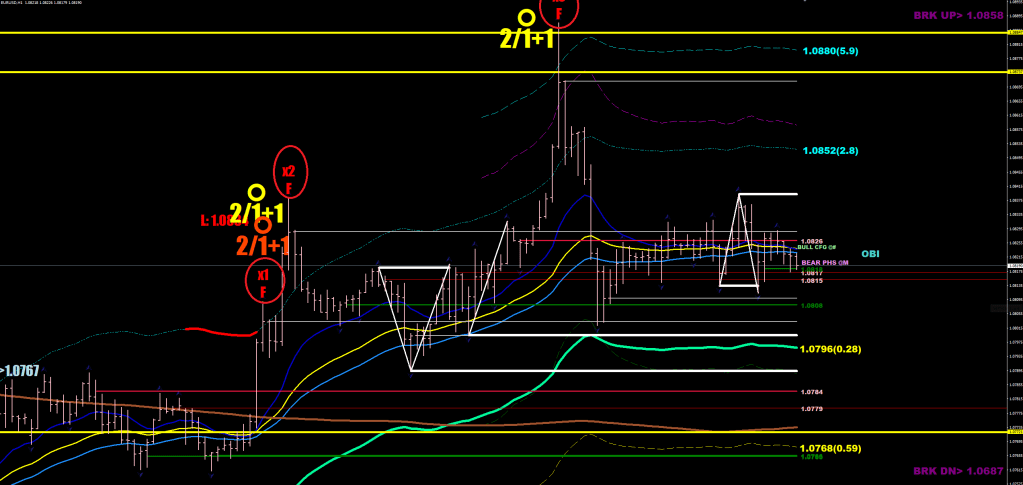
The triple F bounce is coming to an end at the OBI.
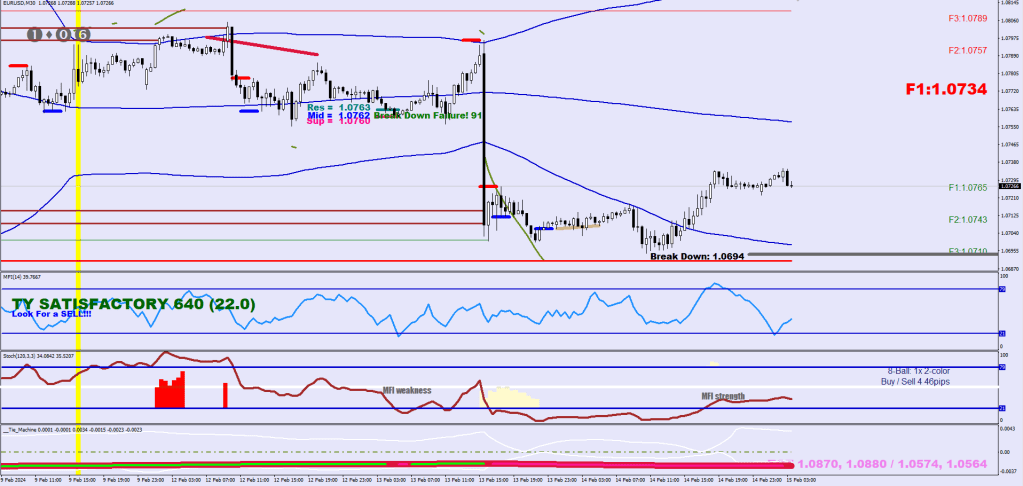
What’s in the scope? Thanks to the lots of sideways movement, 1.0574-1.0564 is now visible.
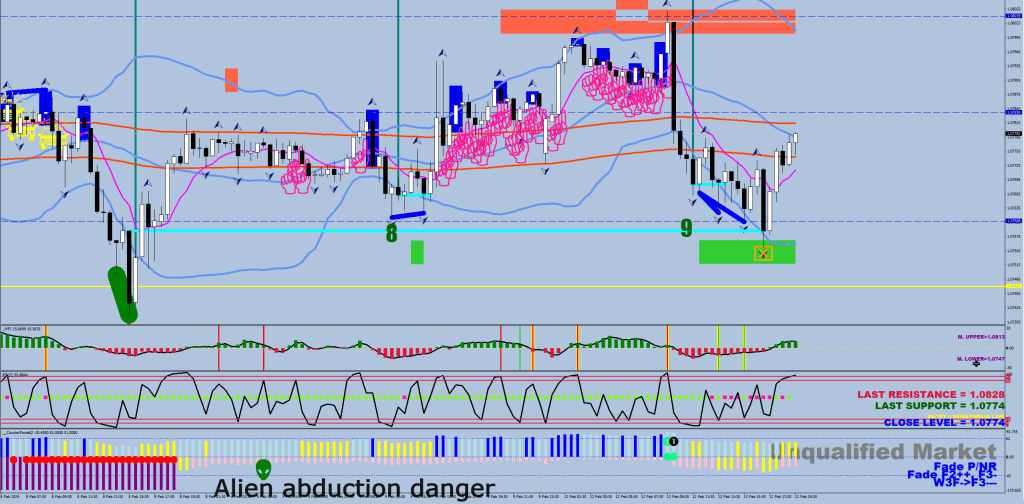
In this world only death, taxes and the possibility of an abduction are certain.
An abductable market is where the counter directional volatility (200 sample, 30 min) does not reach 40 pips (crack 4, yellow sicks).
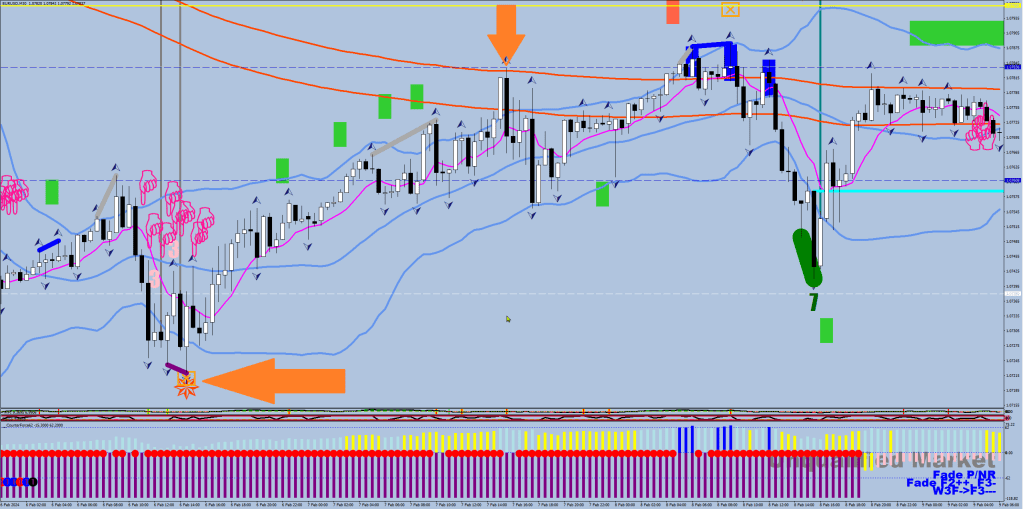
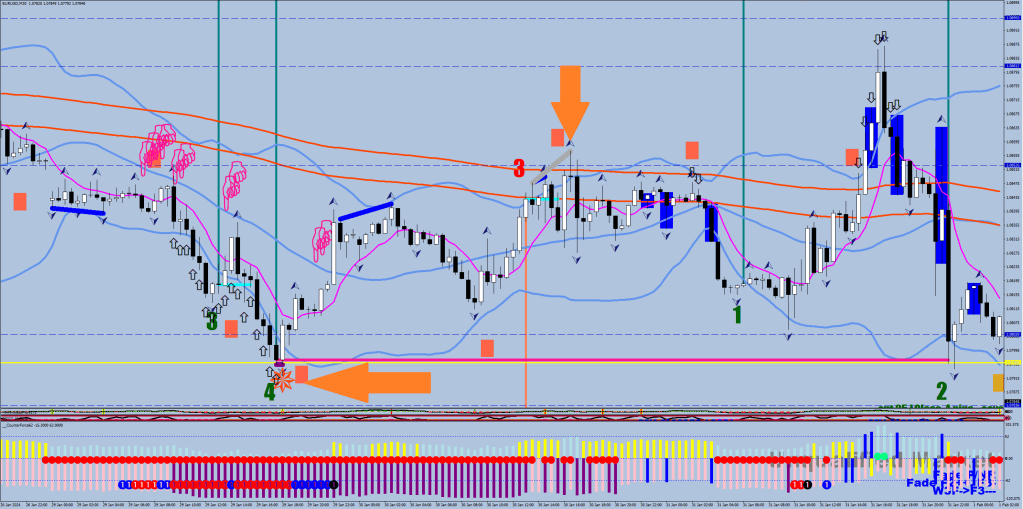
In an abductable market, play a Crack 3 re-capture (1st close back above 30 min S30 – Play 2x size, take 10.pips) and Crack Zero recaps. Crack Zero also requires a close back above the 8 EMO get in on a relapse to the BB. Play 2x size, target opposing 60-min BB plus 5 more pips. Repeat until a Crack 4 prints.
I bet you did not know how reclaiming actually worked. I did not either util today.
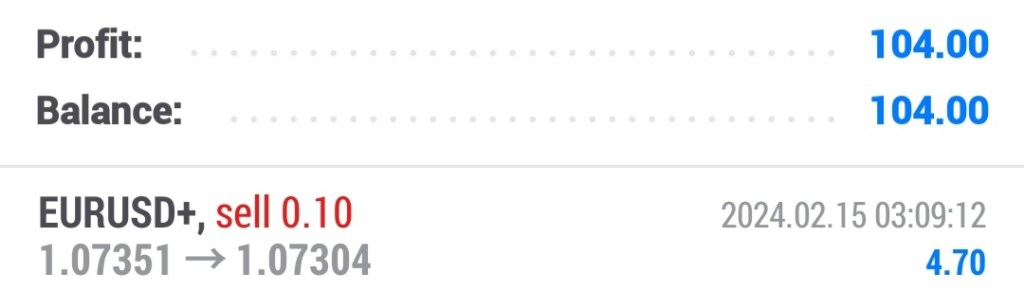
The first play with10 lots would have yielded 1000-60= $940,
the second would have made cca 2400-144= $2256 net.
This is why this free blog and a $99 indicator may just be the best investment you could ever make towards uncapped income.
The hands appear in a protected market upon price approaching the S30. Sort of a hands up for either volatility crack coming or a potential re-capture. I ended up using an alien head for warning for the potential Alien Abduction.
12 slinky dinky pinkies = abduction danger is on.
There are bad aliens on both sides.
I did not play these trades, only later did I manag to put together what I saw on twitter, which was playing 10 pips with 10 lots (on a fully funded demo account) and the idea of protection. Things are seriously looking up now. I’m holding 4-5 lots shorts anyway, so picking up 10 lots in the opposite direction would be a very smart move (5-6 lots naked) if I had a way to guarantee a 10+ pip move. I also have CODE 63 made as part of my auto-targeter routine, which aims for the upper 60-min 30-sample BB when using 0.63 for stop loss and for the lower one and another 5 pips with a stop loss code of 6.3
I may just end up switching to a pro account for a lower spread instead of becoming an IB.
Auto Trading has to be on to run the following Expert, and you must attach it to the ticker you trade. For intance, I trade EURUSD+ which is the raw spread, whilst I do my charting is done on EURUSD which is the “fixed spread”. This way I don’t end up adjusting targets and stop losses by accidentally dragging an existing trade with the pointer. I always choose 30-minute basis.
Code 11: (Stop loss: 11 / 0.11) RSI2 sensitive protective stop loss, locks in 4 pips of profits when the RSI2 reading (30 mins) above 80 or below 20
Code 2: (Stop loss: 2 / 0.2) locks in 1.5 pips after going 8 pips into gains, 3 pips after 8 in gains.
Code 3: ( Stop loss: 3 / 0.3) locks in 64 pips after being 64+ in gains.
Code 333: (Take Profit: 3.33 / 0.333) adjusts the stop loss 10-pips closer than the most recent (35 count) furthest 30-minute 30-sample BB HL2 in the opposing direction (slow motion vehicle)
Targeters:
Code 4: (Stop loss: 4 / 0.4) 8-sample 4HR low + 40 pip or 4Hr high – 40 pip tartgets
Code 44: (Stop loss: 4.4 / 0.44) targets the hourly E-44 of closes.
Code 77: (Stop loss: 7.7 / 0.77) looks up the last 15-minute fractal and targets 70 pips from that swing point.
Code 5: (Stop loss: 5 / 0.5) targets the hourly E-16 of closes.
Code 6: (Stop loss: 6 / 0.6) targets the hourly E-32 of closes.
Code 7: (Stop loss: 7 / 0.7) targets the hourly E-72 band (E-72 of Highs from below, E-72 of Lows from above)
A new plot that lifts my _MFI indicator into the $99 payment clouds.
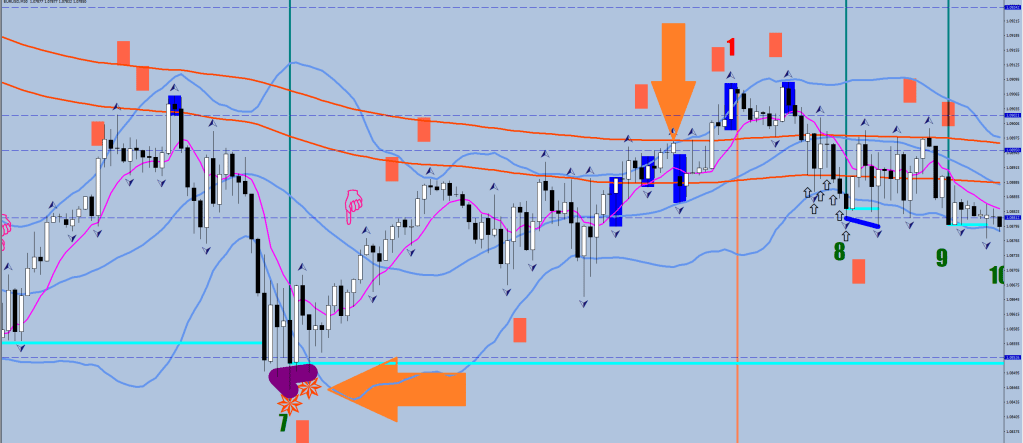
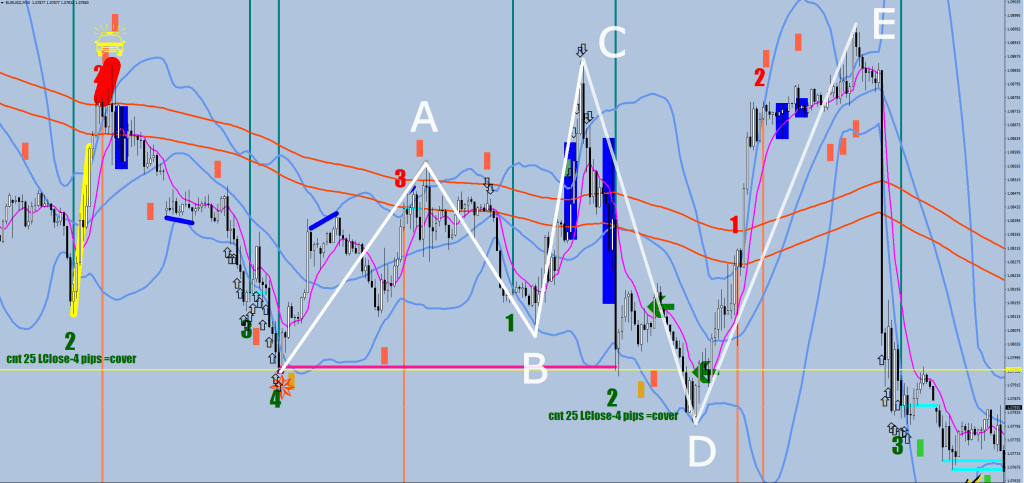
Final Divergences and Crown Royales were its domains, and now there is a Municipal Royale print that is a reminder for the next counter move would make it beyond the Municipal Trench. A guaranteed long / short that is worth its price in OrangeRed. It also adjusts the final divergence line’s color to Purple to point out the purple block below, on the CounterForce62.
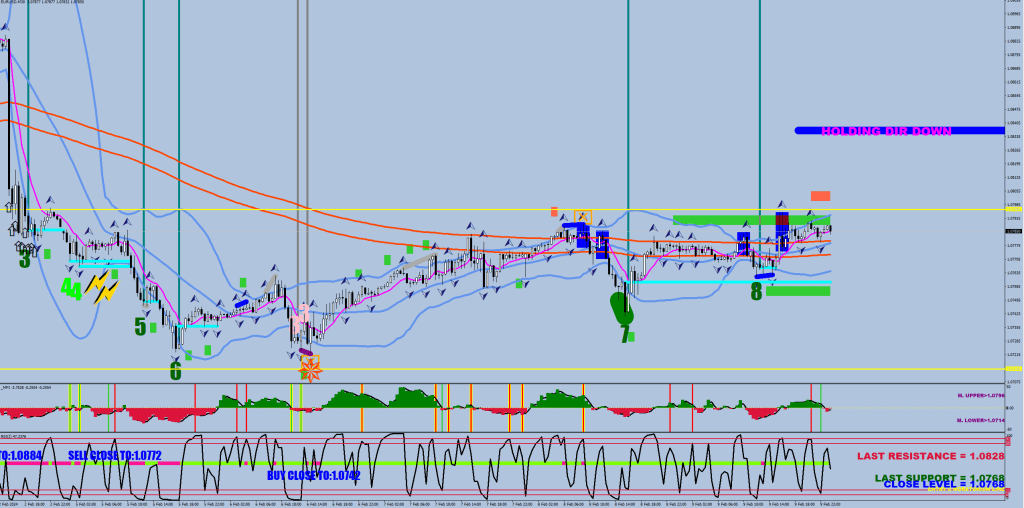
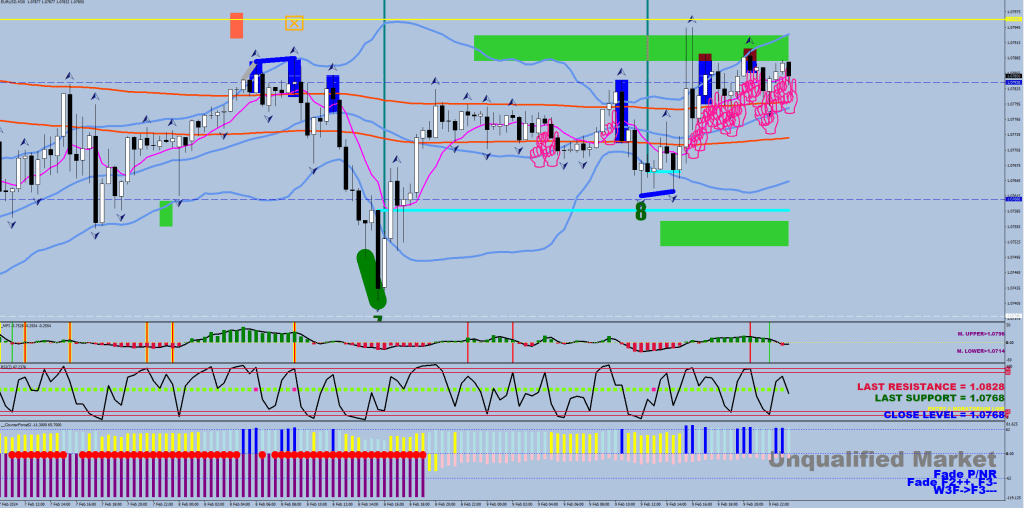
Other than the divergences, the following snapshot shows most of the _MFI’s plots.
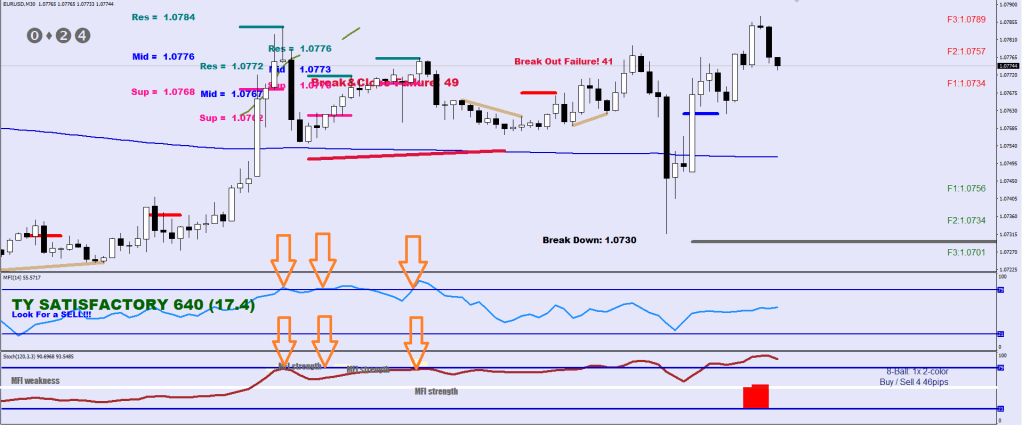
It keeps tracks of regression and progression highs & lows and numbers them figuring resistance and support levels on the way (spells out the last ones in the indicator window #2). In the same indicator window there’s a directional logic print and some action clues, i.e.: Sell Close To 1.0772, Buy Close to 1.0742.
Being an MFI, the shaded humps are a 14-sample Money Flow. On the main window there are shaded Money Flow interaction boxes plotted. The yellow lines are the current range with a bit allowance. The small black arrows are calling attention to a move that is going against the grain.
Besides the final divergences that are color coded keeping the number of the progession count, it also plots Flash Gordon (momentum) divergences, which are missing the volatility que.
It takes understanding the current market based on the degree of counter direction volatility choke to figure out the weight of what a certain type of divergence can do, so a use of CounterForce62 along is highly recommended. The blue shaded boxes are moves into the F2 territory (200 sample). I got tired of everything being called R and S, and adopted Formula One classes instead.
The Holding Direction plot is sort of limit for a liqudity break having to hold to stay in shape.
The main purpose of course is getting helps with gauging what is happening currently with some very real prompts for an action to be taken (i.e. hedge / cut) thanks to the divergence plots, The F2 boxes (which are the last crack to keep the market in check)
The True Money Flow reversal reversal precision plots belong to Tie Machine on a less cluttered chart (by my vocabulary).
_MFI is one of my 3 indicators currently carrying a price tag of $99.























 ForexFore - Internals, indicators, algorithmic trading