Understand what today’s & yesterday’s whiplash did:
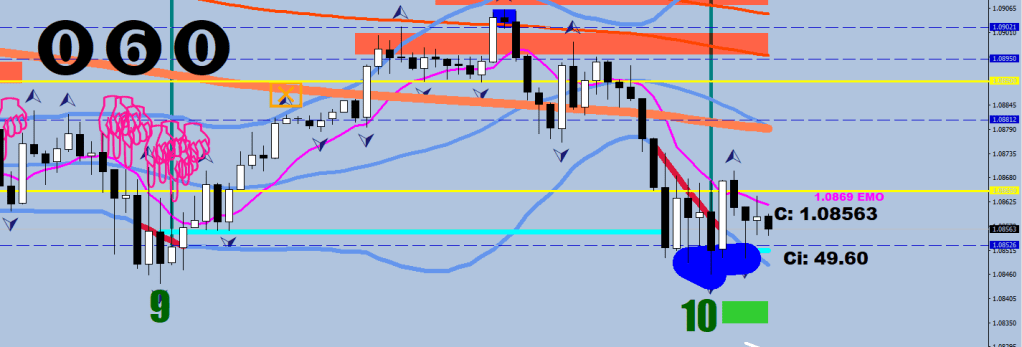
It shook off as many holders as was possible and re-calibrated the market. There is a near equilibrium with a bit of a bearish tinge. The 0.59 got pierced whilst the 5.9 got just missed.
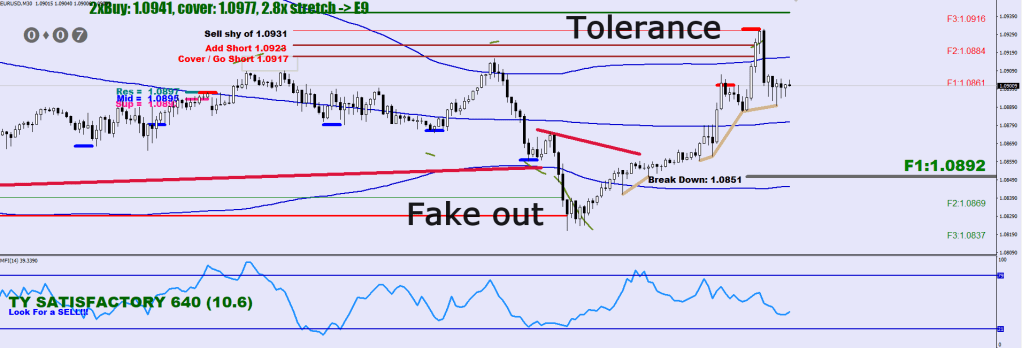
The market went from the Fake out line on the downside to the Tolerance level on the upside.
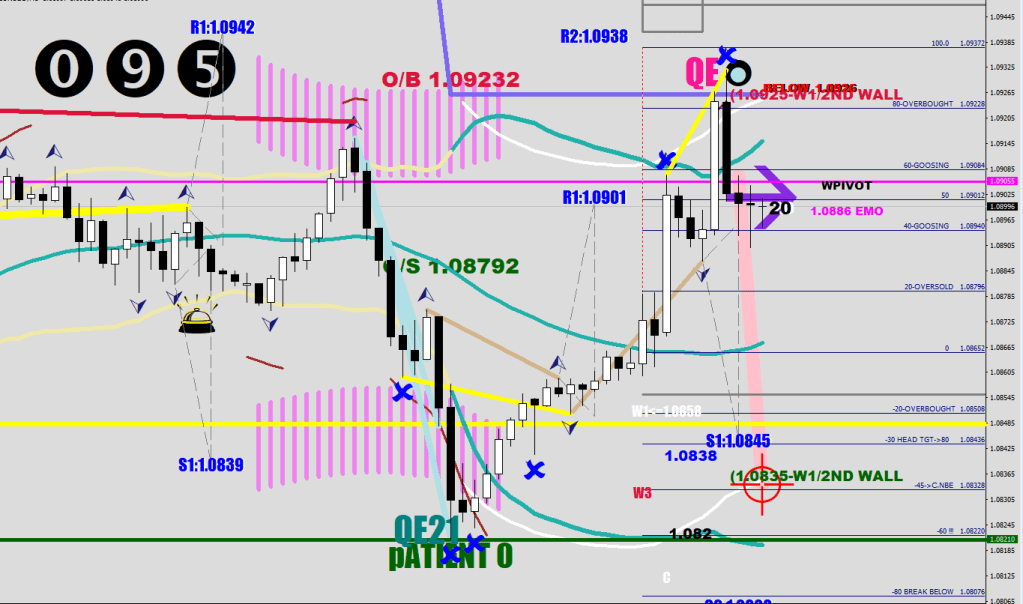
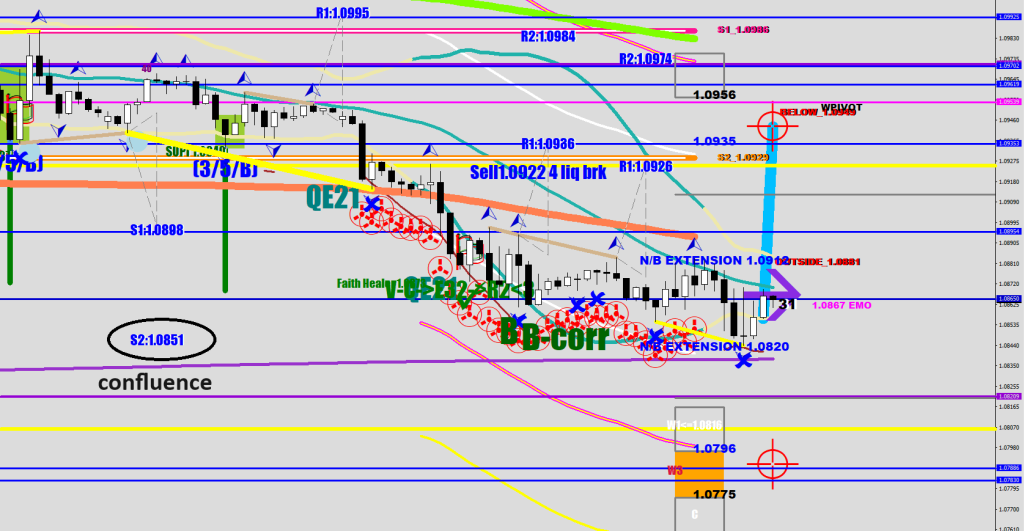
The range has remainded the same for 2 days, price is consolidating after a volatility crush just below the current consolidation mean (purple arrow), right on top of the daily E-9, just below last week’s pivot.
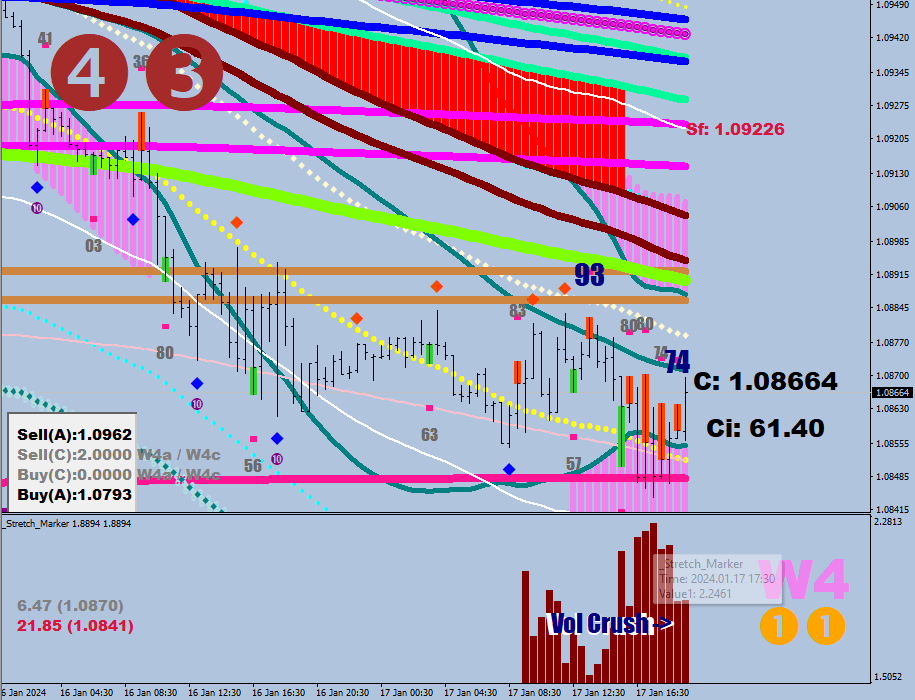
These are the current W3 brackets (close and far ends of the expansion zone), and Ci has yet to cross above 53 (now 44.92).
I was surprised to see a Patient 0 print, since a liquidity break is usually a right shoulder, so this lower low did not really fit the bill, yet the rally from it was tremendous. Black ball with a dot = 95% chance that the top is in. QE: +20% chance.
There would be a minimal shift of the range and a bit of expansion of the 3-day ATR due to the last few days having larger ranges.
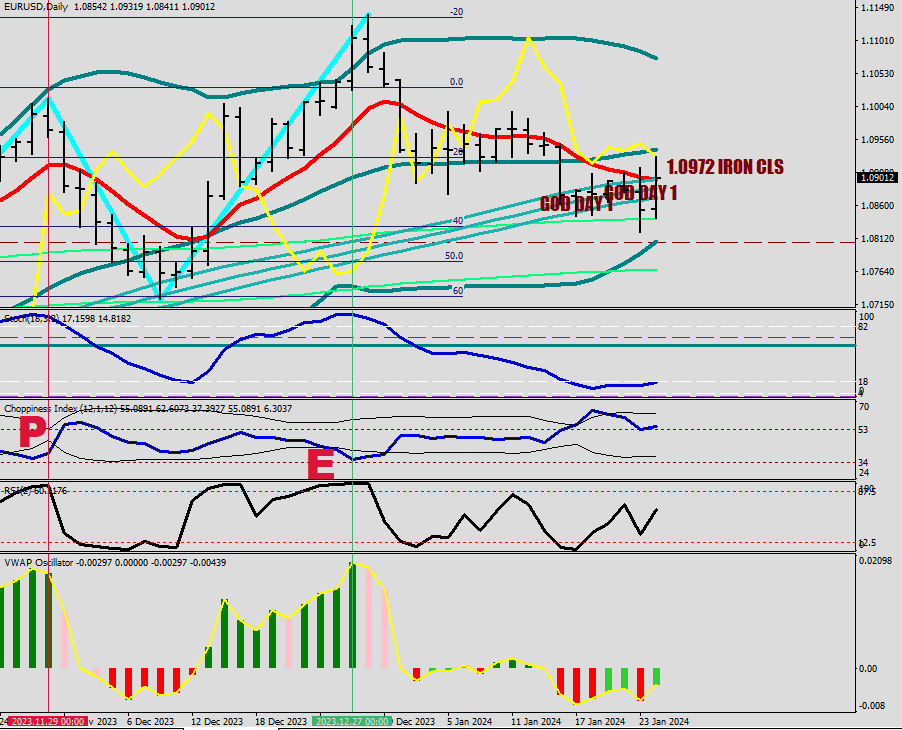
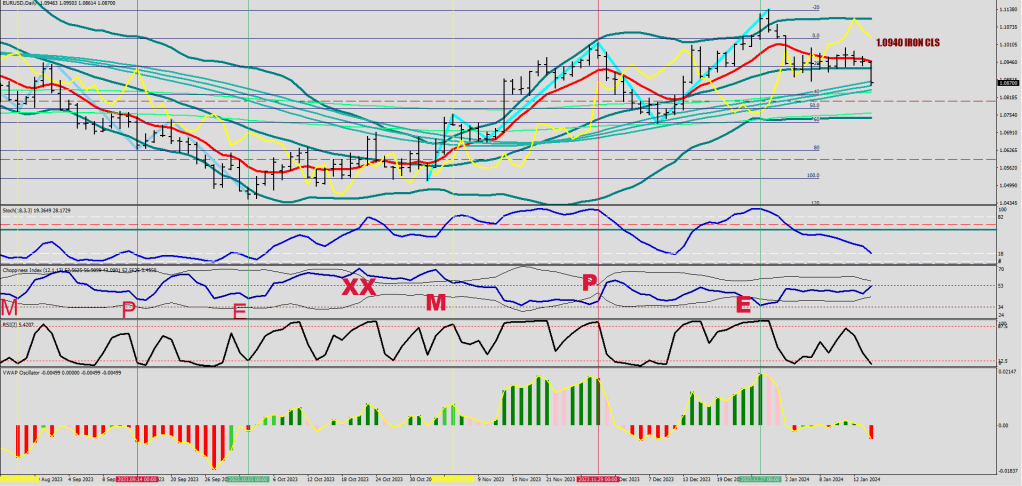
The daily stochastic is embedded to the downside, a lower low with a higher stochastic reading is a must to be able to get anything going on the upside. The 19 SMA is at a steep decline. I think 1.0775 would be attainable in the coming days.
I dumped almost all longs today, and am 95% short.
The push on the lower Bollinger gets postponed till tomorrow.
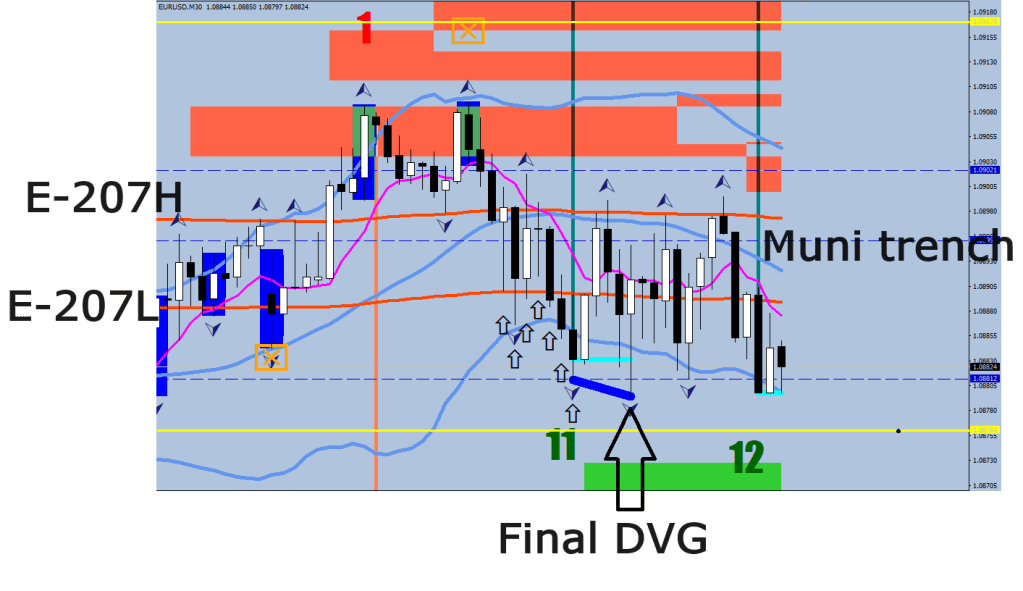
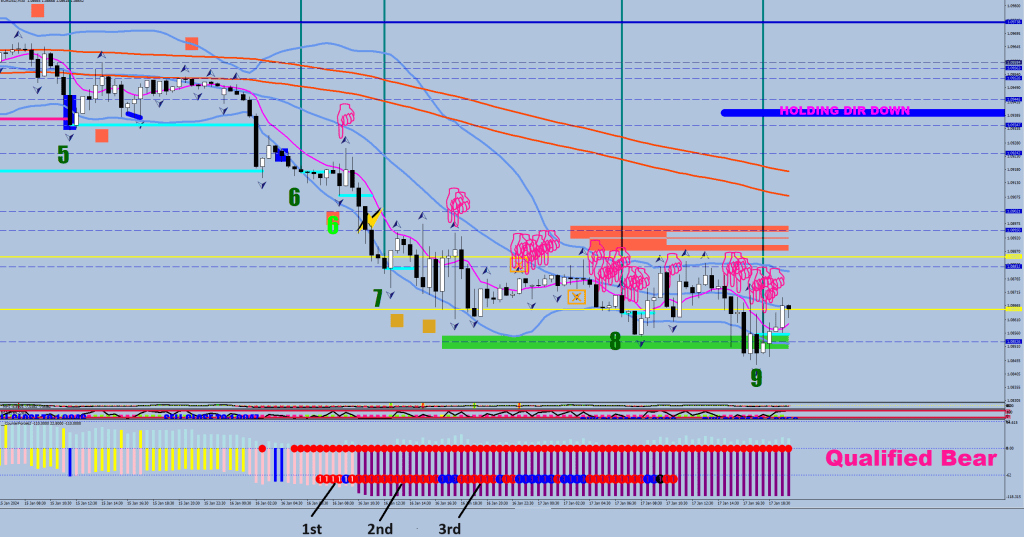
We hit the fake out level, but so far only one close was made below. More 30-min closes below -> 36 pips more downside => 1.0795
Now, whatever happens, tomorrow the lower daily 30-sample Bollinger Band is gonna be popped (it would move closer of course) & the Measuring leg (Wave 1) is going to get initiated.
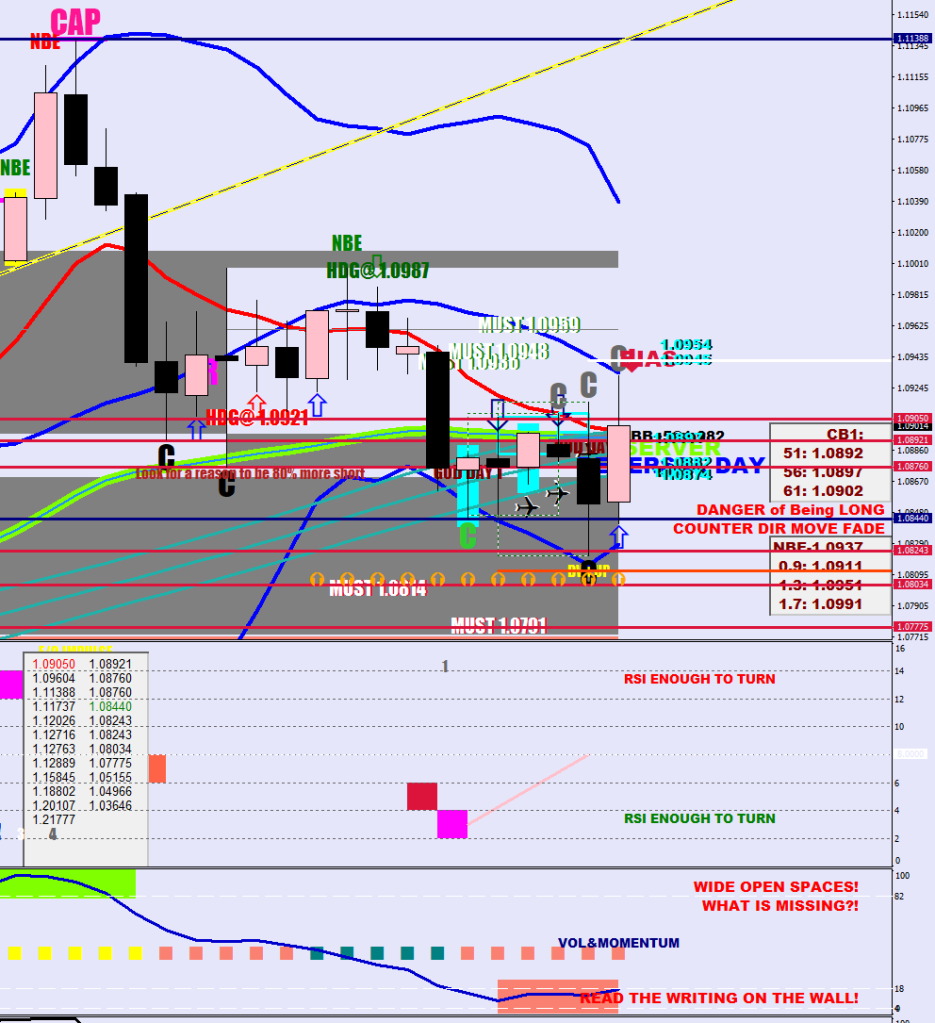
The right approach to trading is constantly asking, what is missing here?
The market made 3 full discharges on the downside yet in 2 days it hasn’t managed even a partial one on.the upside.
Also, the money flow droop set a trap to trip on.
What is the holdup?
The municipals in trench 207 are pushing the beach ball back below the waterline / handing out longs for a sucker rally.
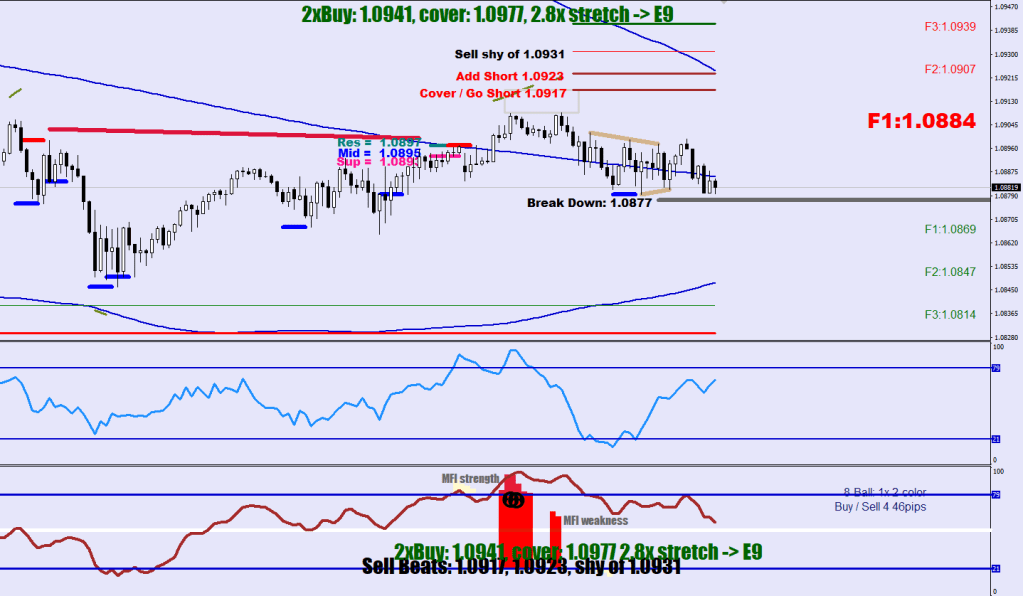
Because of the energy build up / the buoyant kick at the start, I do not simply expect a discharge beyond the 2.8 Safety line, but a pop beyond the 5.9.
Now, the risk is making 30-minute closes beyond 1.0940, since that would make 1.0977 attainable, even if price falls back first 30 pips.
On the picture below you can see the upper guard rail (green) and the Goldilocks level coming together at 1.0956.
There is nothing with better predicting power than the Money Flow Droop.
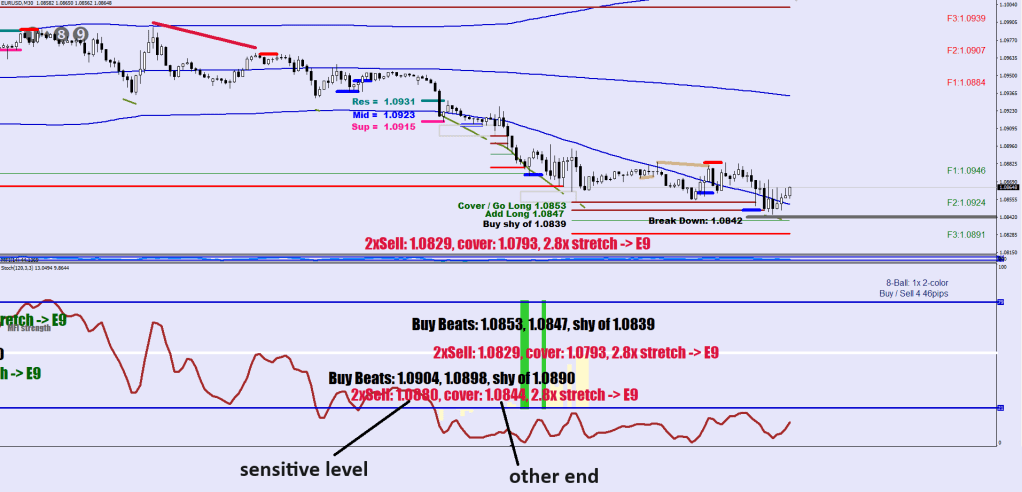
Once the sensitive level gets touched, price shall just about make it to the other end, no matter how reluctant the move would be.
The low was 1.08444
Now, I wanted to somehow the parabolic phase come with a tangible target as well.
What I am finding is that the F-1 (read it as “Ef minus one”) market when making the 3rd push, the ATR projection’s W3 far end is the needle I was looking for in the enormous Nay-stack.
I forgot to take a snapshot yesterday, but the W3 zone was 1.0872-1.0851 (close end to far end). After that the zone does not change despite of price reaching high consolidation levels.
When price popped the upper 30-minute 30-sample BB (Zero print) the market moderated to an F-0 market, which means that a Flash Gordon divergence on the downside (missing the BB) would work fine for a bottom.
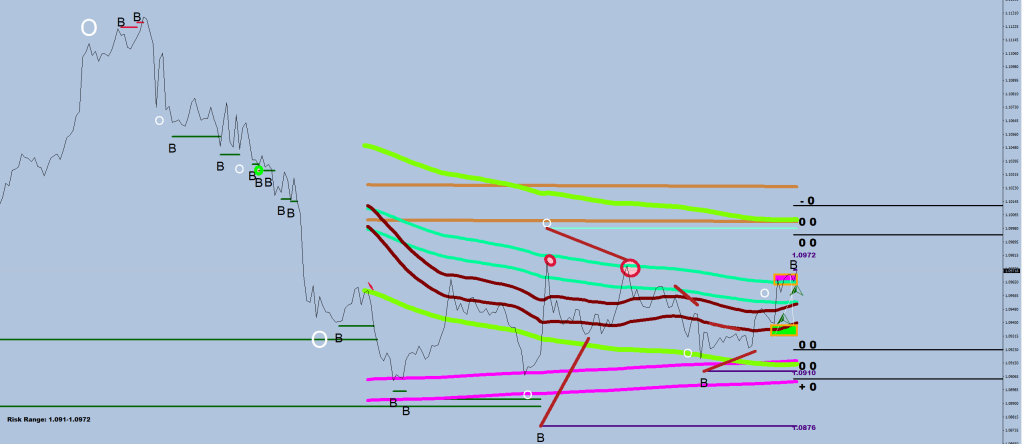
W3 (orange box) plot example below. Currently only the downside shows, because price is below the purple arrow (consolidation mean).
2 full discharges made, the logical return would be an F2 pullback, 62+ pips up from the low. 1.0844+.0062 = 1.0906
I am not expecting a return beyond the E9 at this point (cca 1.0940). Why? Because the market has not reached 2.8x stretch from it. 2.24 or so this was.
There is nothing wrong with following Felix Navidad if you are into investing and have plenty of capital.
“My trades last week = the options sold up to 45 days ago expiring”. A bit of scamming going on, but I think we could still be friends, he does way more good than bad. Investing should be boring.
Trading, particularly day trading however requires a lot more in exchange for low / borrowed funds. This stimulating environment is my reality where paying back 3 credit cards, 2 personal loans and a flat paid off at 12% to date, a full time job, heart problems and a dysfunctioning family can take one to the level of OMFG creativity.
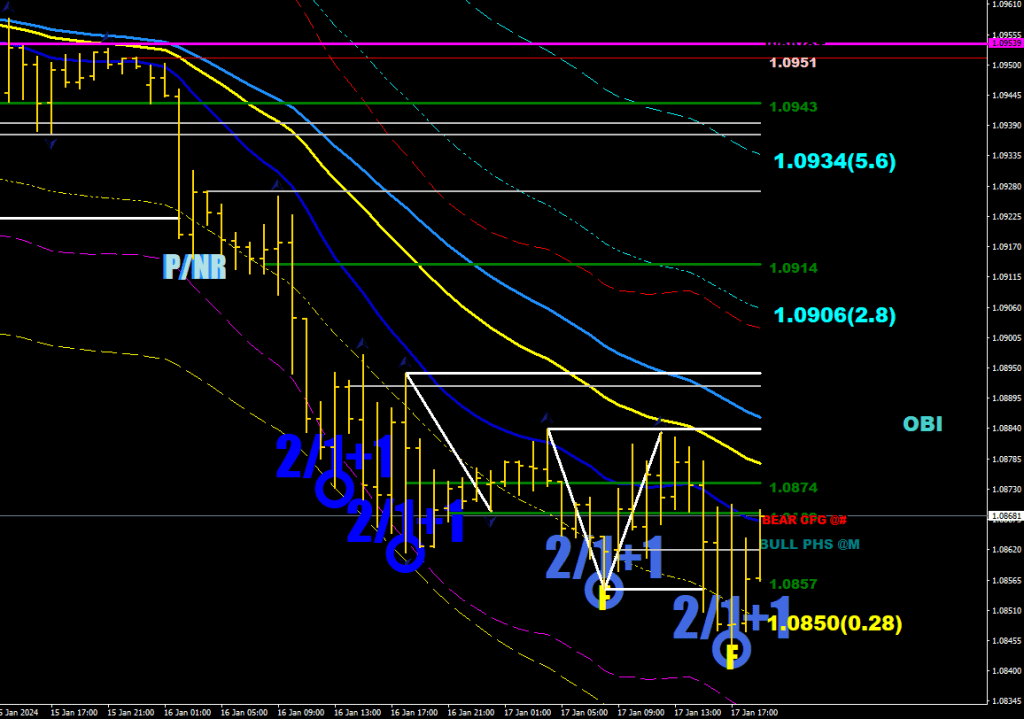
The mean on the 1H chart is the E-32 HL2 in yellow aka the Divider/ the Reset (at times it can be the S-30 in green)
The Separator is the E-16 HL2 – blue.
The E-44 (OBI) is light blue.
Bear Configuration means the E-44 on top, the E-32 below and the E-16 is further below.
The Safety lines are 28-pip displacements of the E-32 (0.28 & 2.8).
The purple and red interrupted lines are the displacements of the E-16 (channelling).
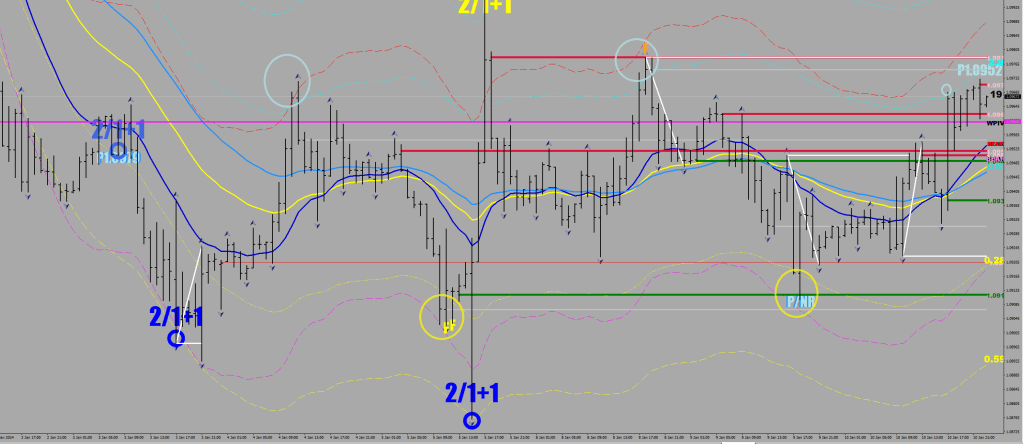
P means Partial discharge, meaning price going outside the Safety line and returning back inside. The arrow is a reminder for where price may be returning to from there.
F means full / deep discharge – this goes an extra 10-pips beyond the Safety line and returns.
Some of the principles I use in these latest generation auto trading routines of mine:
Max 2 longs and 2 shorts at any given time.
Opens are at market.
All positions have stop losses.
The first position is the next 30-min candle after the trigger condition.
The second position is a “back test” of the trigger candle, and the far end exceeded within 7 hours.
A second filter layer made of previous 1-2 days price movement relative to moving averages and Bollingers.
Trail stop applied.
Targeting is off of statistical likelihood.
Not interested in home runs.
The game is optimal filtering, a fragile balance of not losing too many trades, only really unwanted ones.
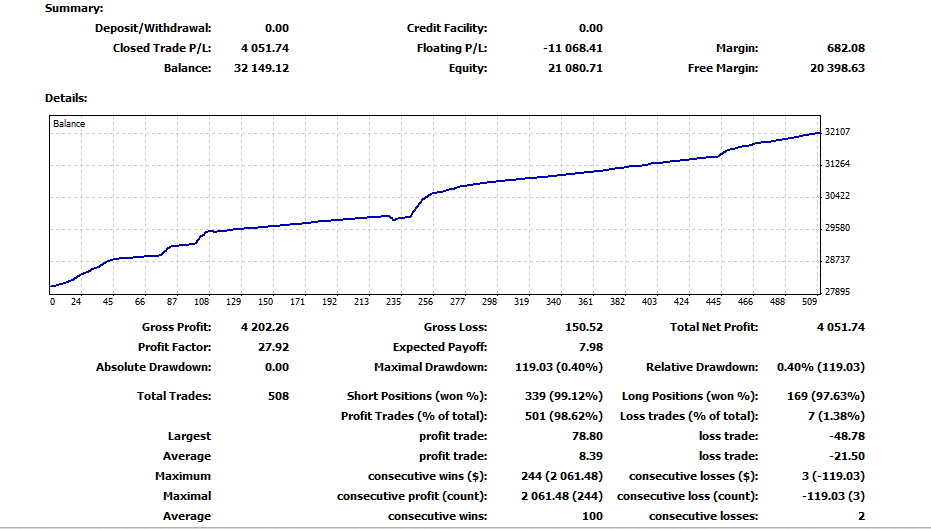
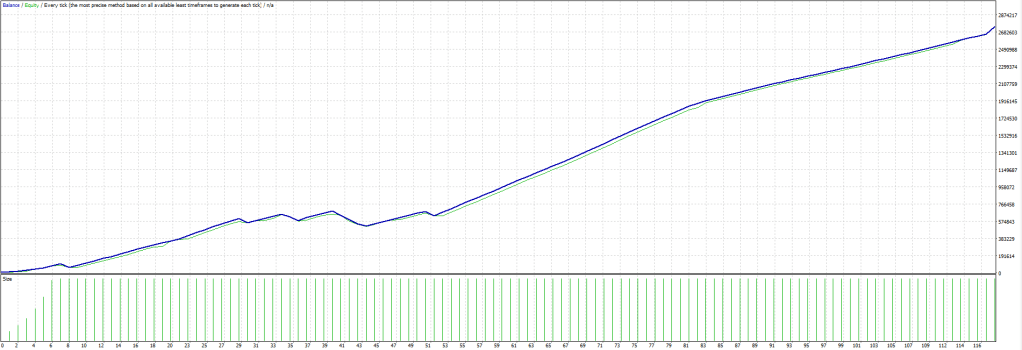
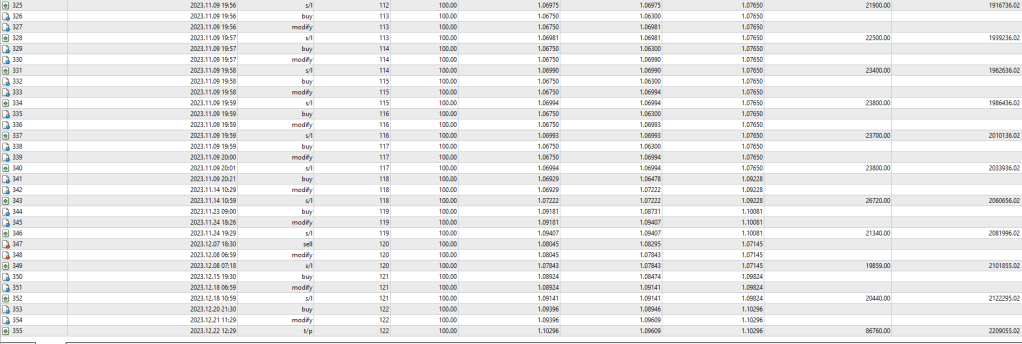
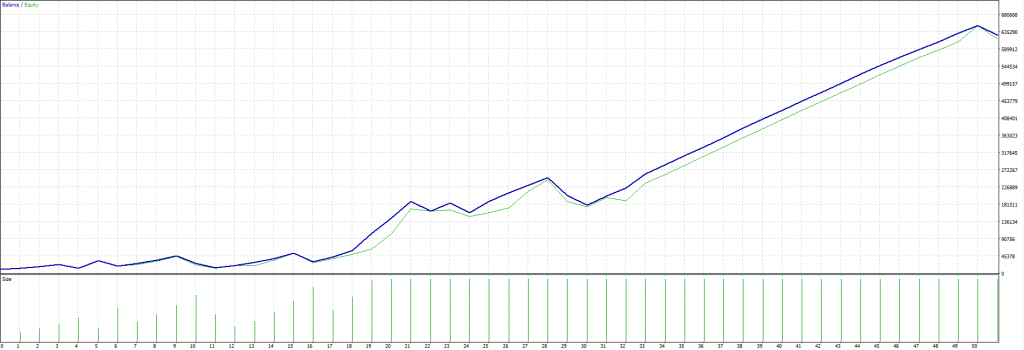
1-year backtest, max lots>
1-year, suggested starting size, max drawdown 52.5%:
About the viedo: that’s a totally phoney indicator that people just blew 160k on. It is reading the historical data from somewhere and then factors in a fitting trade. Hindsight is 20 – nothing. Their problem was probably having to come up with losing trades.
About the 35 profit factor: my record was 2443.
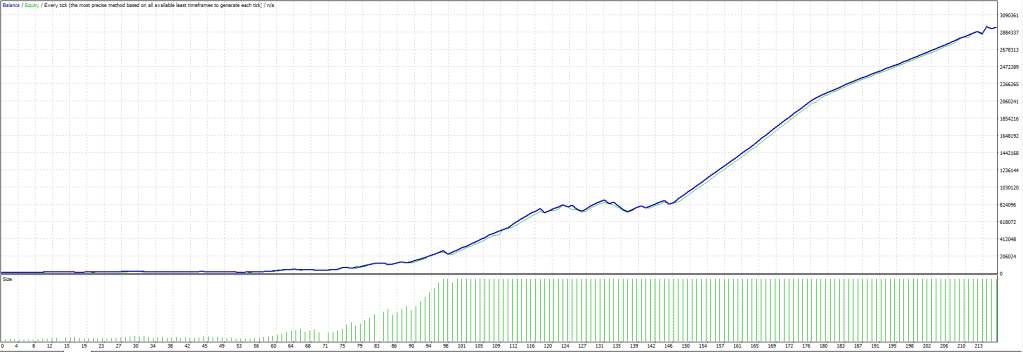
Baffled by my own creativity, here’s a 2-year backtest, starter-divider @ 4 of the Municipal Trader Commercial CRE>
The last 2 final divergences framed the price’s playfield for Friday.
Be conscious of this bracket.
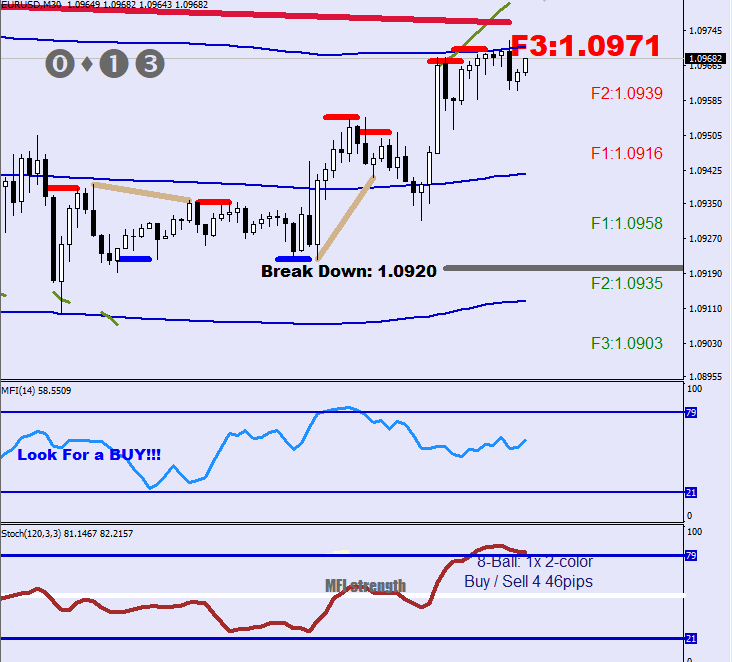
The logic behind the look for a buy is that the E-414 band is above the E-712, but it is actually not true, the 712 is inside the 414 band. This is as neutral as it gets.
Although I have a serious negative bias here (88% short) I still must acknowledge the setup. (if you look closer, the upper red divergence and the second from the bottom blue divergence provided the exact high and low).
A violation of 1.1020 would be a major offense and must have a plan for it.
The last auto trading routine I made (Beam Around) opened a short at 1.0965 and targeted 1.0875.
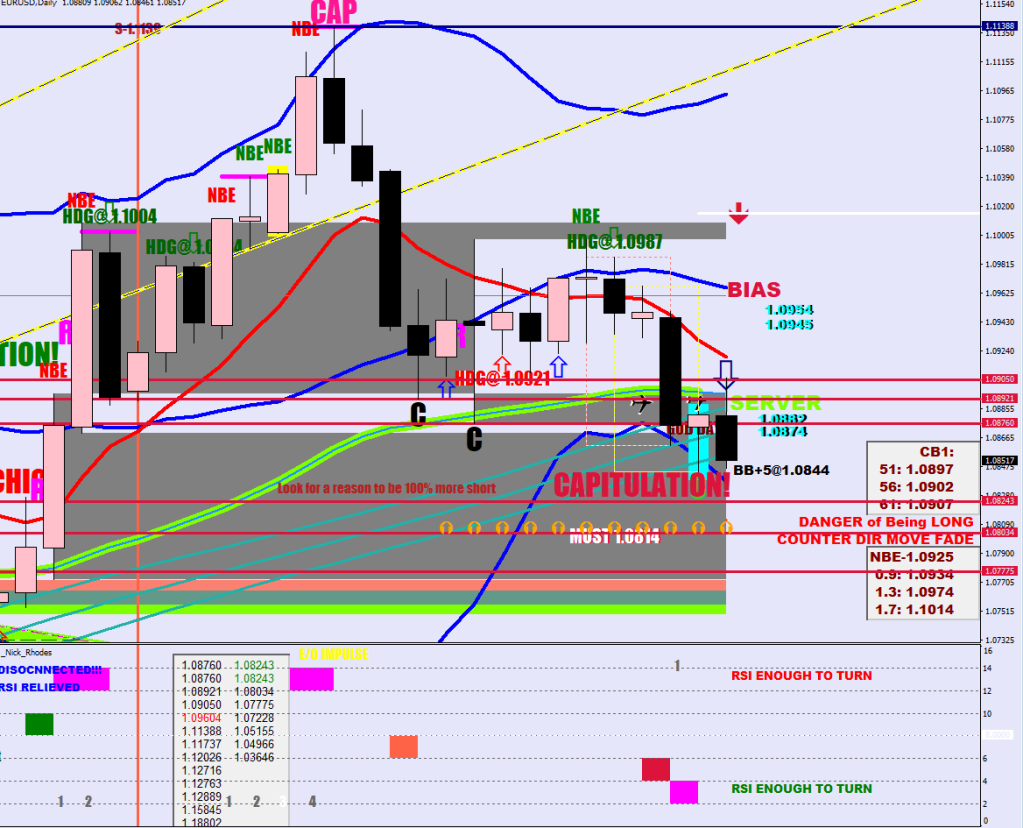
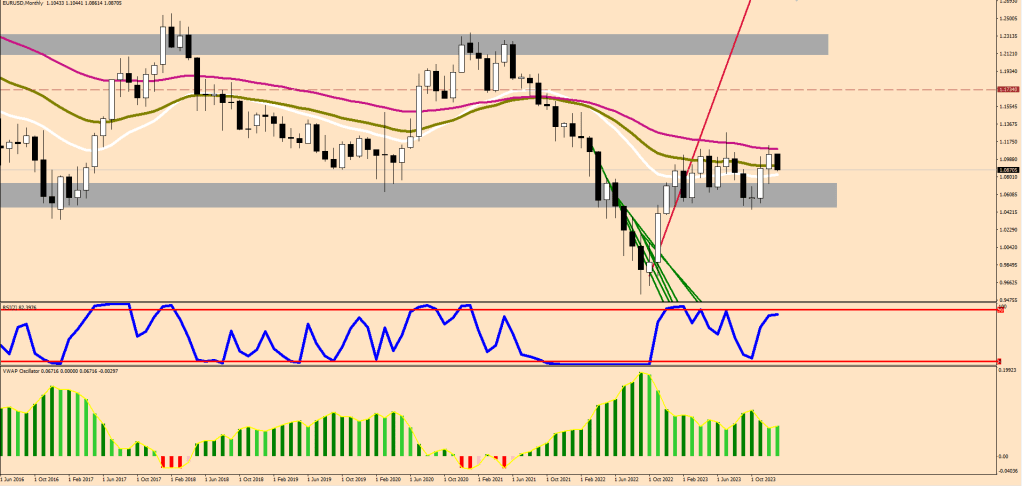
The monthly config remains bearish.
…
Thursday was good with $1,212 cash, but Friday I chickened out from the longs and made only $340.
The lower BB is at 1.0740. I think a big break is coming, so don’t stand in its way. Price has disconnected from the yellow high voltage, but kept on touching the low voltage life support, the E-9 in red. E-50 is the next power source and the 30-sample BB after that.
The unqualified saga may not continue much longer.
This is a neutral market (no volatility edge), but of course there was a vector before the stall, and in the end a continuation coming out of this temporary balance is still more likely than an opposing vector.
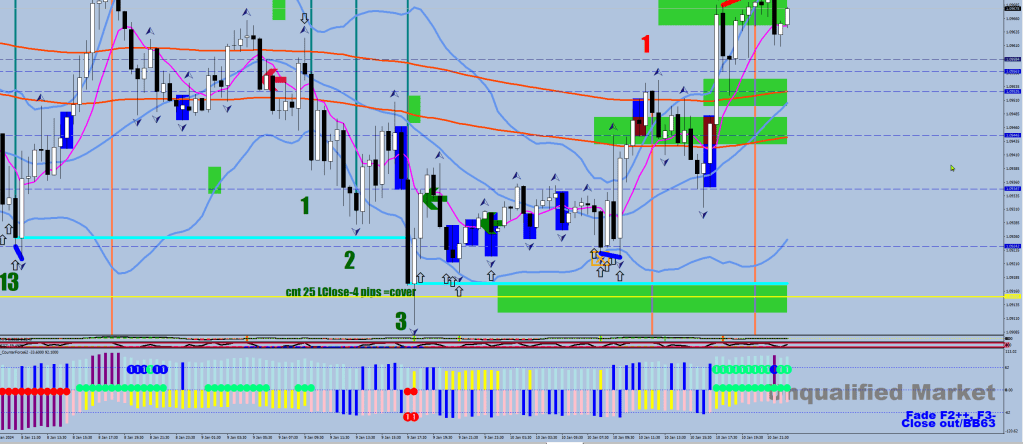
The play is to fade. What? The first fade is F2++ to F3-, but from the second trade on it would become easy to do so on any platform: fade te first hourly close outside the 30-sample BB and target the opposite end of the BB.
If this was the first trade, F2++ would mean 1.0949 and F3- would mean 1.0967. The plus and the minus both worth 5 pips each.
Axel S – a rather old routine can be used here as well.
The hourly “Mean” is E-32 HL2 (yellow). The 28-pip displacements I call the “safety” lines. The 59-pip one I don’t think I have named at all.
The idea behind the 0.28 vs 2.8 is that these are codes I can use to auto target these lines (at market crops outside).
Just like Marky Mark Wahlbergy Wahl, you better start thinking about a legacy.
Good Angulations
Writing a code that can turn 10k into a million plus in 4 years is a great feat, but you have to lube it up, juice it up and spice it up.
This test fell shy due to my broker having a 100 lots max limit.
I had to cap the calculated size just to be able to open.
Take a look at Cameron Hocus Focus. He knows he can’t trade for shit, but he always goes the extra mile to be in the latest, trendiest scams: he is on screen again offering “funded” trading accounts. That’s code for “give me your funds”. This is the low cost branch out on Forex scams.
Could not find a video, but the sales pitch of his started with “the Forex industry is dying.”
Good Bifurcations
My legacy would be passing on useful tools & thinking.
The powder boxes & the humps, i.e. the Karte Maplen is one example of this.
H3 resisted, re-inforcing the downtrend.
I was looking for a video about Sutherland telling the story of Wahlberg being next door, but the smell was coming over (he proudly claims genetical heretage in that interview), yet all I could find was this.
Good Strangulations
Luckily, there are those that care a great deal about their legacy.















 ForexFore - Internals, indicators, algorithmic trading