Enlightenment. People did not know to spit or to swallow when I spoke about re-inventing the TTM wheel.
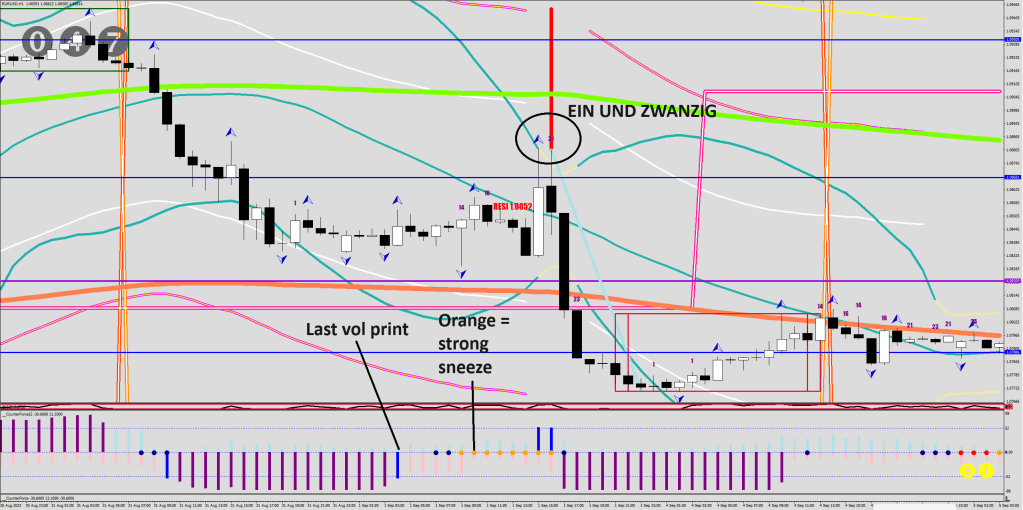
CounterForce52 with 18 sample is almost everything you would need on the hourly.
The last volatile print is the direction the sneeze is going to head to, and the timing knowledge obtained re: corrections can be well utilized. I’m talking of the 21 count.
See, the sneeze used to never come with a definite direction, it was merely called “continuation”. But the key is the volatility.
No volatility favors the bulls.
Which way is the next sneeze going to be disengaged to?
You need at least 2 hourly dots. Red or Orange. Ready or Not.
The sample size can be changed. I have 8, 12, 18 in use.
My idea of volatility is that it has a direction, a + or a – in front of it.
The dots were an after thought. A play on re-inventing Johannes Cartier’s TPM sneeze.
It is a bit of a challenge combining a histogram with arrow plots when zero is the lit value and EMPTY equals 2147483647 (0x7FFFFFFF). Had to go about it a different way and the displacement may be off depending on resolution / zoom.
They gave me 4 years, 3 more to go, keep chewing pretzels, time’s passing so slow.
Everyone is trying to guess the where of a continuation buy. Who cares about the when other than I?
What if I told you that the valley has the clock running at 2x speed?
Prevent horizon?
A snail has to be beauty and time conscious.
Inverse fair value gap SIBI mitigation? Nah.
Percentaggi? Ain’t that.
If you want your trading to become more of a smooth snailing, do the following:
Have a 30-min 30 sampl BB HL2 to spot the 3rd volatility breach (start of correction).
Have a 60-min chart with the Green River (E207 High & Low) and the Guard Rails plotted for 1 fluctuation maximum distance marker, be conscious of the time zone and start counting the hours.
Loneliness: 14-16 hours. 7 inside the valley
Disregard: 21-23 hours. 10-11 inside the valley.
Occult Populism
God forbid someone coming along and start telling you that trading was reactive.
I used to like this guy, but this video killed it for me. A painful joke from begining to end.
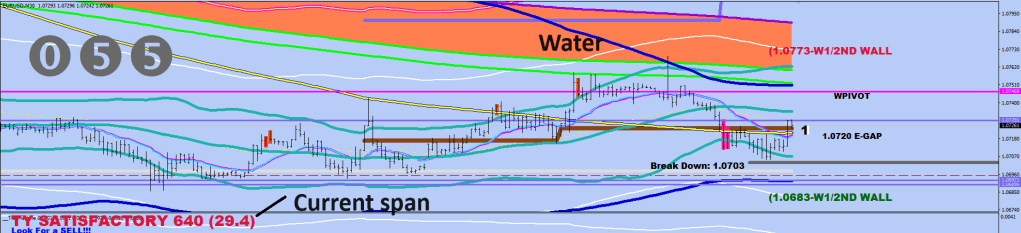
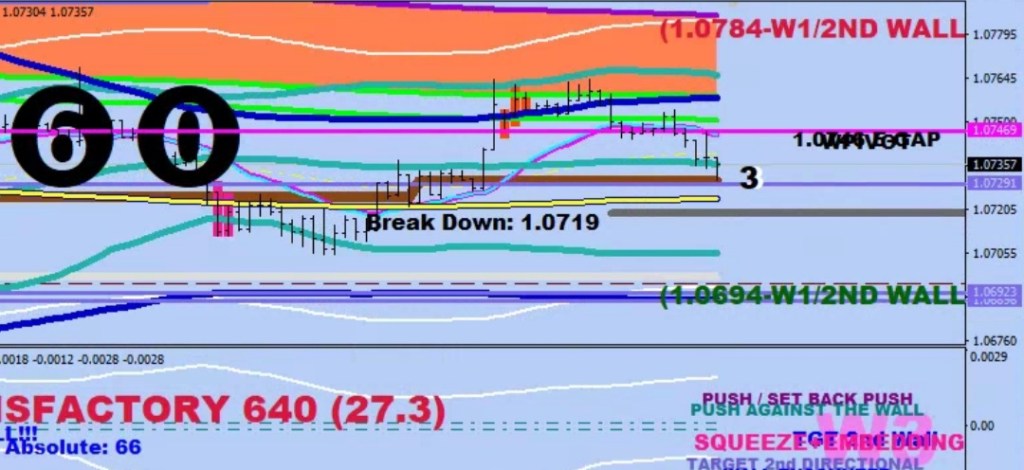
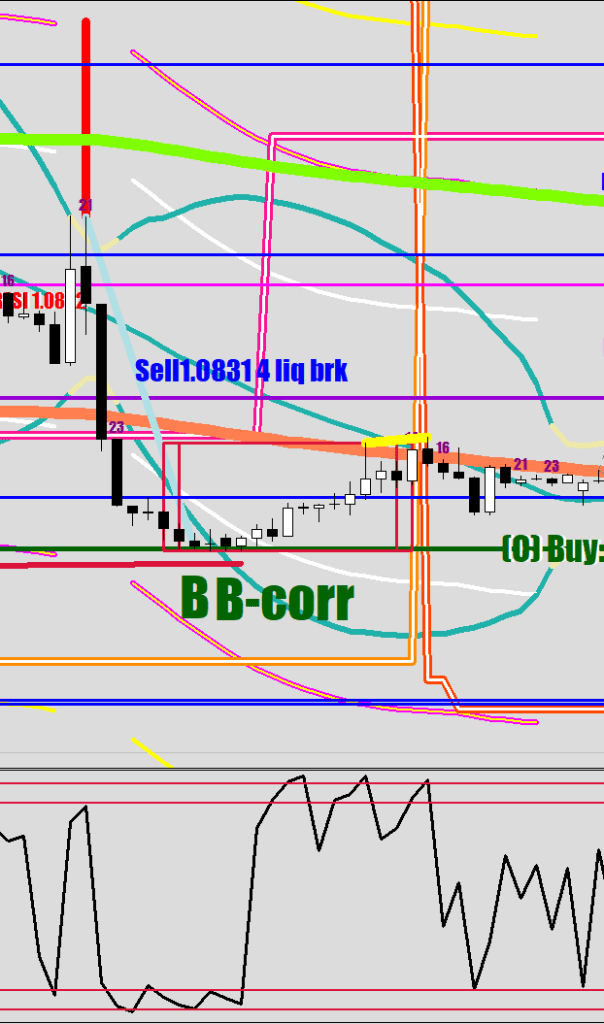
As you can see, there is no up, up and away from the bottom. There is a struggle to get higher. If there was a liquidity break, there could be a parabolic run up.
What are we waiting on? The water uo freeze over. It would do when the distance drops below 27 pips between the shores. This is a safety mechanism.
The fact that I have 0 followers has nothing to do with the fact that I do have the answers.
You have received 68 Bitcoins from a random address. What do you do?
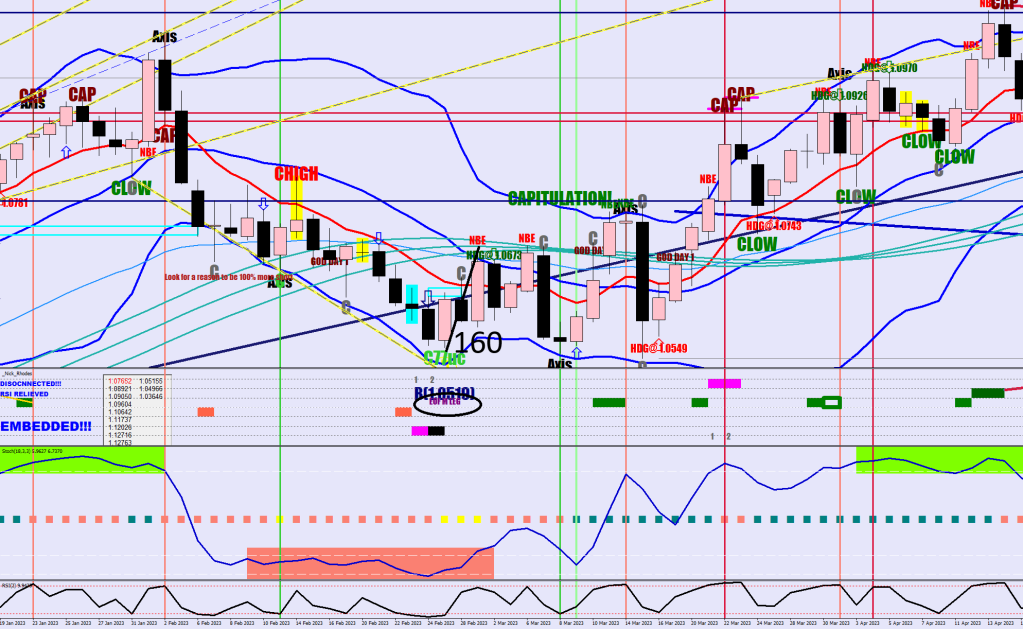
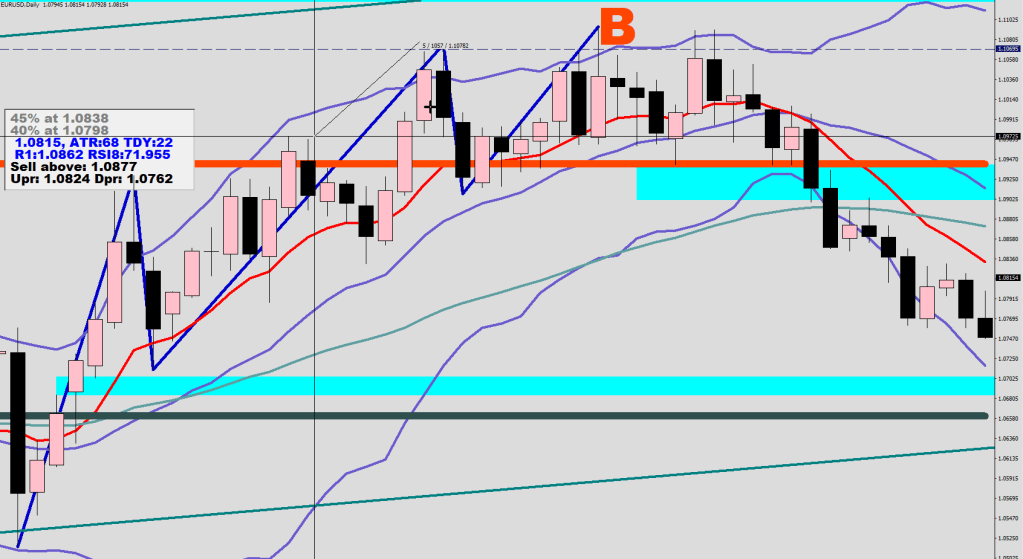
There was a lower low made for a black Nick Rhodes print, a close up and a 160-pip rally before the Beat was made. In fact this round trip was made twice with the second rally (the volatility whip’s V leg) touching the upper BB.
Diffrerences. Currently the lower BB is still being capacitated.
The downside stoch room difference between the two low close pro volume candles is huge. I would suggest that the pros dumped most of their holdings, but not all. The 160-pip rally would mean 1.0845 for the rebound. The script may still be valid, as the BB will continue to get closer every day.
Push and Echo go hand in hand, so does Measuring Leg and Divergent Leg, but I use the first two mainly on the daily and above whilst the latter pair on 4H and below.
Elliott, my no-good-for-nothing son! Sit up straight in my class.
For your Corrections exam you received a C. You even failed to name the 3 kinds of the corrections.
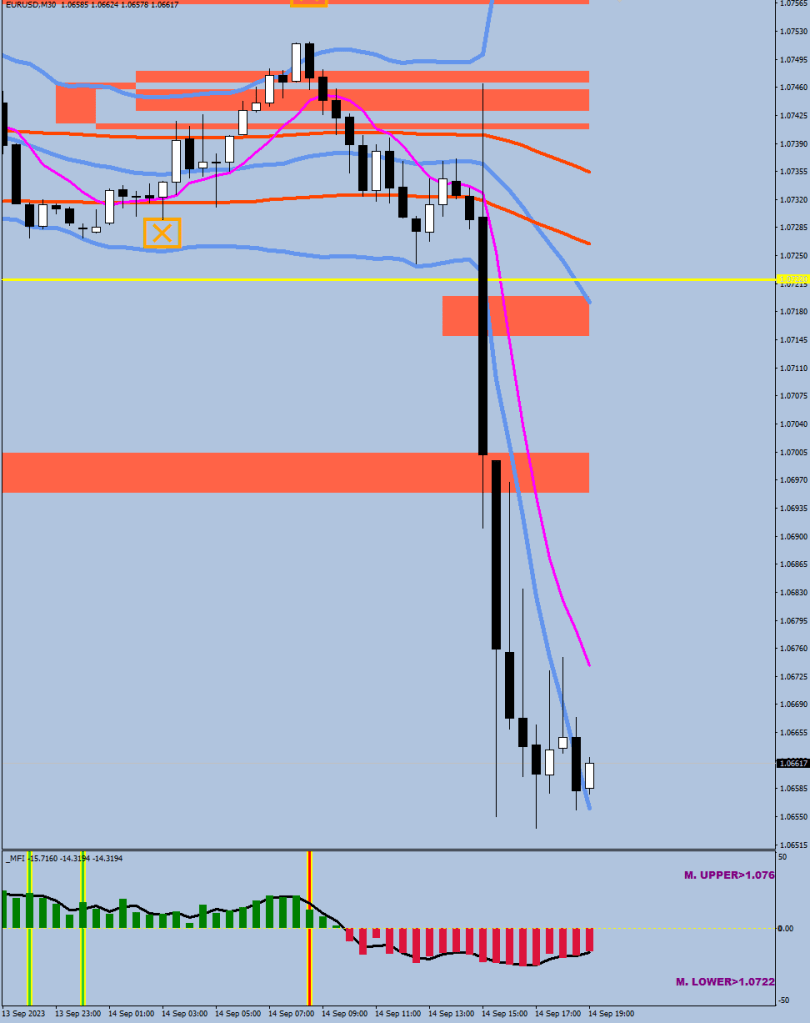
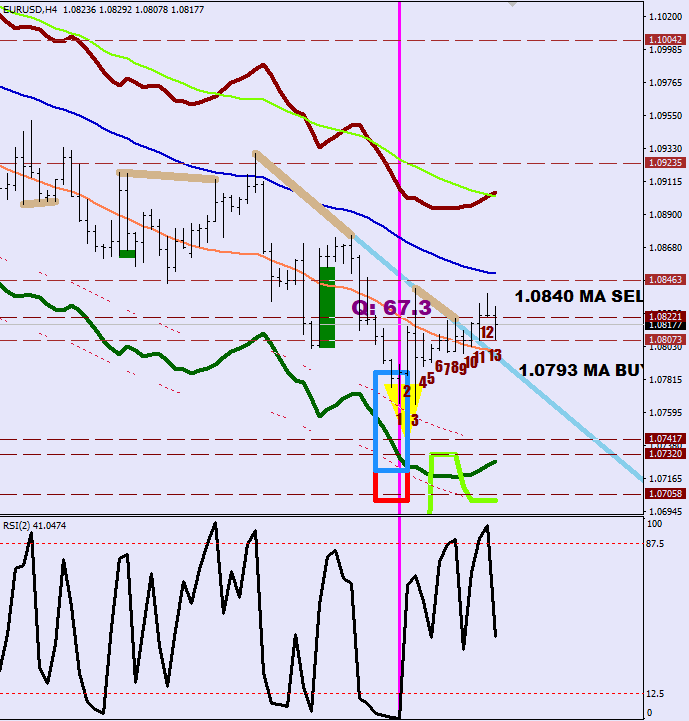
The loneliness correction likely occurs when the 30-sample hourly BBs are still expanding. The price only makes it to the other side of the S30 by the 14th, 16th hour. Example:
The disregard correction likely occurs when the 30-sample hourly BBs have stopped expanding and the correction reaches its peak at the 21st / 23rd hour, often breaching the upper band. The S30 often gets challenged before the 14th / 16th hour. Example:
The 3rd correction type is the Liquidity Break.
Image below: Loneliness or Disregard?
We use indicators because we don’t have X-ray vision. You cannot just eyeball a candle and determine that the hourly RSI2 was below 6, I start counting the hours of the correction here.
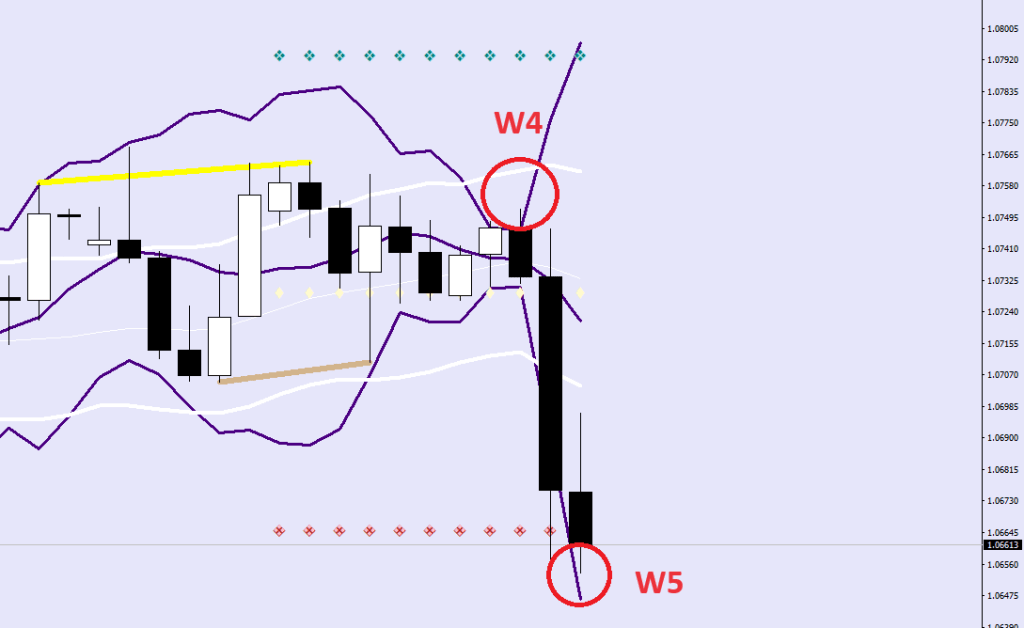
For Wave Structures, you got an F. The volatility whip is not part of the wave structure, thus no labelling required. Recent Vol Whips highlighted.
Wave absorption is an experimental field. Usually it is Wave 4 that gets absorbed throwing off the count. My suggestion is a 6-sample 3SD 4-hour BB to spot the breach during extreme compression of volatility.
Back to Ricky Gervais.
He is dancing with Seona tears in his eyes.
The Seona images are from brochures. My only criteria was that they were taken the same day, so this image did not qualify:
Nor did this:
These did.
These two below look exactly like my wife & kid. What a coincidence!
Viva La Republica
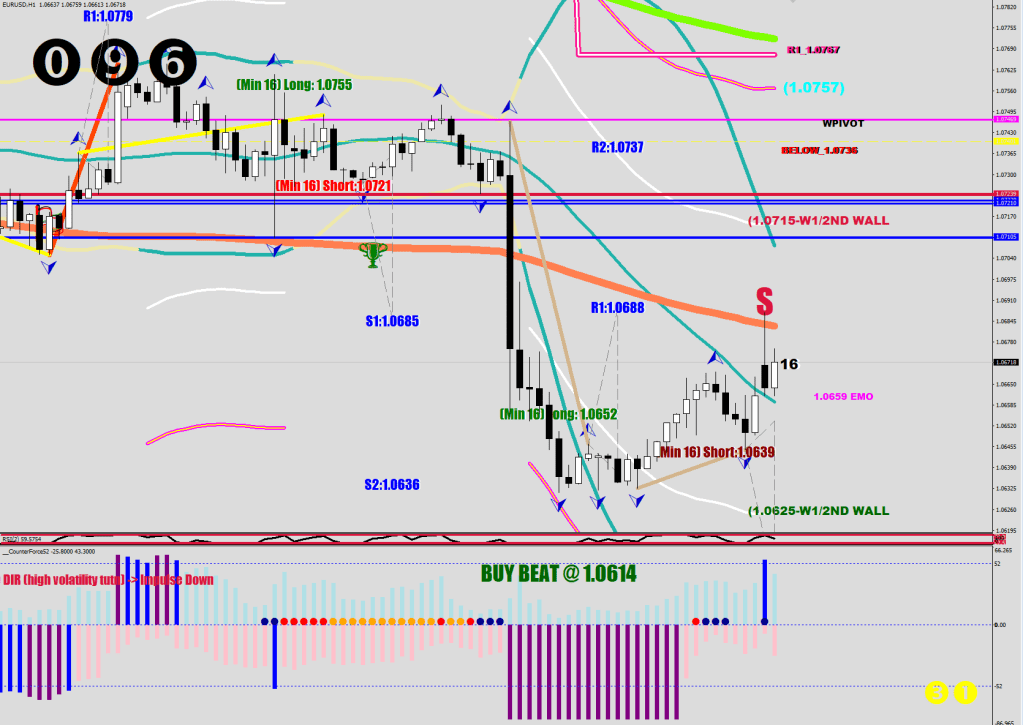
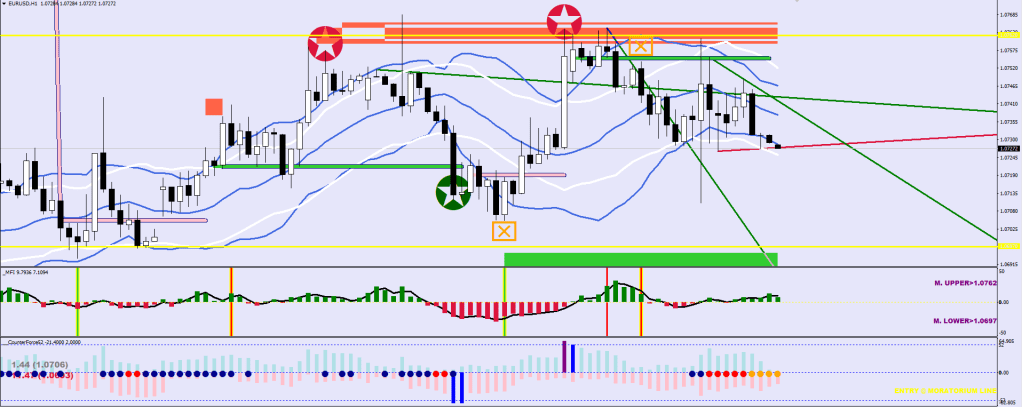
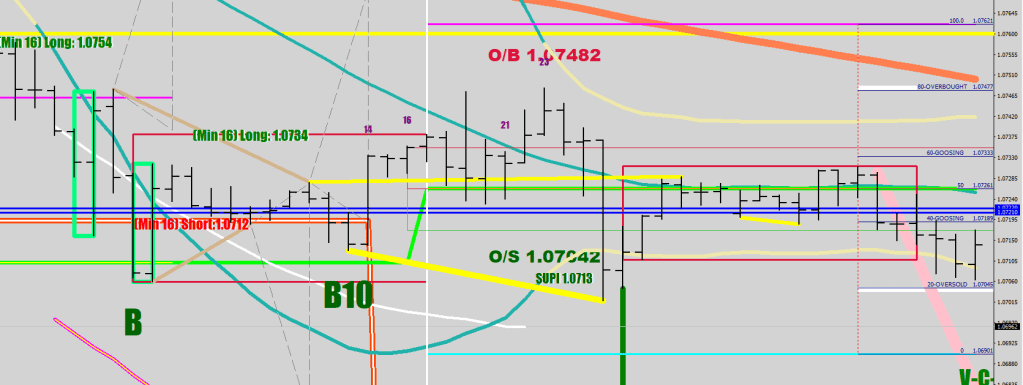
The above call was made when the 1st powder box printed on the downside.
I remembered a setup that was the mirror image of this, on the second run the red line proved to be final. Of course, in this case the continuation divergence got broken and they rounded up the short gains a little more. I would expect the 50% of this new powder box to hold. Call it 1.0687
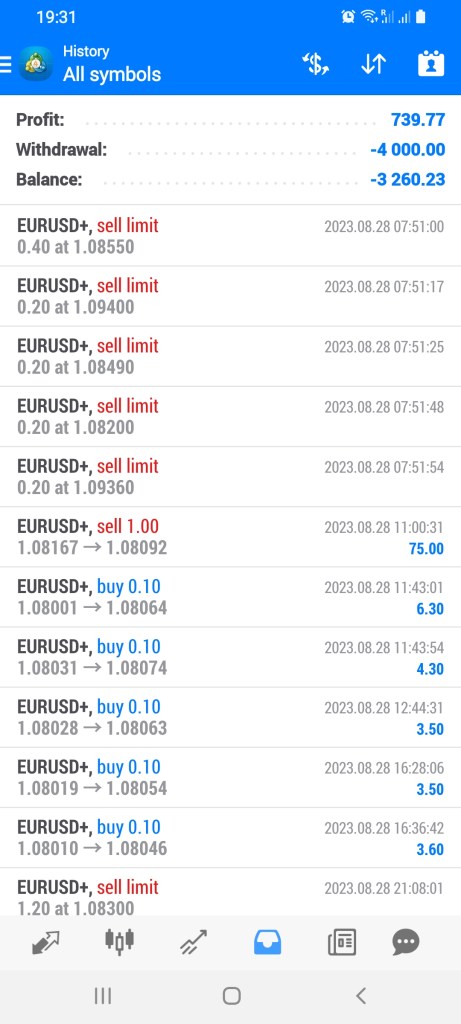
The great thing about Forex trading is that you can get away with little time by the computer. Crossing borders, flying for days, sailing without internet, buggy riding does not have to stop you from bringing your average holiday or not. Daily $500 is $2500 per week.
$2,9555.60 / 4 days (=$738.9 avg.) meets the criteria.
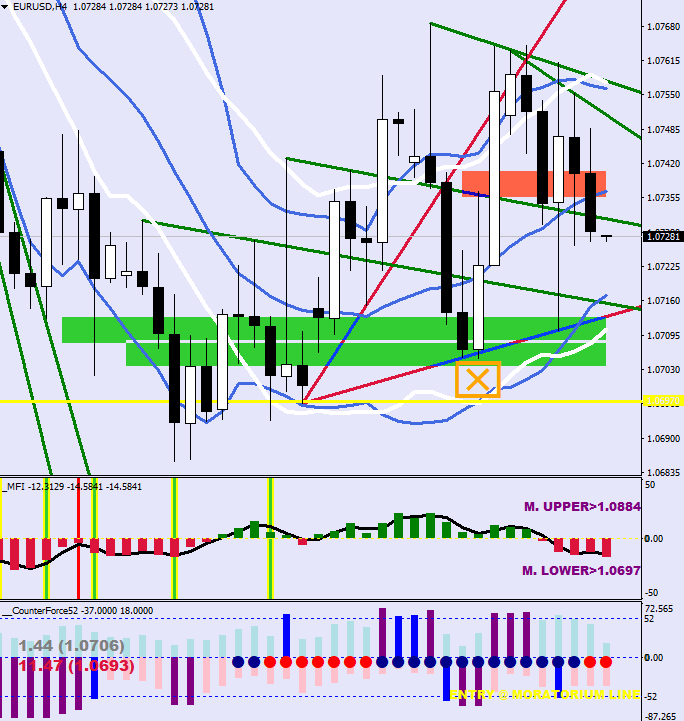
Don’t worry, won’t hold you for long. My target for the Wave 5 is 1.0705 (red square bottom). After that a vol whip’s V leg back to the continuation high (1.0950)
So what is Dominic doing over here? I left on Monday with a last minute withdrawal.
Teaching turtles algae jumping. I have gotten good at Photoshopping feet.
My new movement is this: make it and then pretend you’re faking it.
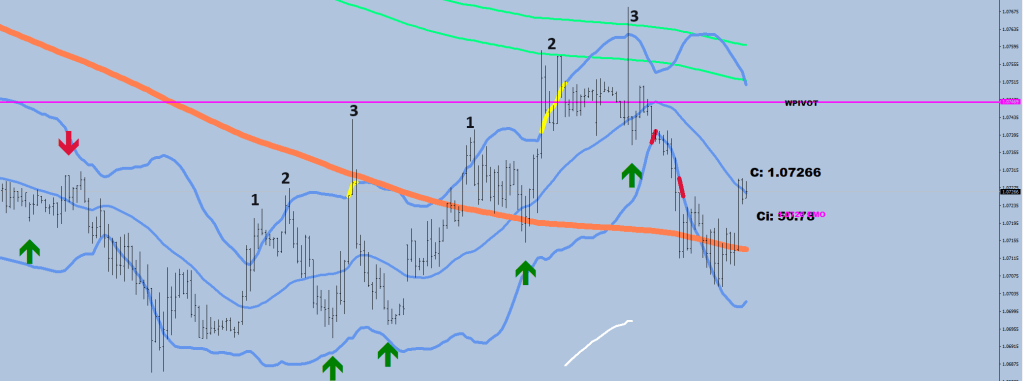
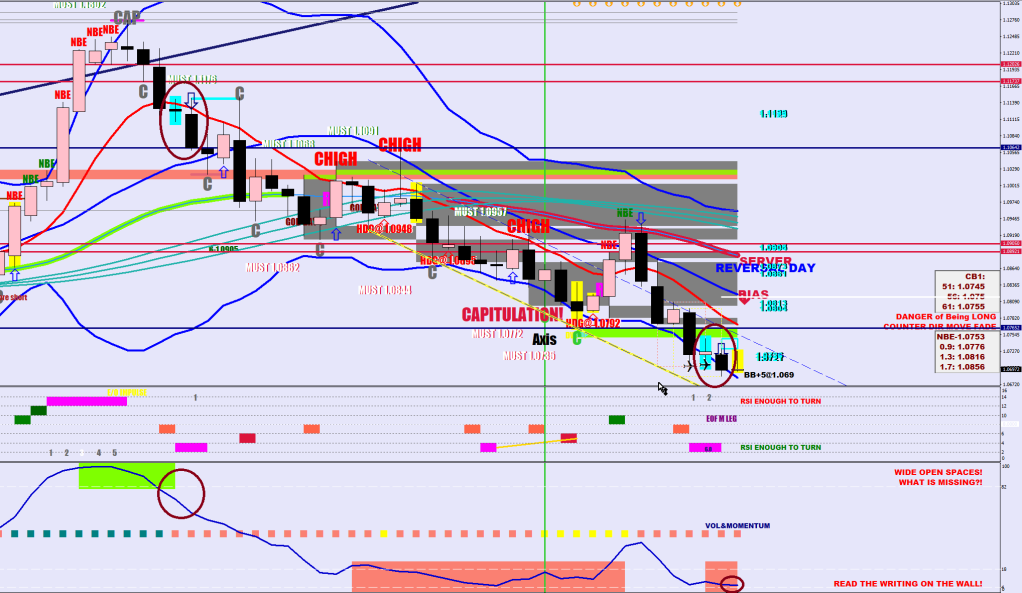
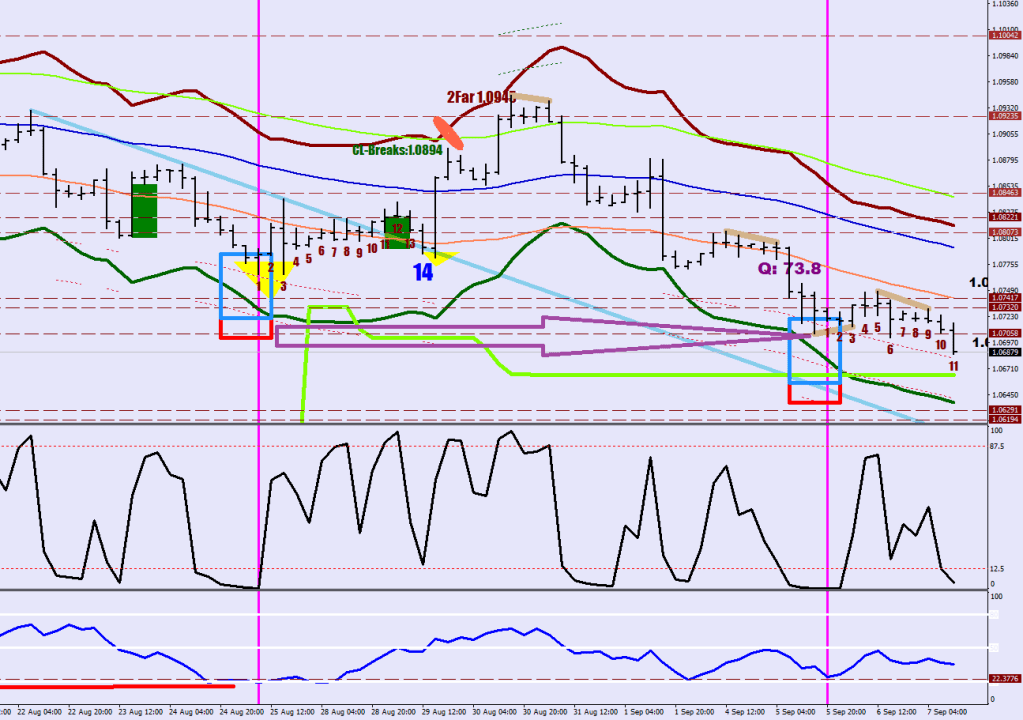
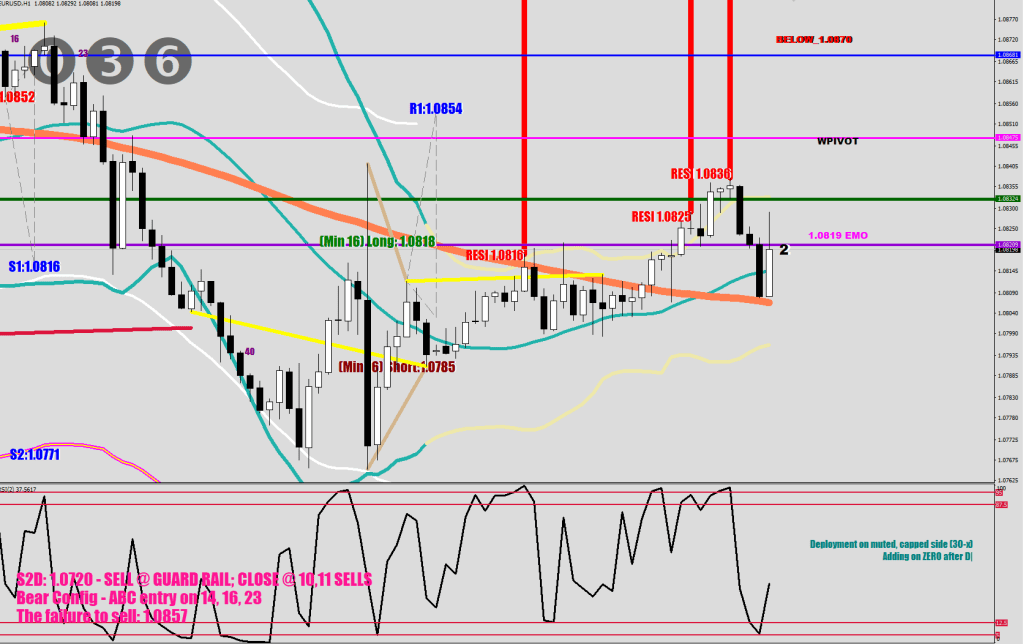
The process of turning the direction back up requires 2 triangles.
The 14x 4 hrs count is there to find the “head”.
The uptrend requires the print of the 2nd triangle, the right shoulder / higher low.
Of course, there can be surprises beyond the 14 print, but the red zone of the powder box should set a limit to this.
Since the higher low would be a correction, it would have to poke below the Lower Guard rail, which is the 4 hour E-52 minus a fluctuation maxiumum (38.4 pips – in orange). The first dotted line represents “deep correction” which is an additional 60 pips out.
This is my explanation as to why I am currently fully hedged despite the blue trendline has been broken to the upside.
There should be a higher low print – or a push back on the head.
There is one more thing. The 3 resistance prints (red laser beams) in close proximity would suggest a deeper pullback / continuation down.
Yes, this is going to be a CNT. Much too technical.
I guess I have not really shown you examples of the 100-pip stepping blocks at swing turns.
This was meant to be the lead up to the first answer about why use a 100-pip (1000 points) displacement for the bumper lines.
   if (High[i+20]>iHigh(symbol,0,iHighest(symbol,0,MODE_HIGH,200,i+21))) upperbumper[i]=High[i+20]+1000*Point;
    if (Low[i+20]<iLow(symbol,0,iLowest(symbol,0,MODE_LOW,200,i+21))) lowerbumper[i]=Low[i+20]-1000*Point;


We are talking the protruding green and orange lines. Some help with the limitations.
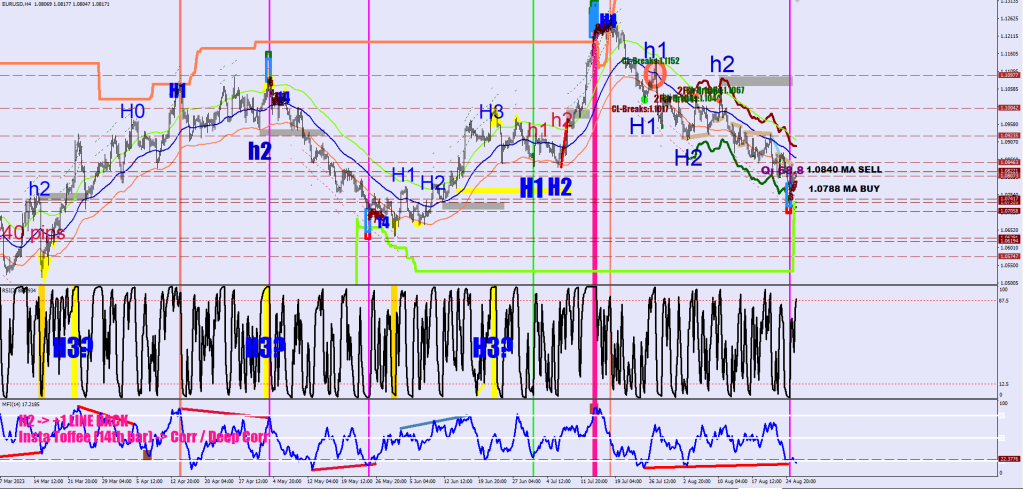
By the way, the market has already gone into escrow, doing its 14×4 hrs count.
The powder boxes could print without touching these lines, but overall, price will not go without noticing it by at least a touch & divergence or a near miss.
Example below for the touch & cca 100 pips miss-divergnece.
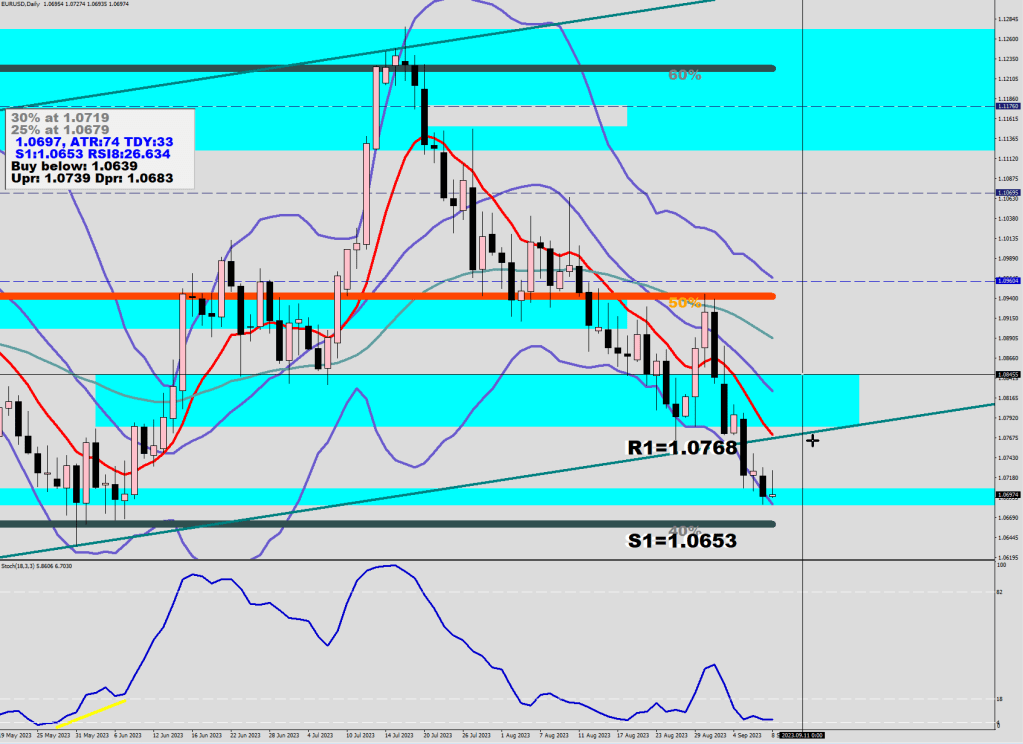
Now a quick supplementary info on the E-50 band on the daily. It is actually a 20-sample E44 smoothing and the other two bands are 10-sample 1 std displacements.
Pretty sure I’ve posted the code before.
#property copyright   "Bands by Macdulio, (c) 2021"
#property link        "http://www.forexfore.blog"
#property description "Bands by Macdulio"
#property description "You don't defy the first day"
#property description "Passing through God."

#property indicator_chart_window
#property indicator_buffers 3
#property indicator_color1 LightSeaGreen
#property indicator_color2 LightSeaGreen
#property indicator_color3 LightSeaGreen

extern int lookback = 1000;
double ExtMovingBuffer[];
double ExtUpperBuffer[];
double ExtLowerBuffer[];
double E44[];
//+------------------------------------------------------------------+
//| Custom indicator initialization function                         |
//+------------------------------------------------------------------+
int init()
  {
   IndicatorBuffers(3);
  // IndicatorDigits(Digits);
//--- middle line
   SetIndexStyle(0,DRAW_LINE,0,3,indicator_color1);
   SetIndexBuffer(0,ExtMovingBuffer);
   SetIndexLabel(0,"Bands SMA");
//--- upper band
   SetIndexStyle(1,DRAW_LINE,0,3,indicator_color2);
   SetIndexBuffer(1,ExtUpperBuffer);
   SetIndexLabel(1,"Bands Upper");
//--- lower band
   SetIndexStyle(2,DRAW_LINE,0,3,indicator_color3);
   SetIndexBuffer(2,ExtLowerBuffer);
   SetIndexLabel(2,"Bands Lower");

   return(0);
  }
//+------------------------------------------------------------------+
//| Bollinger Bands                                                  |
//+------------------------------------------------------------------+
int start()
{
  ArrayResize(E44, Bars);
  ArrayInitialize(E44,EMPTY_VALUE);
  ArrayResize(ExtMovingBuffer, Bars);
  ArrayInitialize(ExtMovingBuffer,0);
   ArrayResize(ExtUpperBuffer, Bars);
  ArrayInitialize(ExtUpperBuffer,0);
     ArrayResize(ExtLowerBuffer, Bars);
  ArrayInitialize(ExtLowerBuffer,0);

   int i,j;
   string symbol = Symbol();
double std;


for (i=lookback; i>=0; i--){        E44[i]=iMA(symbol,0,44,0,MODE_EMA, PRICE_MEDIAN,i);

}


for (i=0; i<lookback; i++){
      for (j=i; j<i+20; j++)
      ExtMovingBuffer[i]=ExtMovingBuffer[i]+E44[j];
       ExtMovingBuffer[i]=ExtMovingBuffer[i]/20;

}

deletetxt1("God");

   for (i=lookback-1; i>=0; i--)
   {

      std = iStdDevOnArray(ExtMovingBuffer,0,10,0,0,i);


   if (High[i]>ExtMovingBuffer[i]+100*Point && Low[i]<ExtMovingBuffer[i]-100*Point && !(High[i+1]>ExtMovingBuffer[i+1] && Low[i+1]<ExtMovingBuffer[i+1]))
          ObjectCreate("God"+DoubleToStr(i), OBJ_TEXT, 0, Time[i], ExtMovingBuffer[i]+130*Point);
          ObjectSetText("God"+DoubleToStr(i), "GOD DAY 1", 14, "Impact",  Maroon);

   }

   return(0);
  }

   void deletetxt1(string text){
   for(int iObj=ObjectsTotal()-1; iObj >= 0; iObj--){
      string   on = ObjectName(iObj);
      if(StringFind(on, text) == 0)  ObjectDelete(on);
}  }
Now, down to the subject of the B-s.
B36 9cnt aka B sensitivo
The sensitive B is an RSI2 divergence that occurs within the hourly 30-sample BB HL2.
Two examples below.
The way it behaves is the following: a 9-hour counter starts ticking. If price comes back within that time to retest the low, the divergence is “confirmed in”. The back test should not exceed the divergent low by more than a handful of pips.
The one on the left shows when price is taking longer than 9 hours to return, it gives way and there would be a lower low made about 36 pips out.
Two more earlier examples for this step down function. Wait a couple of pips to get in, you’ll still have 36 or so to cash in.
No, I did not have this plot on Friday yet, but I was certain I wanted to cut all the shorts as close as possible it was to the low made earlier, so I kept closing them by 10 more micro lots every lower / closer print.
I’ll be in the Caribbean till the 6th, so no articles for a while.