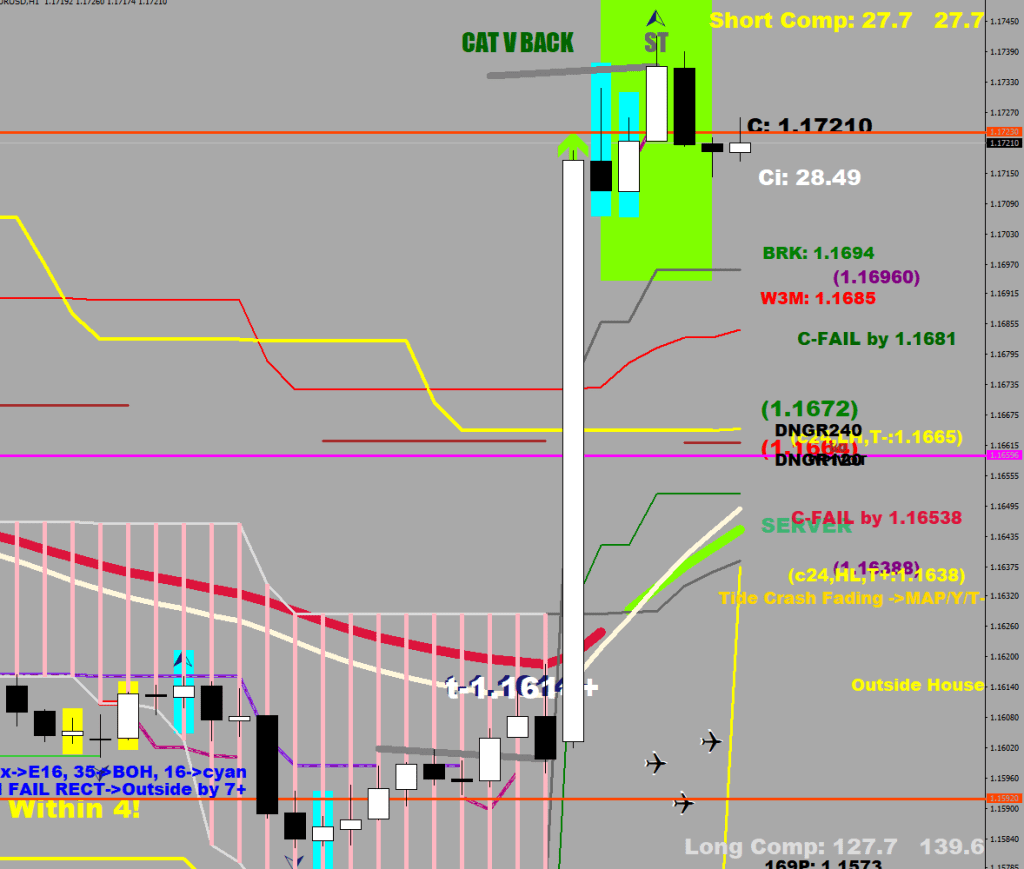
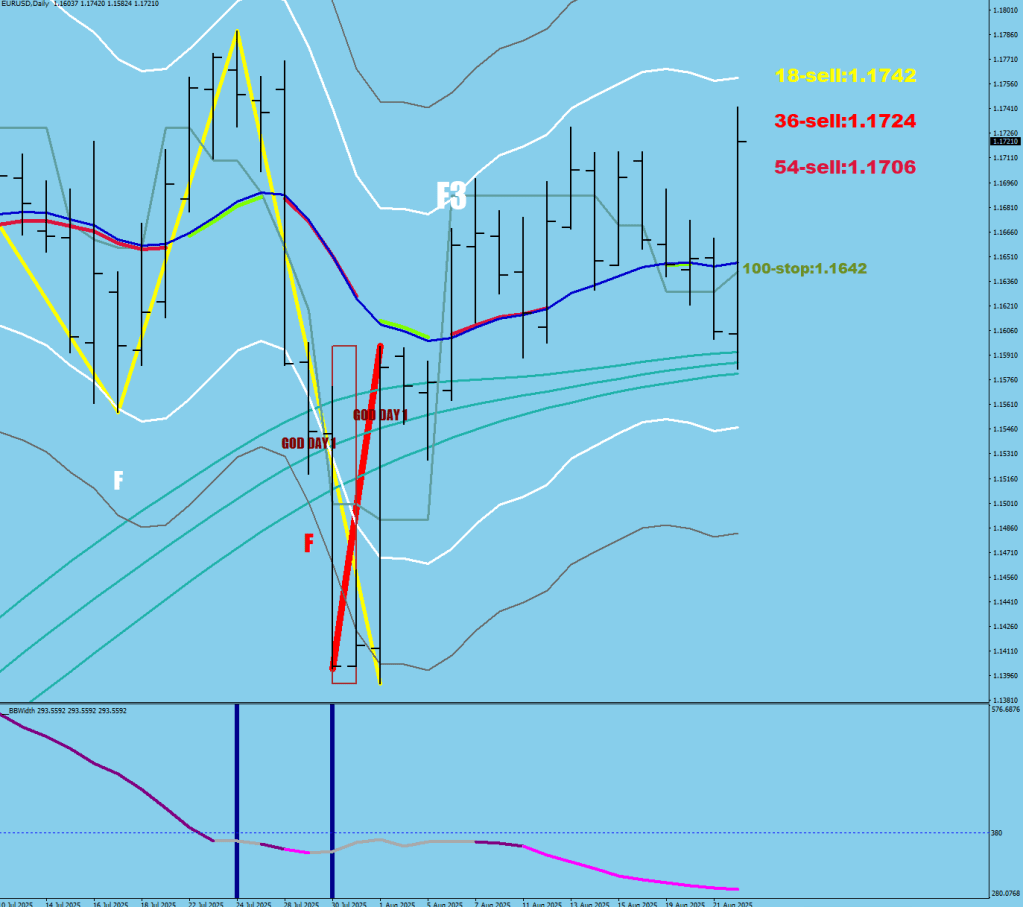
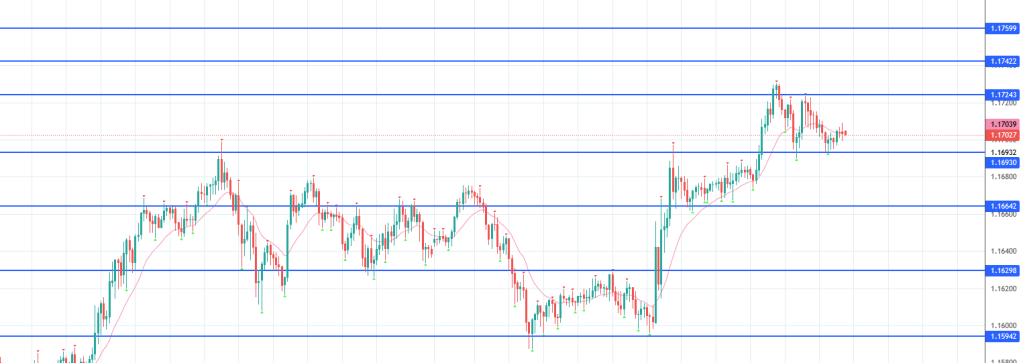
Getting everyone wrong-footed is certainly a possibility here from taking the price from the 100-sample delayed 2 STDV 120 BB’s low to its high in 2 hours. 1.1736 is the 1st established level, it could serve as resistance.
I would say if they do not gap the price beyond 1.17, the open would be purchased for a re-test of the high.
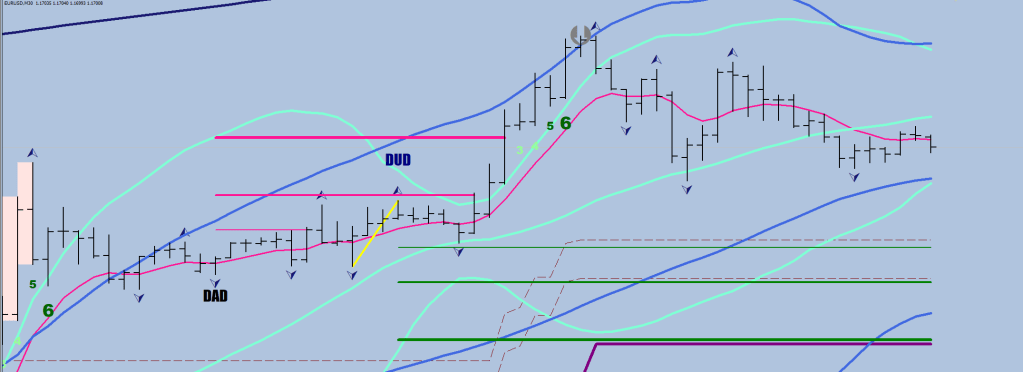
Your buy level should be in the black line (E-16) to the white line (E-44) zone on the 30-minute for another leg up. The deeper it dips, the closer you are to finishing a structure.
The move was the pendulum max, near “300”. 255 to be more precise. The need to consolidate the energy would certainly mean some downward pressure.
The house would have to be made back up right to fail at its top. So, probably no free fall for now, although there is no professional volume till the low 1.16s. (There is a suspicious doji at 1.1646)
Overall, the 30-sample BB should see another attack, which is now at 1.776, but could bow back a great deal by the time of the encounter.
I think that we are close to finishing a 5-wave structure to the upside with the volatility hitting its lowest reads. Lower high altogether.
September = deflation kicking in?
Album #83 was released. All original tracks, well, sort of. Mostly early ’80s disco (think Madonna) and Flashdance drums. I have certainly got the producer part down by now after 1,300 tracks. No rookie mistakes here.
…anticipate a turn, even if that does not seem to be in in Australia.
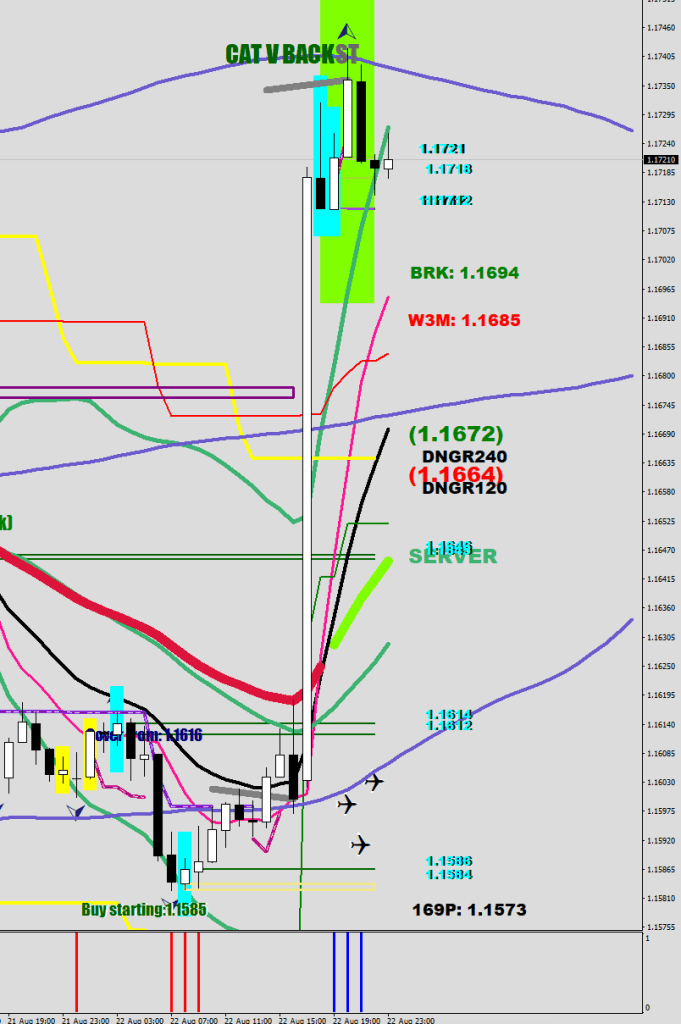
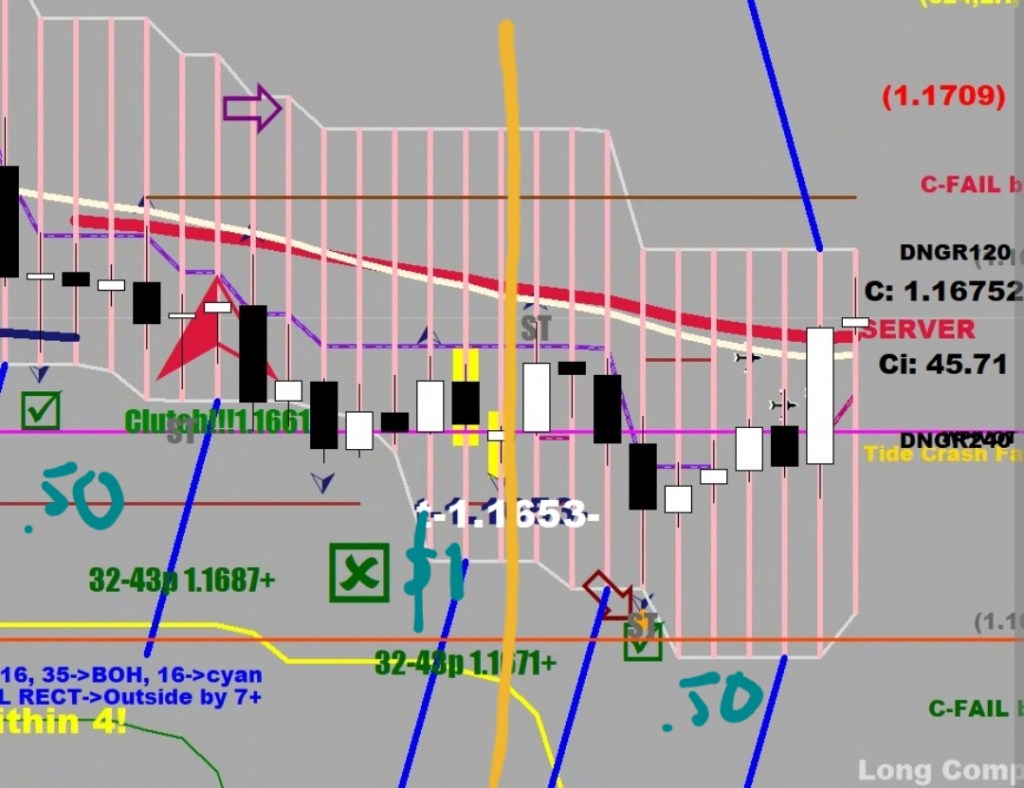
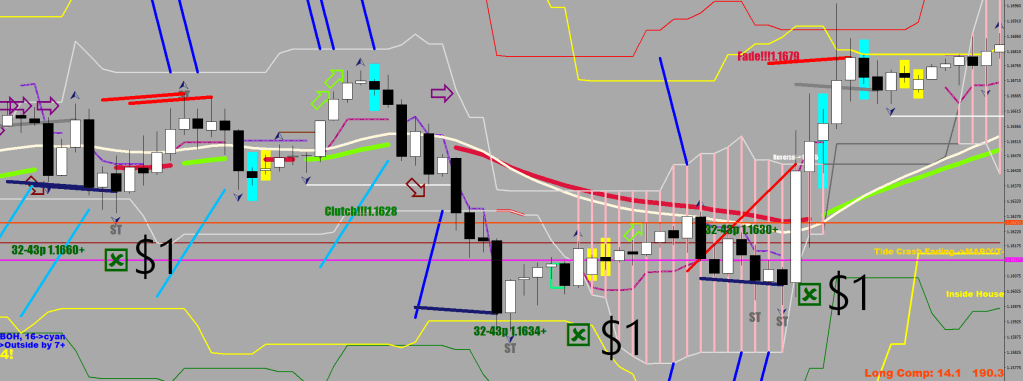
An example of practical application of my dollar system.
Here we had a dollar fifty up to the vertical line , not quite enough for the 2-dollar turn.
So what was my thinking? We need 50 cents more. Looking at the billboard menu, that’s a near miss of the edge of the house. Scale out of shorts, scale in to longs.
Until the volume retutns with September, the moves are likely gonna be cut short.
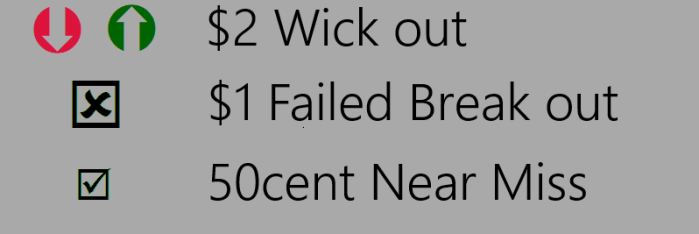
From here? I would fancy a wick out with some mustard on the side.
A quick note on how we don’t live in the same world: if I had a 1000 lives I still would not care to visit Dubai.
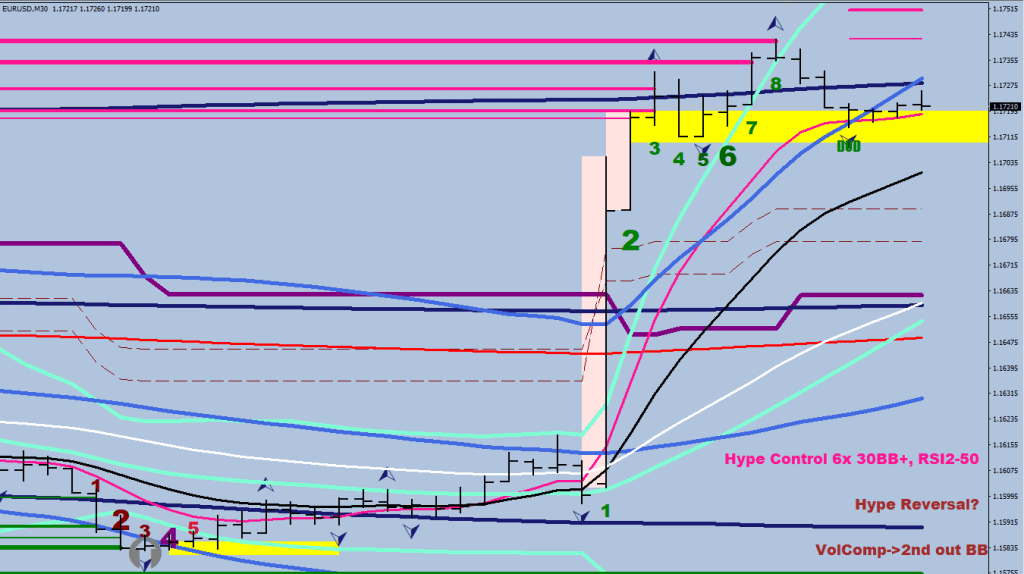
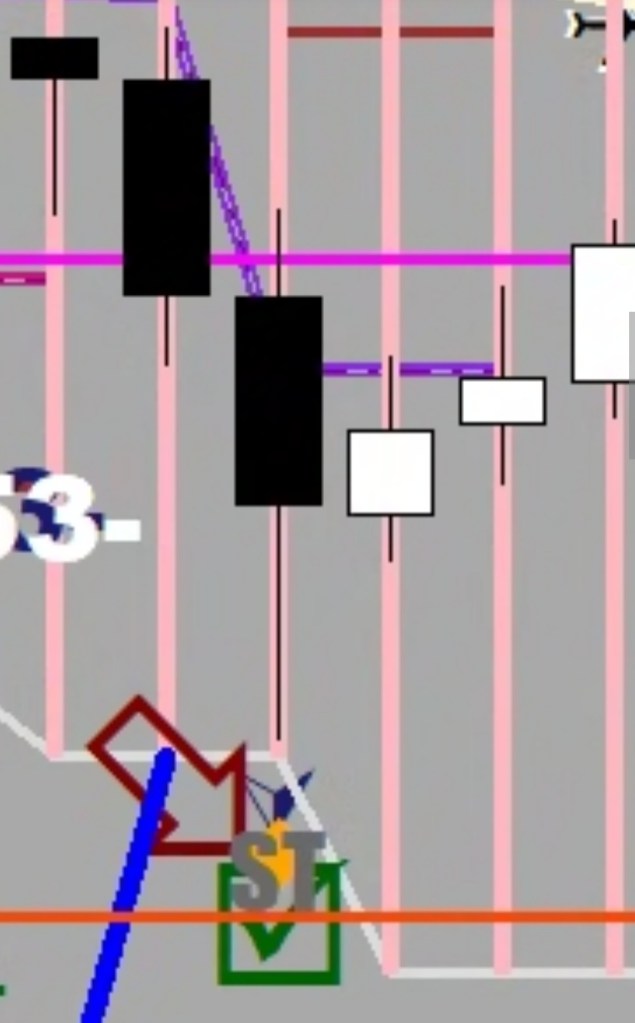
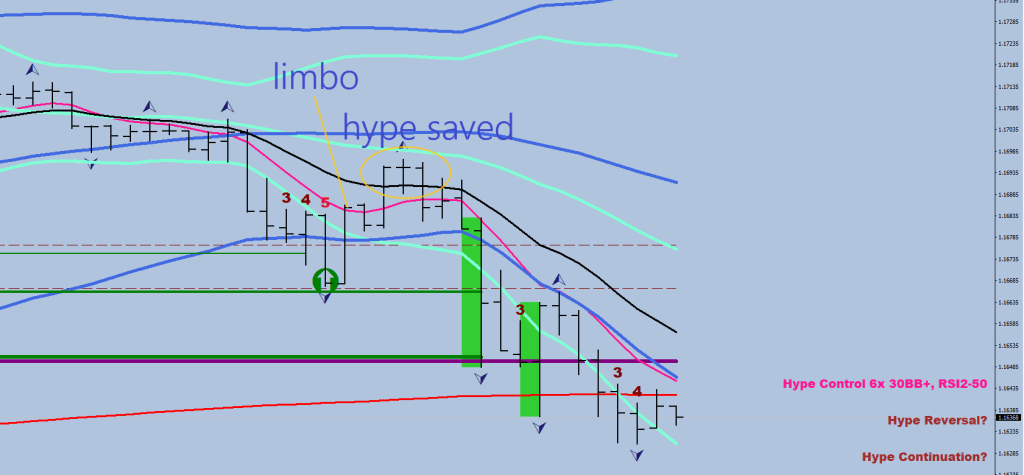
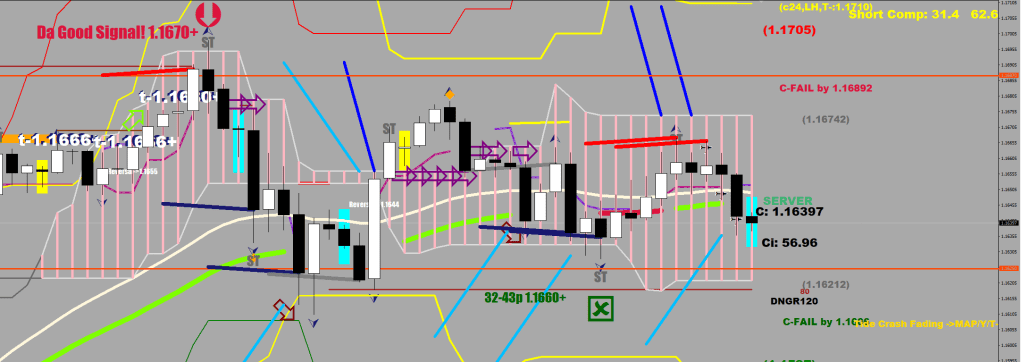
If #3 is a warning that a hype may be starting, then #4 is the on and off switch.
What do I mean? See, the run-up had two numbered sequences. The first #4 was a “game on” call.
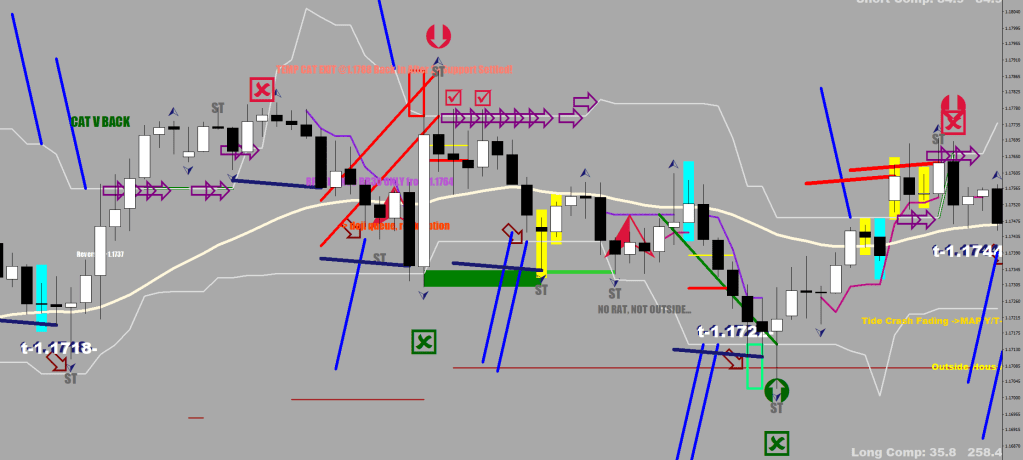
When the counter-volatility returned a bit (pink thing), the perfect entry for the continuation was just below that first #4 down candle, but it was also just below the E-16 in black.
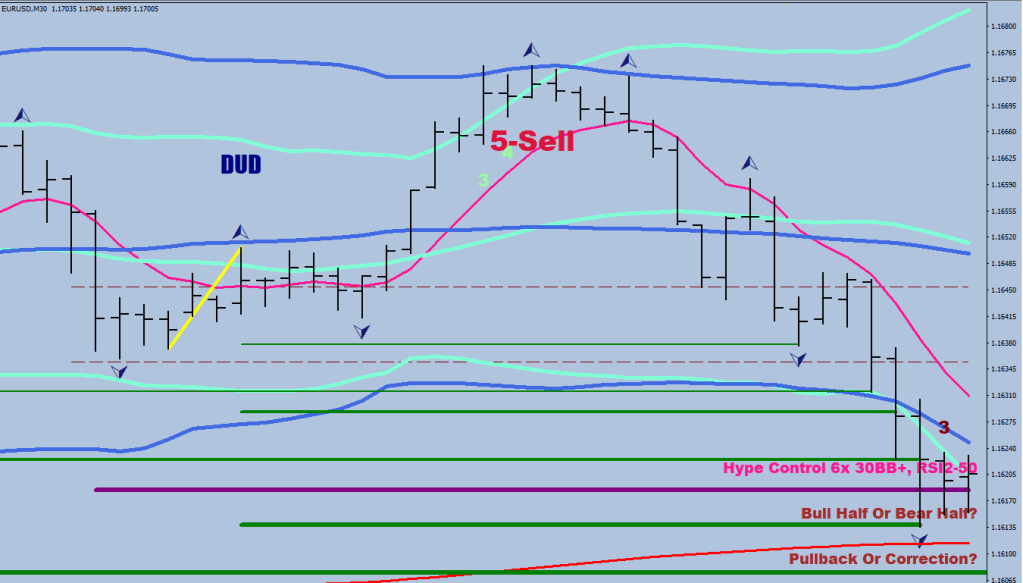
The second #4 is likely called the sell level with its close.
Based on what?
Based on that, the second #4 is likely an off button.
This second #4 matched the low of #3. So did the one match the high of the #3 in the first pic.
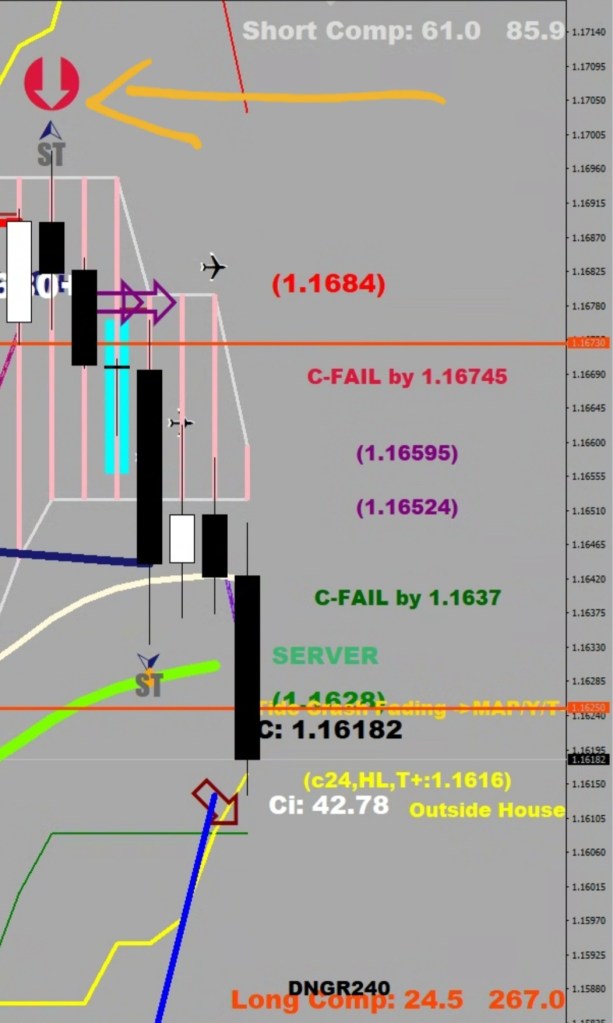
In the 3rd example, the second #4 did not make it outside the 60-sample BB, so the second #6 filled in for it. Wherever it closed, there were only a handful of pips let on the bone.
I got very close again to looking up that YouTube interview where the guy pleads that there is no “time” in the market. It goes perfectly with the timing is everything theme here.
16 new tracks bring the total to 1,260 on the Topic. How many were the record for a single person in an entire life before me? I think I have 10k in me.
I am spending all of my time with one instrument, figuring out the conditions necessary for a turn, how the hype works, entries, and plausible exits.
To monitor the progression of a hype, be on the 30 minutes.
A hype is momentum embedding. The hype has an objective, which is freedom, liberation. The hype is a method used to get the price outside the yellow lines and have it consolidate there.
A hype-phase is at least 5 closes outside the 30 BB (HL2) on the 30-minute chart.
A hype can fail on the 5th candle if there are no closes outside the 60 BB despite prior interaction with it.
An all-out hype arrives with the 6th consecutive close outside the BB 30 and gets confirmed by a 1-hour pullback, responded to with a 30-minute engulfing print. From then on, the attack on the yellow line becomes blatantly clear: likely any 1-hour pullback would receive retaliation in the form of a 30-minute engulfing move.
Success is still not guaranteed, if 3 engulfing moves do not manage to put the price past the yellow line enough that the correction setting in would cap out at the yellow line, the hype would end up being a failure.
During an all-out hype, the 8-EMO would remain largely untouched, but a piercing is a sign of the last charge starting. A fallback to the house is a location for adding.
A pullback lasting beyond 1 hr is the first leg of a correction. The correction ends the hype, but it is giving birth to a final thrust. In the first 4 hours of the correction (that shall last 4-9 hours typically) you would already have the support level made in the form of the deepest close. If you get a retest of the deepest wick as well, that is a place to put on some extra money.
Otherwise, there are one-size-fits-all all people with no practical advice. I.e.:
EW1: This is Wave 3 down (so you could sell practically anywhere, right?)
EW2: This is a Wave 3 up (so you could buy practically anywhere, right?)
me: You need $2 for a bottom
Keep the change.
Found a 50p coin so far.
There was a hype, there will be a higher high after the correction.
    if (Close[i]>iBands(symbol,0,30,2,0,PRICE_MEDIAN,MODE_UPPER,i)) counter++;
      if (Close[i]<iBands(symbol,0,30,2,0,PRICE_MEDIAN,MODE_UPPER,i)) counter=0;

      if (Close[i]<iBands(symbol,0,30,2,0,PRICE_MEDIAN,MODE_LOWER,i)) counterd++;
      if (Close[i]>iBands(symbol,0,30,2,0,PRICE_MEDIAN,MODE_LOWER,i)) counterd=0;

 //downside counter
       if (counterd>2 && counterd<7){
               ObjectCreate("Countesst"+i,OBJ_TEXT, 0, Time[i], High[i]+50*Point);
                ObjectSetText("Countesst"+i, IntegerToString(counterd,1,0), 18, "Arial Black", clrMaroon);
                if (counterd==5) ObjectSetText("Countesst"+i, IntegerToString(counterd,1,0), 18, "Arial Black", clrCrimson);
                  if (counterd==6) ObjectSetText("Countesst"+i, IntegerToString(counterd,1,0), 28, "Arial Black", clrCrimson);


                  }


  //upside counter
 if (counter>2 && counter<7){
               ObjectCreate("Countess"+i,OBJ_TEXT, 0, Time[i], Low[i]-30*Point);
            ObjectSetText("Countess"+i, IntegerToString(counter,1,0), 18, "Arial Black", clrPaleGreen);
            if (counter==5) ObjectSetText("Countess"+i, IntegerToString(counter,1,0), 18, "Arial Black", clrDarkGreen);
            if (counter==5
          //  && High[i]<High[i+1]
            && High[i+2]>iBands(symbol,0,60,2,0,PRICE_MEDIAN,MODE_UPPER,i+2)
            && Close[i]<iBands(symbol,0,60,2,0,PRICE_MEDIAN,MODE_UPPER,i) &&  Close[i+1]<iBands(symbol,0,60,2,0,PRICE_MEDIAN,MODE_UPPER,i+1) && Close[i+2]<iBands(symbol,0,60,2,0,PRICE_MEDIAN,MODE_UPPER,i+2) ) ObjectSetText("Countess"+i, IntegerToString(counter,1,0)+"-Sell", 28, "Arial Black", clrCrimson);
               if (counter==6) {ObjectSetText("Countess"+i, IntegerToString(counter,1,0), 28, "Arial Black", clrDarkGreen);


               }
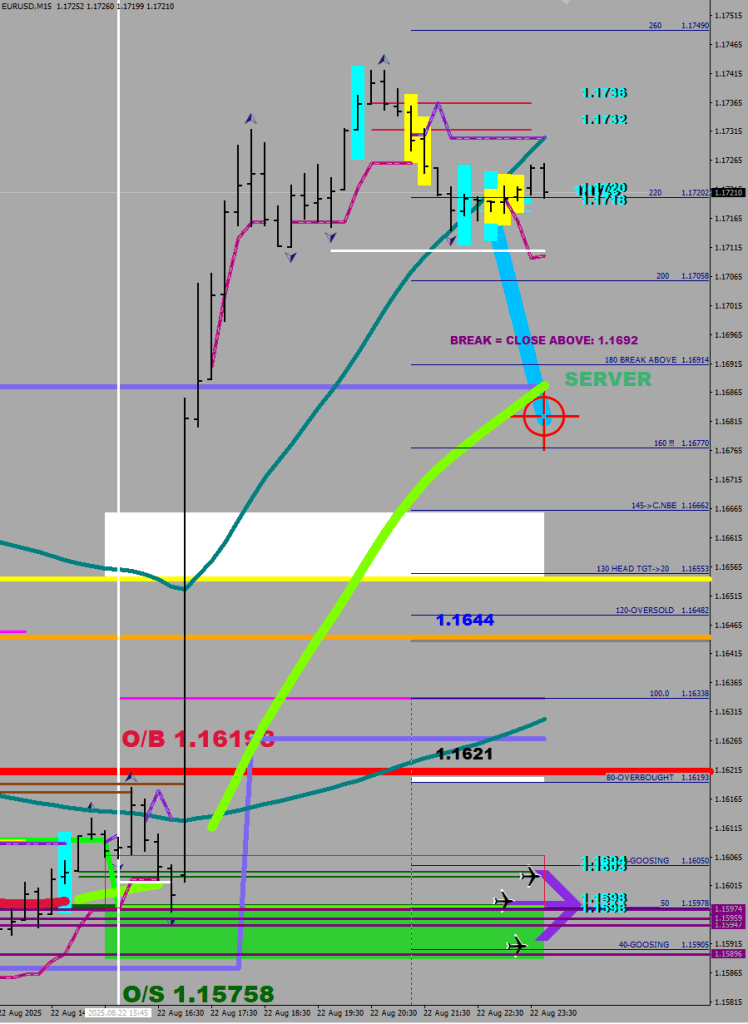
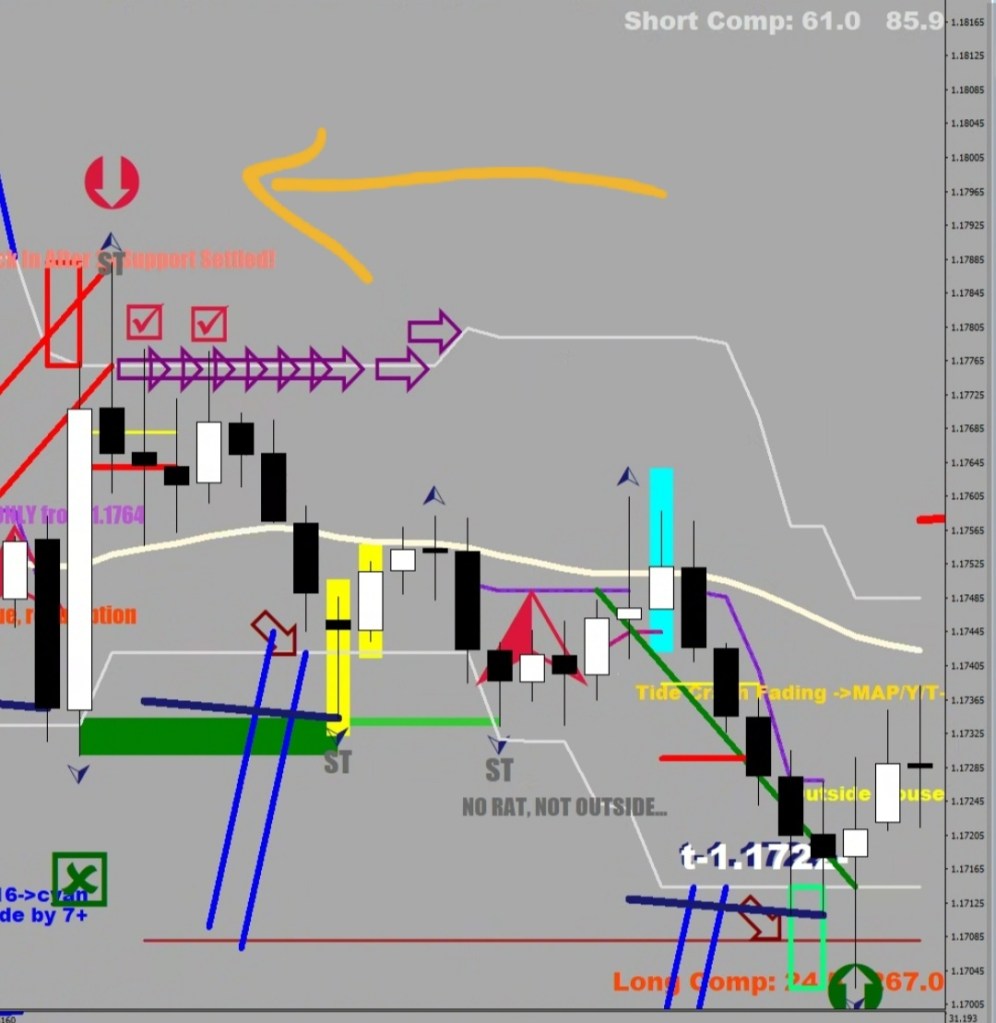
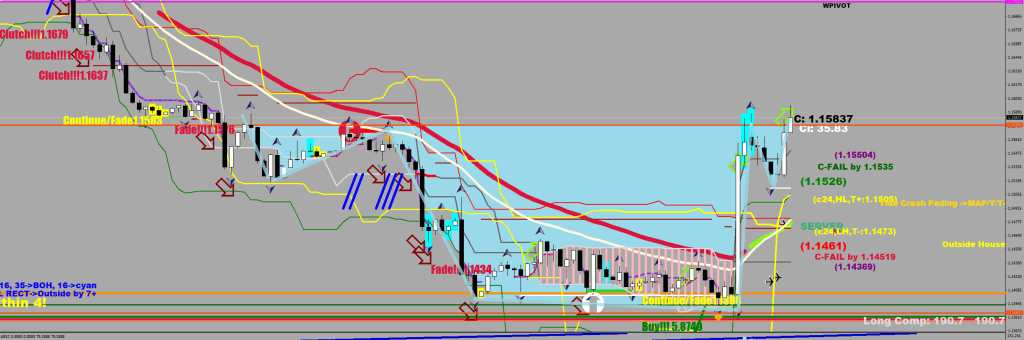
I wanted to talk about how this is light-years ahead of the YouTube scammers.
That they would never figure out that there are only 3 breakout distances, but how would they when nobody knows the location of the breakout levels, aka the edges of the house. Drawing things would not get you any closer. Plotting is a must, as you cannot calculate in your head in real time.
The yellow line, just as the house remains a mystery.
I also wanted to show you how the last breakdown at the edge of the house was 35+ pips, the first breakout on the upside was 55+ pips, and the third one was 16+ pips. All three sizes I have been citing here. I do not know these values for any other instrument.
   ///wick out on the upside mark up
   if (High[i]<High[i+1] && High[i+1]>ExtUpperBuffer_[i+1]+30*Point
   && Open[i+1]<ExtUpperBuffer_[i+1]
   && Open[i+1]>Close[i+1]
    && MathAbs(ExtUpperBuffer_[i+1]-ExtUpperBuffer_[i])<30*Point
    && High[i+1]>High[i+2]-20*Point
    && High[i+1]>High[i]
      )
A $2 top could come in the shape of a Wick out. That’s anywhere from 1.1741 currently, falling shy of the yellow line at 1.1760.
The first thing to say is that you are not smarter than a blue line. I certainly am not.
//buy the house break above 16,35, 55/yellow
     if (ExtUpperBuffer_[i+1]==ExtUpperBuffer_[i+2] && ExtUpperBuffer_[i+1]!=EMPTY_VALUE
      && D32[i+1]>-4.5 && D32[i+1]<20
      && High[i+3]<ExtUpperBuffer_[i+3] && High[i+2]<ExtUpperBuffer_[i+2] && High[i+1]<ExtUpperBuffer_[i+1] && High[i]>High[i+1]
      && Close[i+1]>iMA(symbol,0,32,0,MODE_EMA,PRICE_MEDIAN,i)
      )
       {

//sell the house break lower  16,35, 55/yellow
      if (ExtLowerBuffer_[i+1]==ExtLowerBuffer_[i+2] && ExtLowerBuffer_[i+1]!=EMPTY_VALUE && D32NEG[i+1]<-4.5 && D32NEG[i+1]>-20
      && (D32[i+2]<7 || D32[i+2]==EMPTY_VALUE)
      && Low[i+3]>ExtLowerBuffer_[i+3] && Low[i+2]>ExtLowerBuffer_[i+2] && Low[i+1]>ExtLowerBuffer_[i+1] && Low[i]<Low[i+1])
       {
The second thing is about denominations.
Wasn’t this what they were teaching you at the Online Trading Academy? Why didn’t you come to me first?
I.e. $2 bottom
1+0.5+05=2
A typical reaction is a minimum of 32 pips from the lower denominations. I have no example of a “counter” move beyond 58 pips.
From left to right:
$1 reaction from above, $1 reaction from below, $3 top (2+0.5+0.5), $3 bottom (2+1), $3 top (2+1)
So, currently we have a $2 top followed by a $1 reaction.
I’m thinking another dollar (or 2x 0.5) to be found before back, up.
Shorts
///wick out on the upside mark up
   if (High[i]<High[i+1] && High[i+1]>ExtUpperBuffer_[i+1]+30*Point
   && Open[i+1]<ExtUpperBuffer_[i+1]
   && Open[i+1]>Close[i+1]
    && MathAbs(ExtUpperBuffer_[i+1]-ExtUpperBuffer_[i])<30*Point
    && High[i+1]>High[i+2]-20*Point
    && High[i+1]>High[i]
      )

///wick out on the downside mark up
   if (Low[i+1]<ExtLowerBuffer_[i+1]-30*Point
   && Open[i+1]>ExtLowerBuffer_[i+1]
   && Open[i+1]<Close[i+1]
    && MathAbs(ExtLowerBuffer_[i+1]-ExtLowerBuffer_[i])<30*Point
    && Low[i+1]<Low[i+2]+20*Point
    && Low[i]>Low[i+1]
      )

///failed break out on the upside mark up
   if (i>0 && High[i-1]<High[i] && High[i+2]>ExtUpperBuffer_[i+2]
   && High[i+1]>ExtUpperBuffer_[i+1]+20*Point
   && High[i+1]<ExtUpperBuffer_[i+1]+150*Point
   && High[i]<ExtUpperBuffer_[i]
      )

///failed break out on the downside mark up
   if (Low[i+2]<ExtLowerBuffer_[i+2]
   && Low[i+1]>ExtLowerBuffer_[i+1]-150*Point
   && Low[i+1]<ExtLowerBuffer_[i+1]-20*Point
   && Low[i]>ExtLowerBuffer_[i]
      )

///near miss on the upside mark up
   if (High[i+1]>ExtUpperBuffer_[i+1]-30*Point
   && High[i+1]<ExtUpperBuffer_[i+1]+25*Point
   && Close[i+1]<ExtUpperBuffer_[i+1]
   && High[i+1]-Low[i+1]>150*Point
  // && High[i+1]>High[i+2]
   && High[i+1]>High[i]
   && ExtUpperBuffer_[i+1]>=ExtUpperBuffer_[i+2]
      )

   ///near miss on the downside mark up
   if (Low[i+1]<ExtLowerBuffer_[i+1]+30*Point
   && Low[i+1]>ExtLowerBuffer_[i+1]-20*Point
   && Close[i+1]>ExtLowerBuffer_[i+1]
   && High[i+1]-Low[i+1]>150*Point
   && Low[i+1]<Low[i+2]
   && Low[i+1]<Low[i]
   && ExtLowerBuffer_[i+1]<=ExtLowerBuffer_[i+2]+20*Point
      )
For hype monitoring/control, a 30-minute chart with an RSI2, a 30-sample Bollinger, and an 8-sample EMO is ideal. You are not improving on anything by a lower timeframe.
The hype is on after 6 consecutive closes outside the BB.
The hype should find support at the 8 EMO upon pullback.
If the RSI2 does not cross the 50 line, that’s not a pullback; call it a dip.
A correction has multiple legs and can be skewed. Meaning the second fractal merely approaches (typically within 4 pips) the fractal printed by the Measuring Leg.
The 30-sample BB, when attacked from the inside, can prompt a stall / prompt a correction; it would require new money to close outside.
The hype ends with a correction, and is followed by a squirt.
One close above the BB, one below (one re-capture attempt) & it’s over.
First stop: S-30 – E-44 reset on the hourly.
Album # 81
Silento parody (next level silly), Mercury opera-sings, new French one, rap, disco, alternative. Oh, and Say Goodbye To The Bad Rhymes.
I find the drum-use rather creative in this one:
I am a signals guy, always have been.
I just need to get around to puttung the relation marks right. The best performer currently:
You would think I’m cherry-picking, but not. Repaint? Sure, the first hour is needed for the paint to dry
Does this look overoptimized to you?
   ///wick out on the upside mark up
   if (High[i]<High[i+1] && High[i+1]>ExtUpperBuffer_[i+1]+30*Point
   && Open[i+1]<ExtUpperBuffer_[i+1]
   && Open[i+1]>Close[i+1]
    && MathAbs(ExtUpperBuffer_[i+1]-ExtUpperBuffer_[i])<30*Point
    && High[i+1]>High[i+2]-20*Point
      )
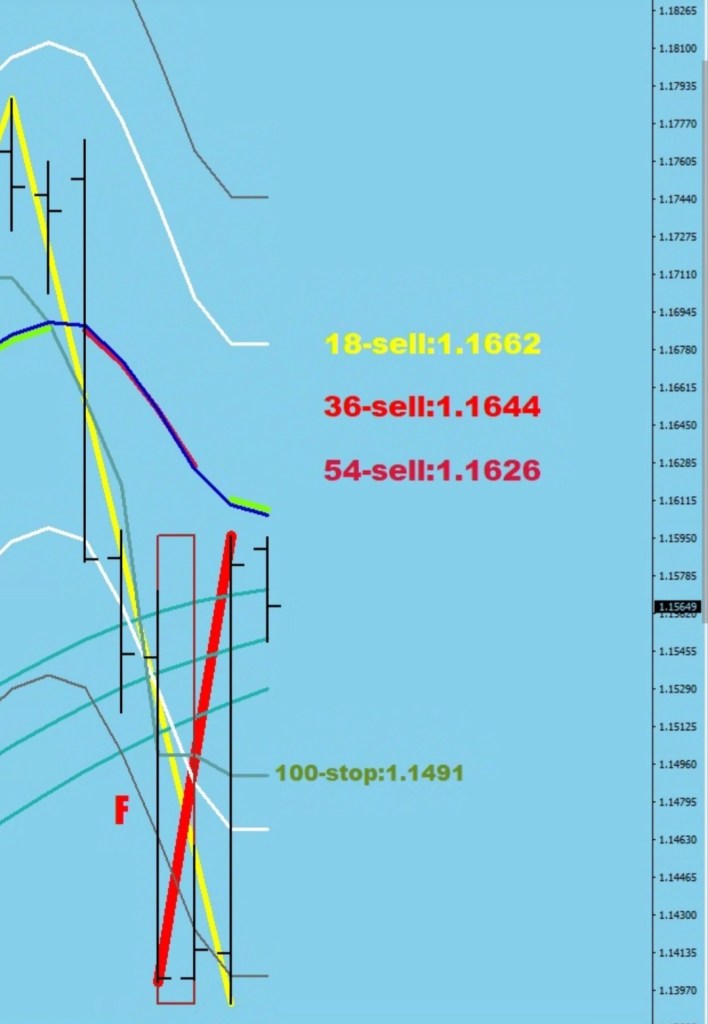
I looked back some history, and could not find a one day 200+ pips candle coming off of a lower low (not even from beyond 4.5x stretch). The 16-EMA still has not been reached.
However, I think the diagonal red plot is right for using the low as a starting point from 2 days earlier. There could be a higher high in the coming days, but typically not more than 15 pips extra.
Now with the full consolidation the Pendulum’s origo was reset near the previous high leaving room for an extension-move.
I’m showing an open top print (purple diagonal), and the M.O. is 3 more attempts to go higher and two marginal higher highs in total.
In terms of a possible time out: to show any intent, you would need to see a 3-4 pips beat within 37 hours. If no higher was made by hour 53, go short with size.
After that, there would be a move to the 100-pip stop (2nd image) which would be pulled higher by the number of pips they would manage to tag on.
I do not get the sudden rate-cut argument at all in this relative game; first of all it has not happened yer, and if it does, do you think Europe and the rest of the wotld would not be participating in the race to the bottom? BOE is taking charge already.
Check out Freddy Mercury singing my song, A Jolt Of Fire – coming out soon with album #81.
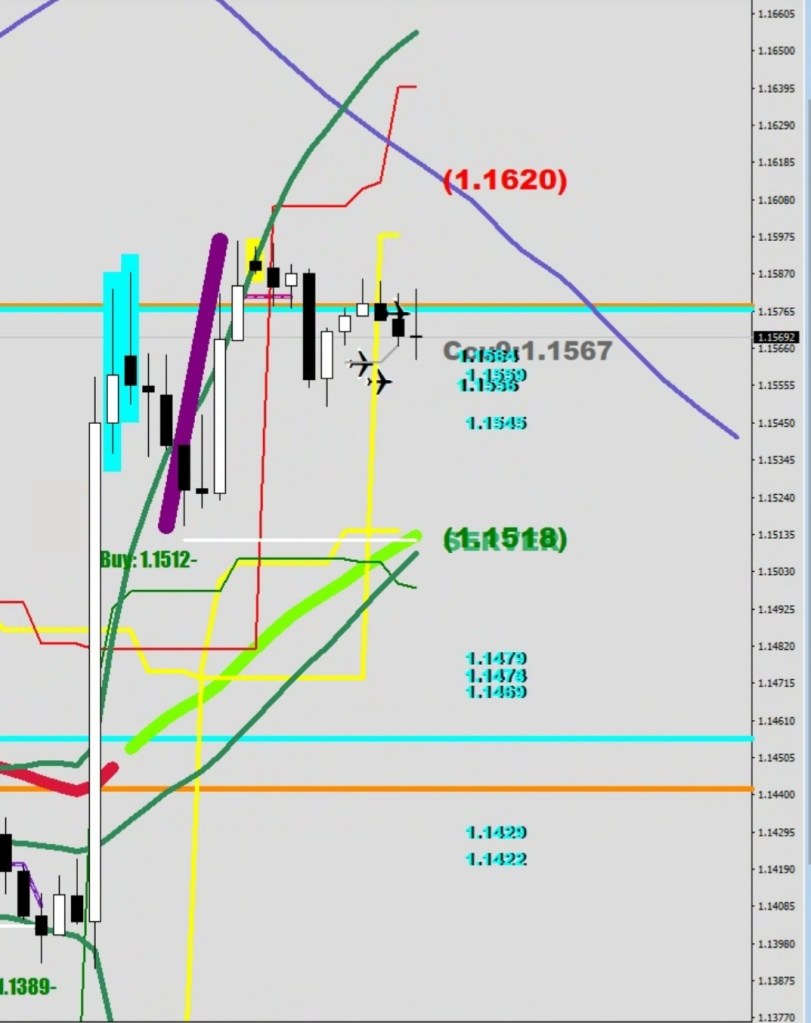
There was an Iceberg order (yellow arrows) where they accumulated Euro in a big way. See the blue line? My only trendline plot on the entire chart, hinting a backtest from below (kiss-goodbye?)
The embedded oversold stochastic unraveled & went to the other extreme.
The price landed in the moat, just behind the E-9.
The mean reversion projections were just about perfect.
…although this mean reversion took 1.5 hours versus a 2-day statistical average. By the way, from the 6x fluctuation maximum peak, it took 41 hours to return.
This looks like an inverse head & shoulders.
Of course, you could have a deeper right shoulder or at least a double. The cyan-shaded two hourly candles are professionals’ profit-taking on the first leg up.
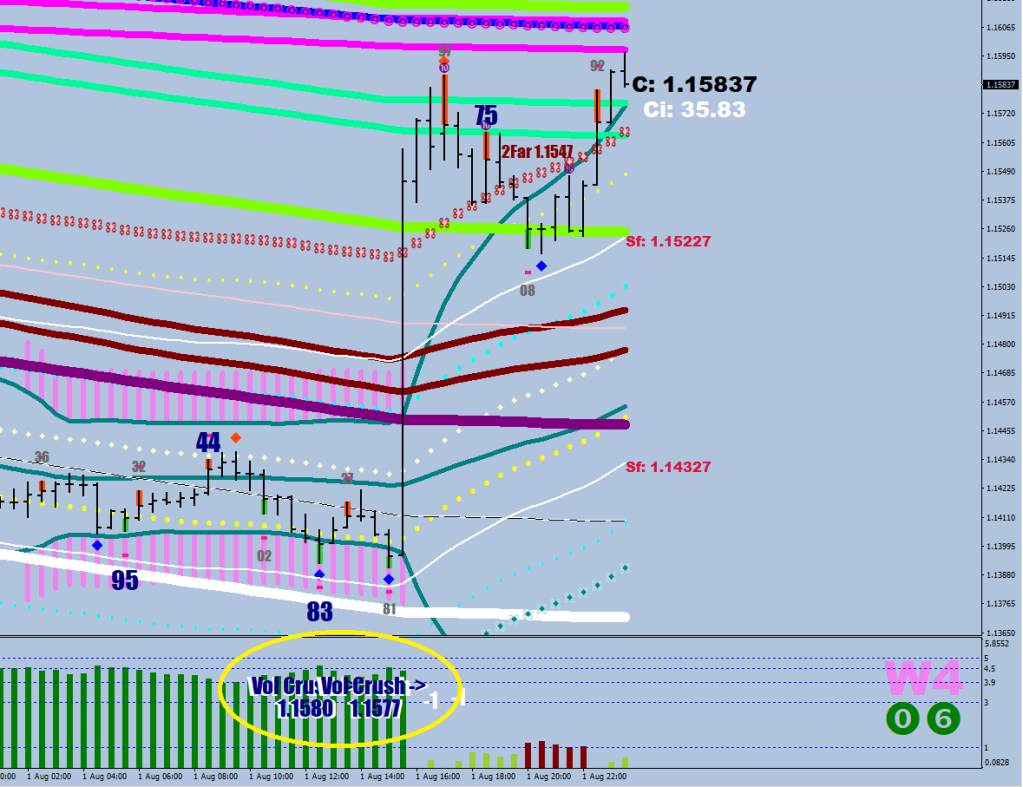
There’s also the end of the pendulum at “300”.
Normally, you would get a swing back from here (to the other end). I certainly don’t think that a gap up is a possibility here, but a gap down would help recharge the energy faster.
This large daily candle was also a recharge move for the daily energy.
The upper reversal zone starts at 1.1581 – how interesting is that?!
The daily stochastic would be out of the oversold, which could attract fresh shorts.
I certainly don’t like the speed of the move up, but I leave you with some claws.
Whatever low we get on Monday, if that holds for the next 3 days, the move could continue (see 2 C) or if the 2.2x fluctuation maximum line (white F + green diagonal example) remains untouched after 3 daily lows (inside days don’t count), you’ll get another leg up.
Liquidity breaks are typically counterproductive.
Check the difference between the starting points below:
The first one was above the EMA band. The second one, after a maximum effort, just managed to put is head above the waterline. Not my idea of a start of a healthy new leg up. From below the weekly S3 (1.1414)
I have another trendline for you on the weekly. Another kiss-goodbye look. Probably a major gap down would be my thinking based on this one. Not looking constructive at the slightest.