Trading 4ensics (Pocket Science)

This would be about my flaws of thinking and actions on Friday. Promisory note: a lot to learn from this one.

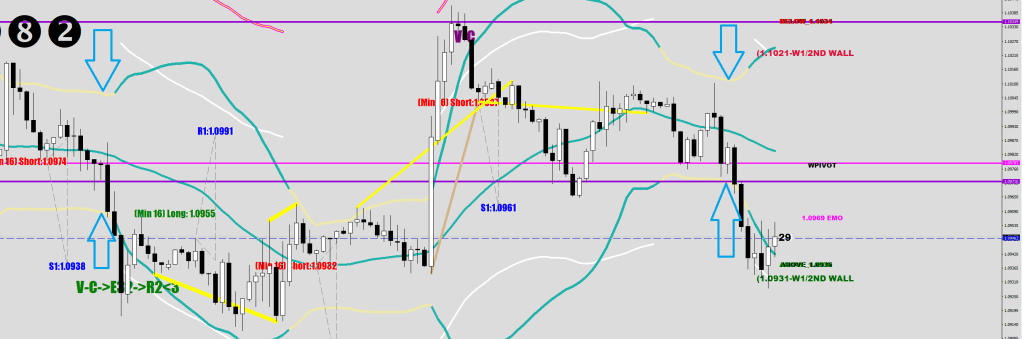
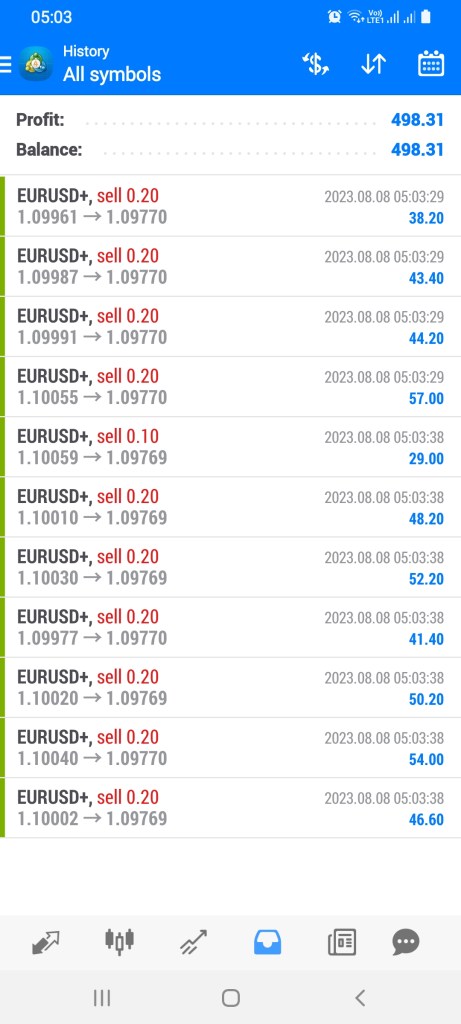
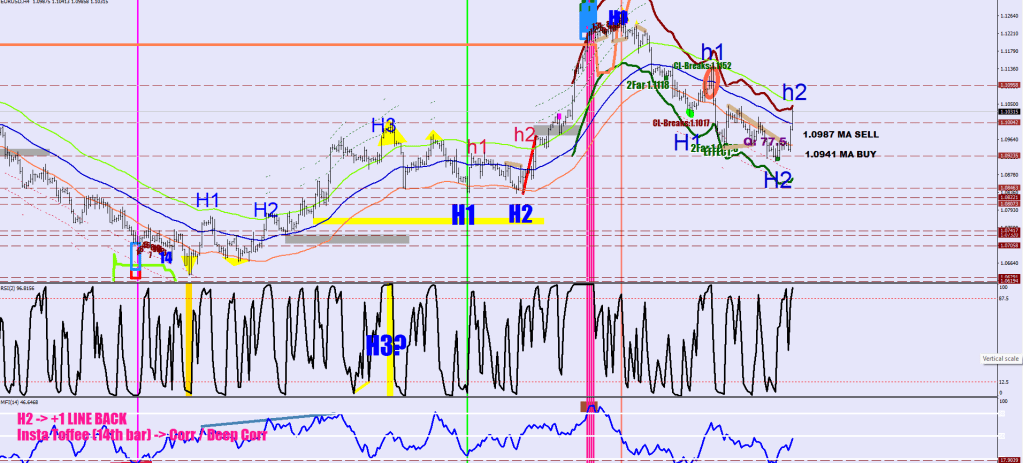
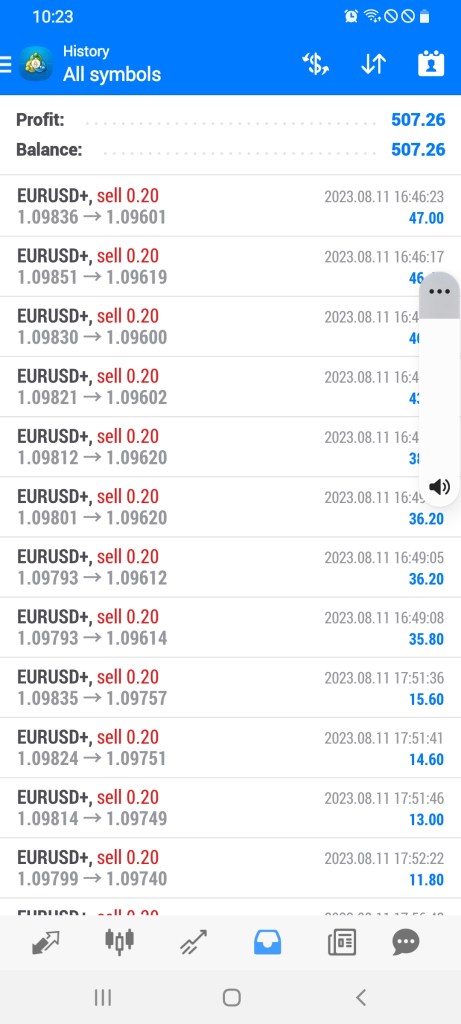
One of my biggest mistakes is getting out of the positions too early. When there is a lot of back and forth before getting a move going, it is possible to make good money this way, however, just as the example of Friday shows, when I ended up closing out 35 different orders, if I only held into near the close, I could had made $1-200 more by closing out the 8 positions I already had at the open.

Coming ito the habit of repeating the same steps mindlessly, without re-elaluating the situation is never the best policy.

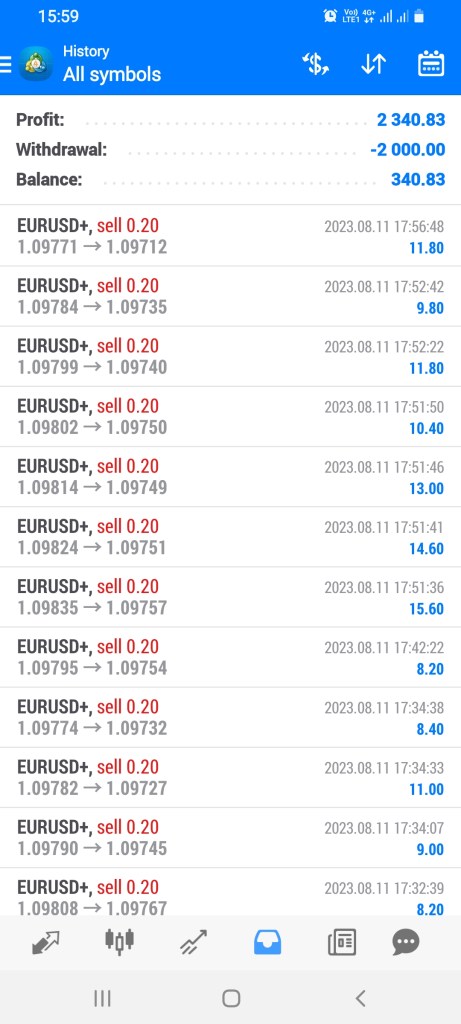
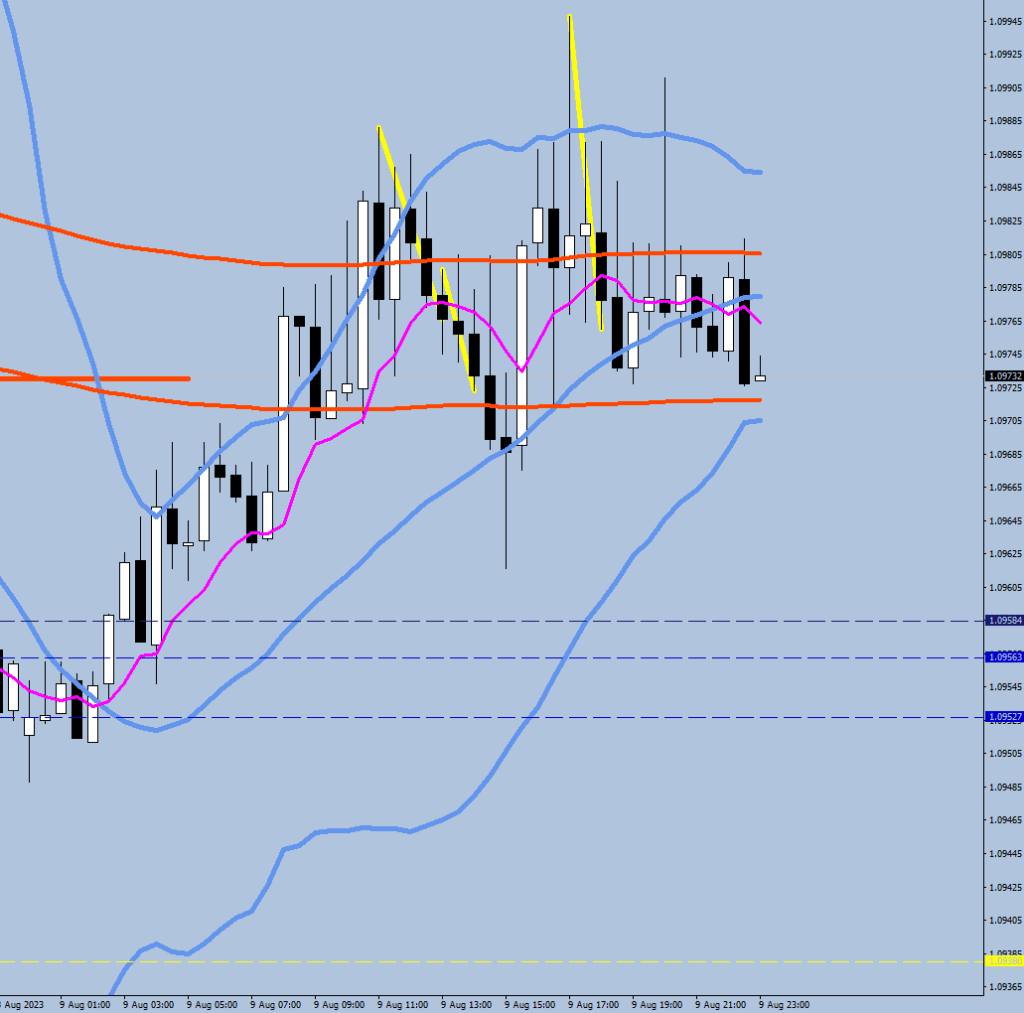
I got out of the initial 8 holdings (1.6 lots) at very near the low of the first swing.

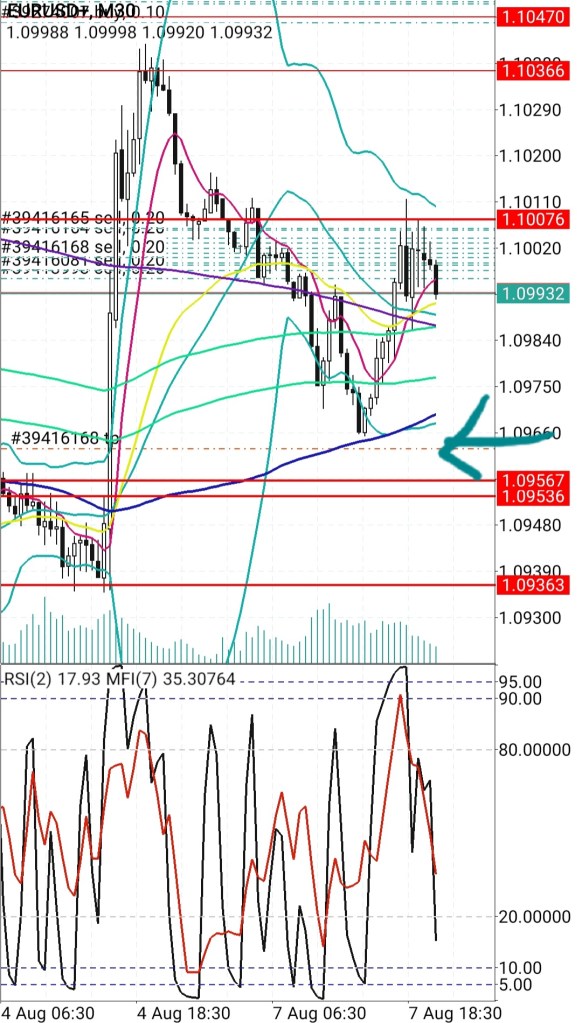
These orders were auto targeted to the 60-min 30 sample BB @ 1.0958 at the given hour, but I just could not wait it out & closed them a few pips shy. The 6.3 stop loss is the code that adjusts the target real time if my EA is running.
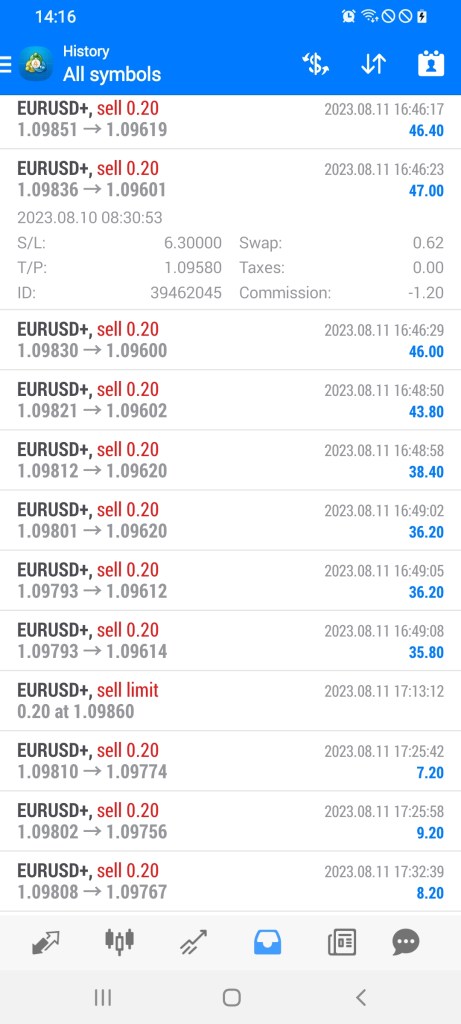
I knew there would be another one coming from at / just beyond the 8 EMO & so I scaled back in.

Here you can see freshly opened shorts, as high as 1.09835.
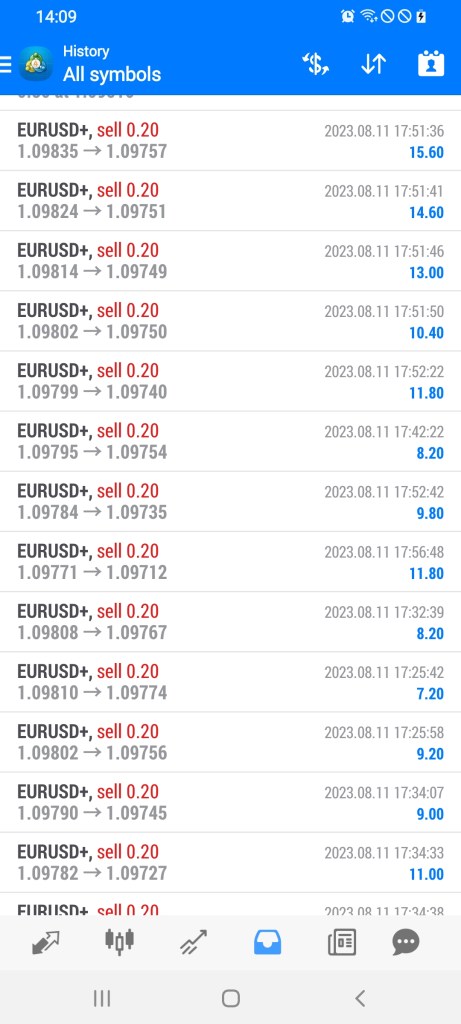
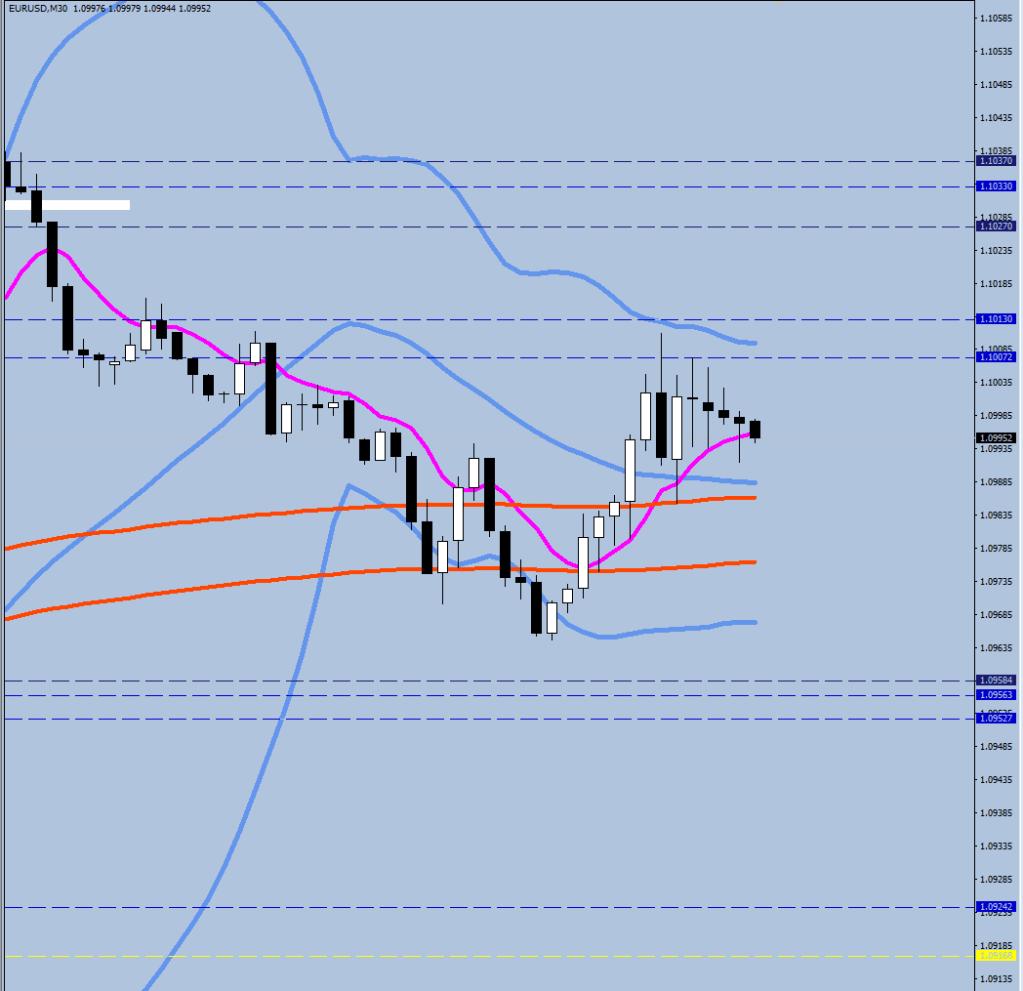
I got all the fills, but then I deviated on two points. One is that for some reason I started leaning towards having to see a 30-minute close beyond the 8 EMO (which ultimately isn’t a must) disregarding that a 2-pip move beyond is satisfactory for the swing high-staring point and two: I was going to hold at least 1/2 for the second move down, but whenever I saw some profits, I kept on closing out to get the stats up and make the $500 daily which left me with no holdings for the transpired.

I also engaged in some boredom scraps doing some roll ins and outs, which can also deviate the mind from concentrating on the master plan, and trigger that closing out loop – cycle.

The last thing was the sizing. I was fully hedged coming in, but since I knew the likely course of the events, I should had increased the short holdings by 2. At times I had 0.3 lots extra in shorts, but until the 2nd cancellation would get printed, shorts would have to be equal or more than the longs.

I have yet to come up with a name for the swing point at the end of the first cancellation and start making projections based on the known statistics. 29, 36, 45 pips are recurring numbers with an occassional outlier of 58.

Cover some at 29, more at 36 and hold back a bit for possibly a bit more.

Counter directional volatility is present, but the virgin level(s) have not been hit yet. Could see a small gap down / first move down to cancel these levels.

It would had made sense not to sell anything at all on Friday, but opening at the close of the day would had been closer to a dice roll: for intance a 10-pip move lower from here with a 20-pip increased spread around the open may never come into money.

All in all I made purely unnecessary steps on Friday and in exchange for good looking stats on paper, I left my flank open by holding 1.6 lots more longs than shorts at the end.

Rolling in and out was not an entirely bad idea, with the second set of holdings into the close I could had made an extra $600 even without increasing the size – an extra $500 gain of rope (equity) was not collected on; actually that gain was my teporarily.

On the plus side I got myself to look back the projection stats for spike 2, which is a very useful thing to be aware of for future trading. Marking up and keeping count of cancellations is a habit to make. Marking up virgin levels is essential.
Achilles Dent poems based on title relevance. He’s me in civil.

The guy on the image is actually Lawrence Fishbourne.

This virgin level was cancelled.

Some more nostalgia from the good old autotrading days.
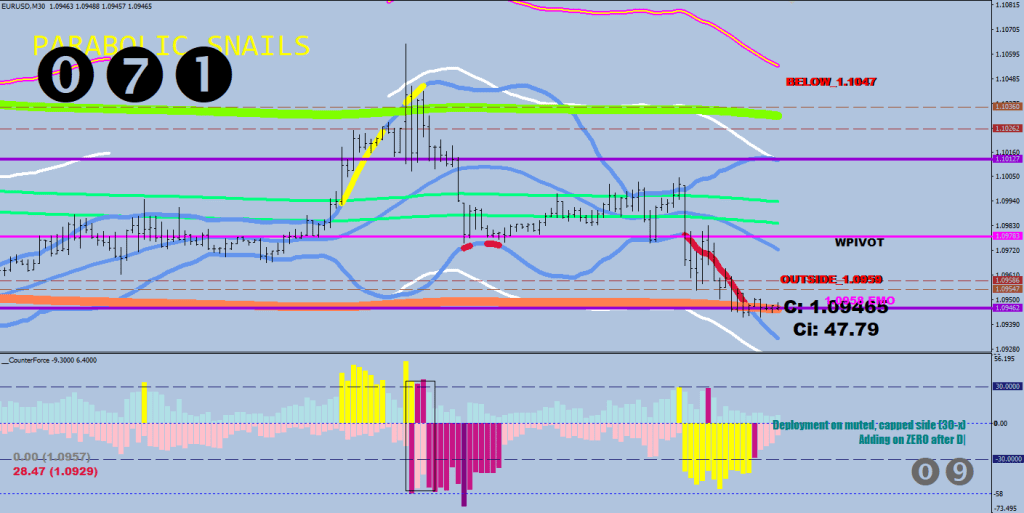
Need two plums on the upper half for a reversal.

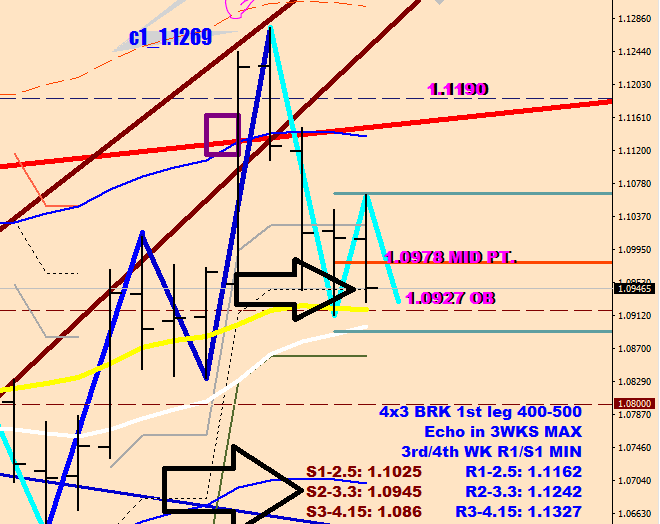
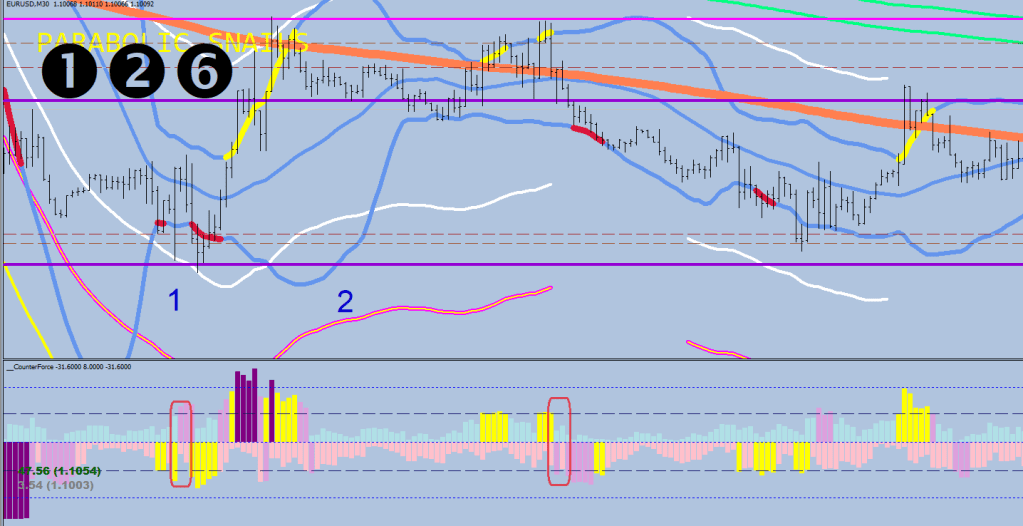
Tough As Snails

The call to make here, is about as difficult as it gets.

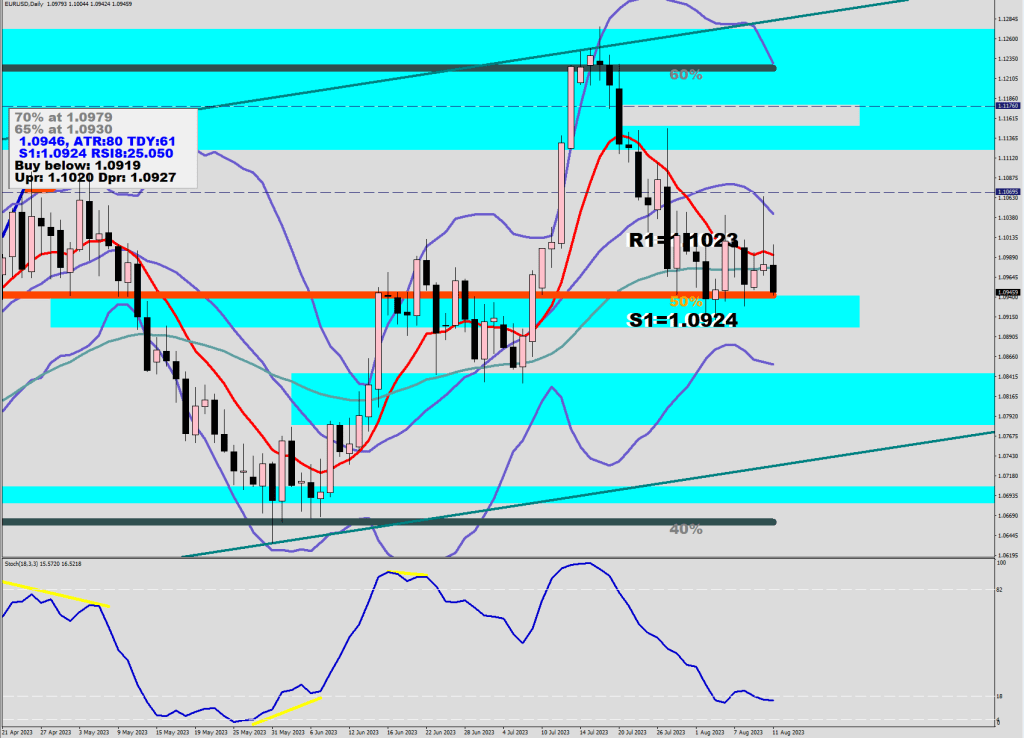
The orange line is the 50% mark of 1100 days’ worth of data.

You are approaching it from above, it should be support. The same time you are testing it for the 3rd time.

This sell off from the Upper Guard Rail to the Lower. No momentum behind it.

It took 2 days to get up, and 2 days to get back down. Not very convincing.

We are going for the yellow virgin level below (perhaps for both), but what if we made it there, what would be the incentive to keep on going?

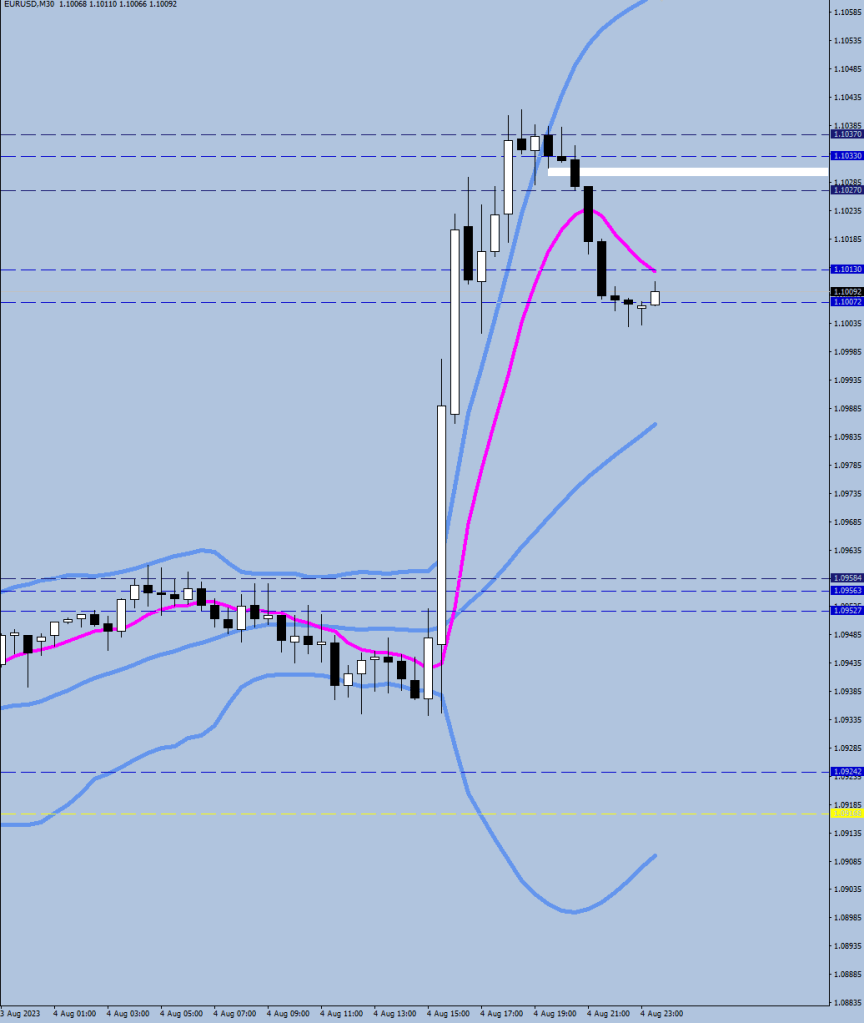
Once price gets back beyond the 8EMO (magenta) the 2nd cancellation will have been made.

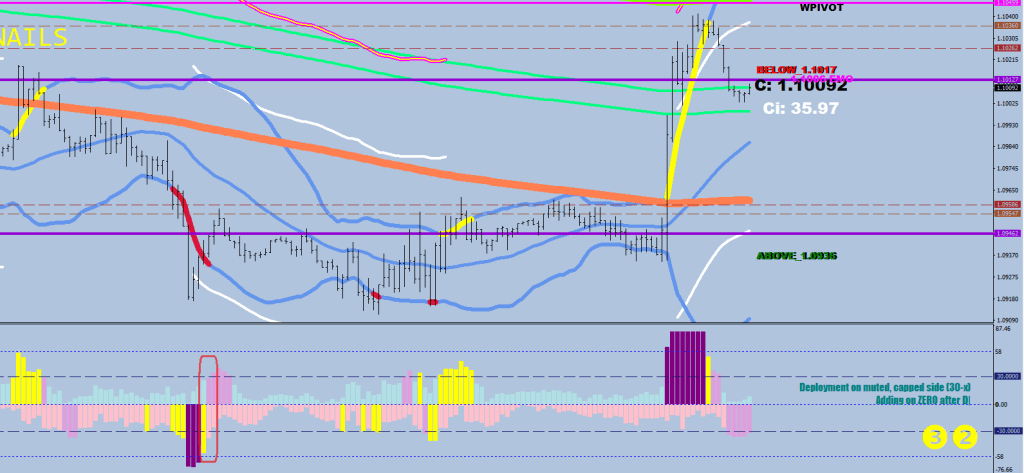
19 days of selling = ridiculously oversold. What would some actual buying do to this picture.

Look at the 5 waves down on the left in white. Was about 20 days. We could be printing a C leg and it would not have to make a lower low either.

Imagine running the stops above the latter Cover High. What would stop price, where would be a collective effort concentrated to kill the rally?

All the moving averages converge here, but going back above 1.1030 would put price back above the 20, the 50, the 9. A lot of bang for a little buck.

Another ABC up?

CPI Hey

Frankly, this is starting to look like a disaster for the Euro, particularly if the close would be below the E9.

Two cover highs, stochastic embedding to the downside.

The run up was impressive out of the squeeze, but the 3 cancellations are already in place.

I had a nothing day, market kept on turning before my stops / targets. Need to remember to be humble, and balance out over big news before the 2nd cancellation prints.

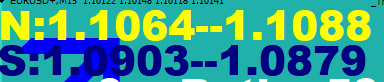
These were the ATR projections.

1.10642 was the high.

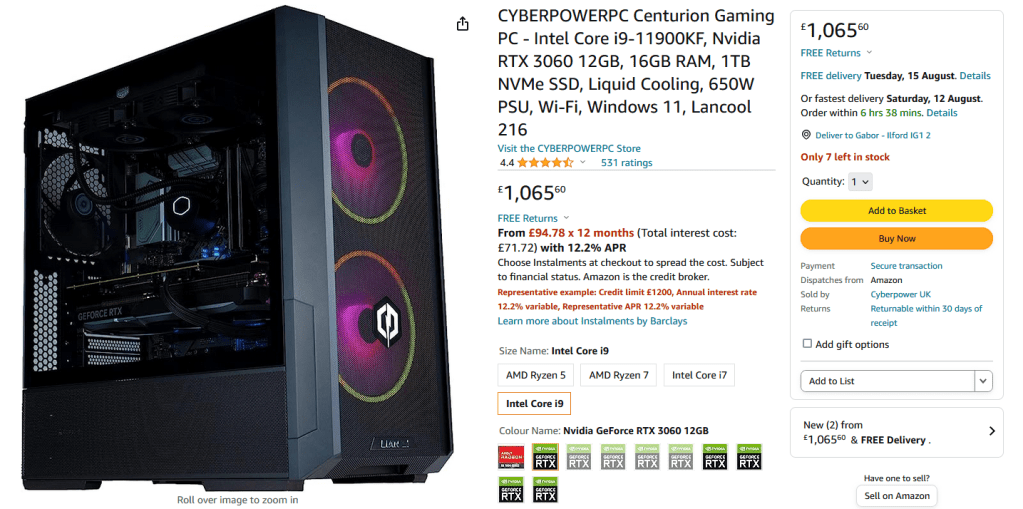
Buying an I9. Not that I deserve it after this pitiful performance.

The weekly if curious:

Chancellor

Today we’ll be talking about noise cancelling headsets, headset cancelling noises, dinner reservations or something along these lines.

Free Parabolic Snails certificate at the end of this course!

The 3 little figs (Pilifino influence)

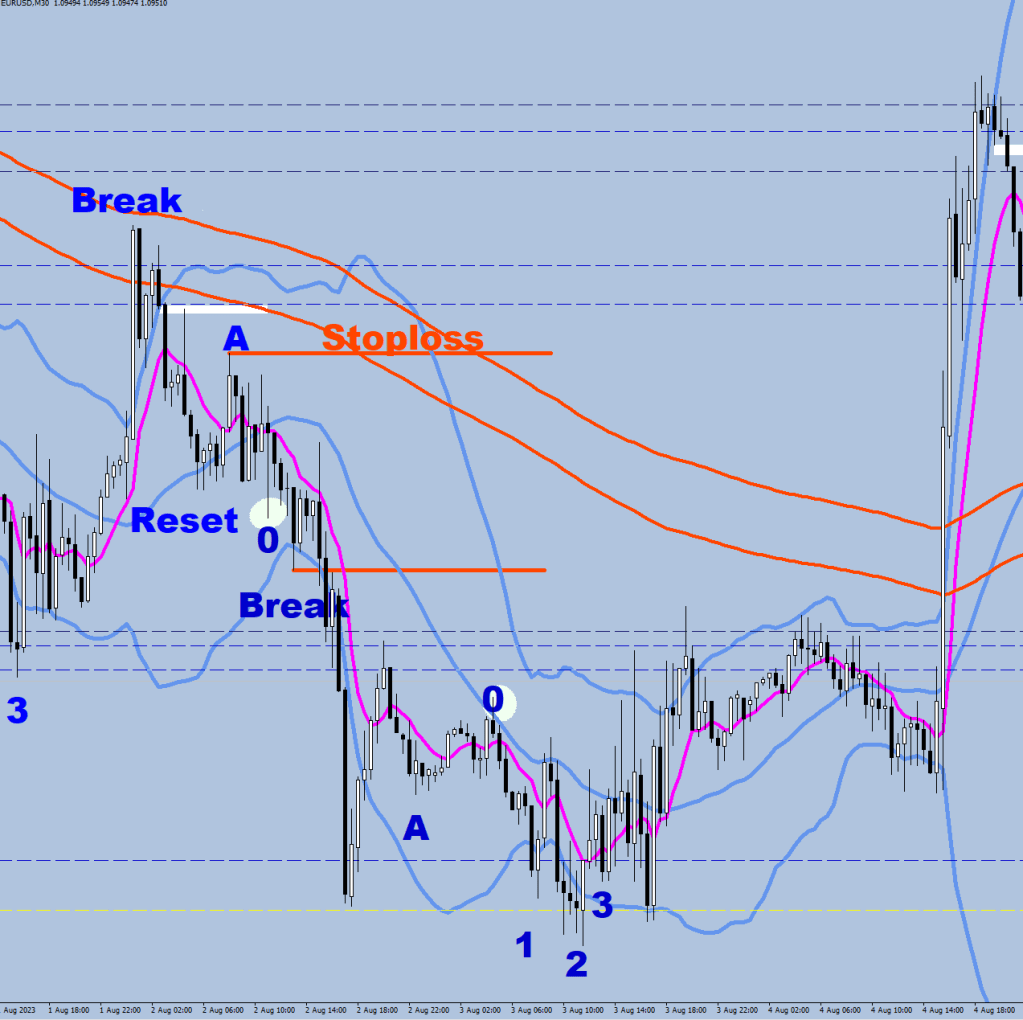
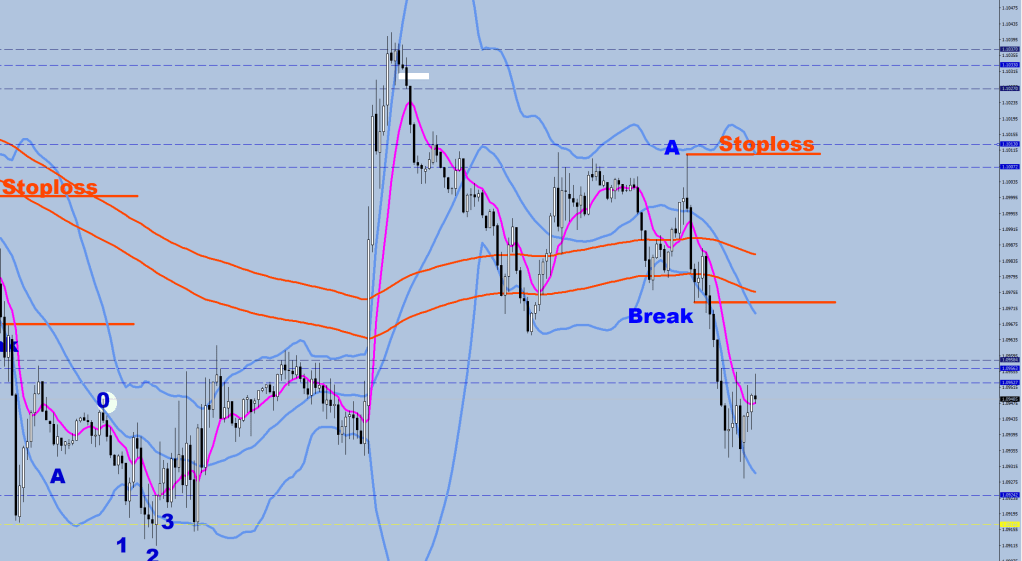
Cancel 1 close back inside the 8 EMO (or at least 2 pips inside to show for)

Cancel 2 close back inside the 8 EMO (or at least 2 pips inside to show for)

Cancel 3 (confirmation of reversal) is 3 30-min closes back inside the 8 EMO

Then, price returns to the Trend (T1 = S30)

…may return to the Brand (T2 = other end of the 30-sample 30-minute HL2 BB)

…and may even become your Friend.

There should be a joke inserted here about Stoke On Trent, Brand On Lee etc but I can’t think of one right now.

What do I think of today’s inflow of $546 versus yesterday’s $573?

In trading your days will be uneven & numbered.

Also, $500 a day keeps Luke Belmar & Kellyohgee away.

Below you can see that I was scaled out of 1.7 lots at / around the S30 from the closer orders, and the auto trail stop locked in 3 pips for the remaining positions. As soon as the first of the 5 stops was hit, I closed out the rest manually.

I have the inkling that the second interrupted yellow level from the bottom may end up devirginated for a farewell.

For the first time in history I’m training men.
Not sure what the holdup is, this looks like a wholesome swing high with 3 yellow lines.

Hijacking #2

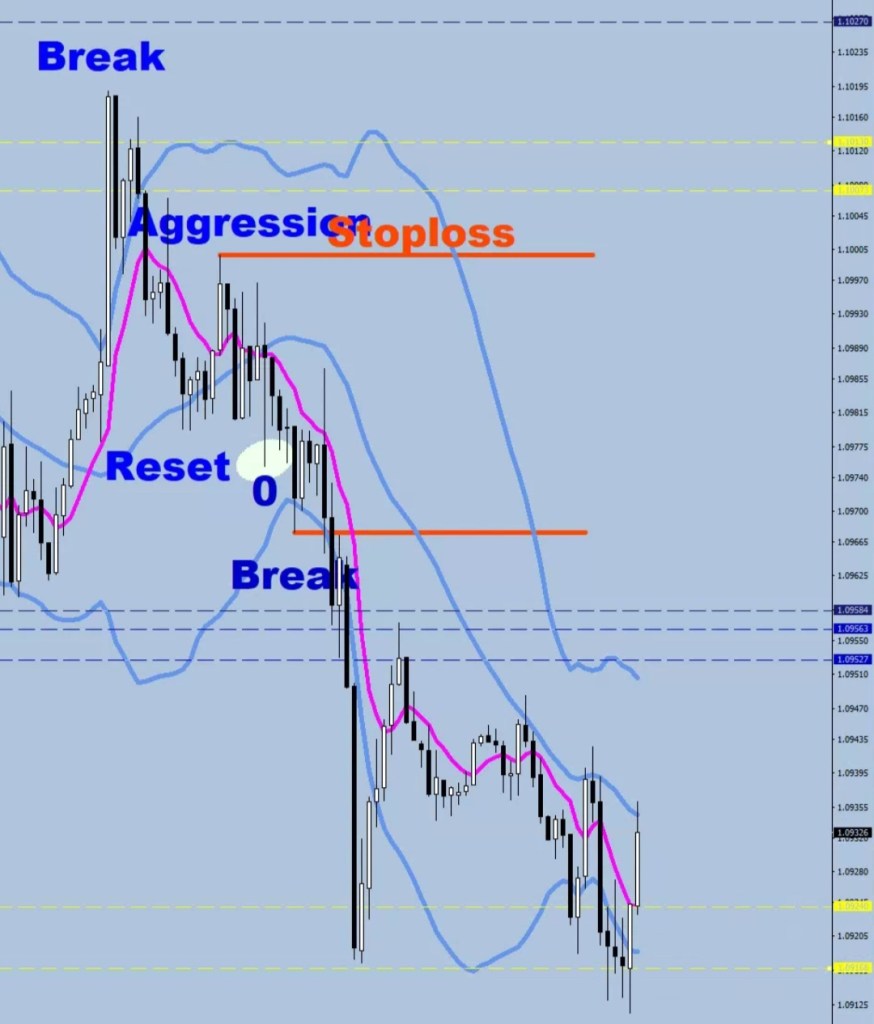
Where there is Aggression, there is danger of hijacking.

Violence breeds violence.

This was the second example of hijacking in recent times.

The BB setting is crucial for spotting Aggression and to know where the market gets tripped and pushed onto the conveyor den.

The previous Malaysian Airlines flight managed 50 pips after the trip, then on two later visits managed to add a handful more.

If the low was made this way, don’t be surprised if the higher low follows in its steps

This hijacking managed about 45 pips against the flight schedule.

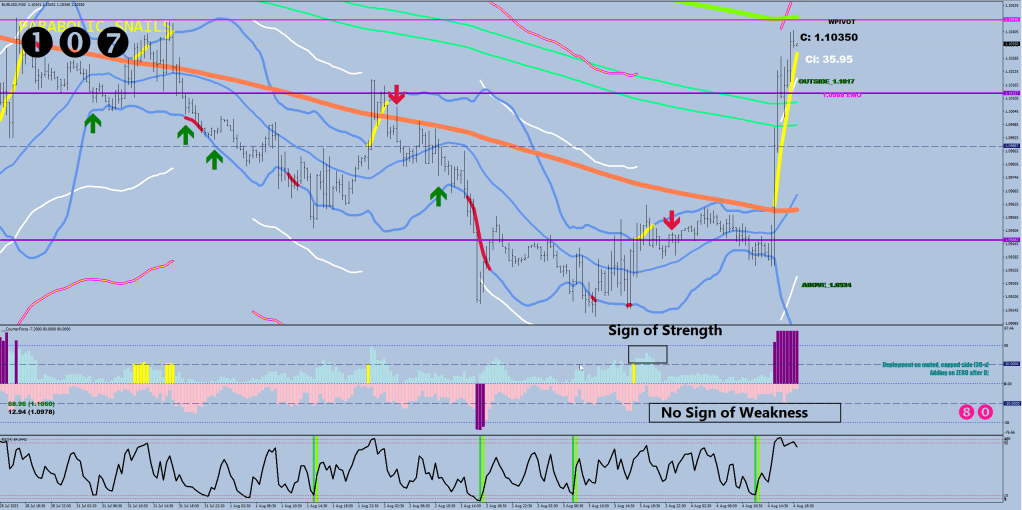
Both of these missteps were kicked off during a squeeze (BB30 1h span < 58 pips).

Arrows to highlight squeezes.

Are You Pimping?

Ay Kingpin, are you kidding?

You need to re-born and re-porn. Are you with me so far?

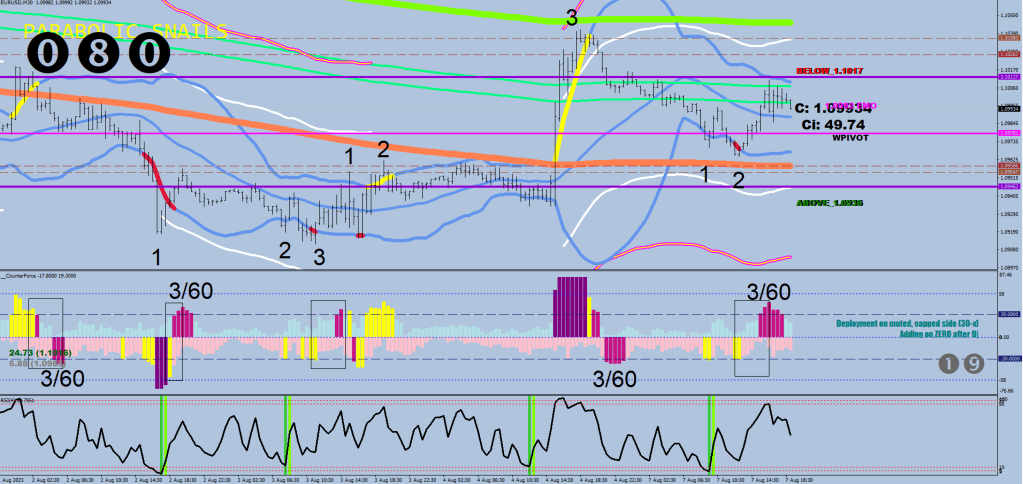
The lost 3 amigos after midnight let you do a 3/60.

3 means 3 Bollinger breaches or a 60+ pips stretch reaching outside the BB, whoever comes first.

Lost in interpretation is what means what. The signals are there, now you need to find the correlating outcome.

Am I suggesting that the market may be headed in two different directions at the same time?

Everything I said in the Subordinate Clause entry still stands, but there’s more you can read out of the plum triplets.

The “direction is now up” and “bears get to print one more spike outside the lower Bollinger” are not mutually exclusive.

This is why I was in a rush to deploy 2 lots to the downside soon after there was a clarification of the direction now being up.

Did this all sound alien to you? Are you Ripley?

Bull flag, eh?

Yea, not 6.5 / 20 million I know, but I am not a YouTuber in their twenties, merely a trader with 14 years of experience with self made auto targeting tools and indicators.

& next you should see 3 spikes outside the upper BB.

Subordinate Clause

Gonna lose you with the colors again, but here we go.

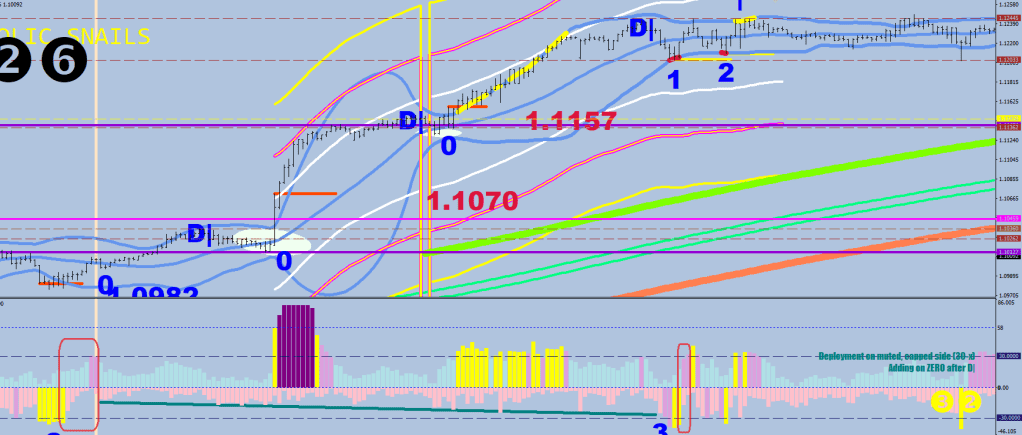
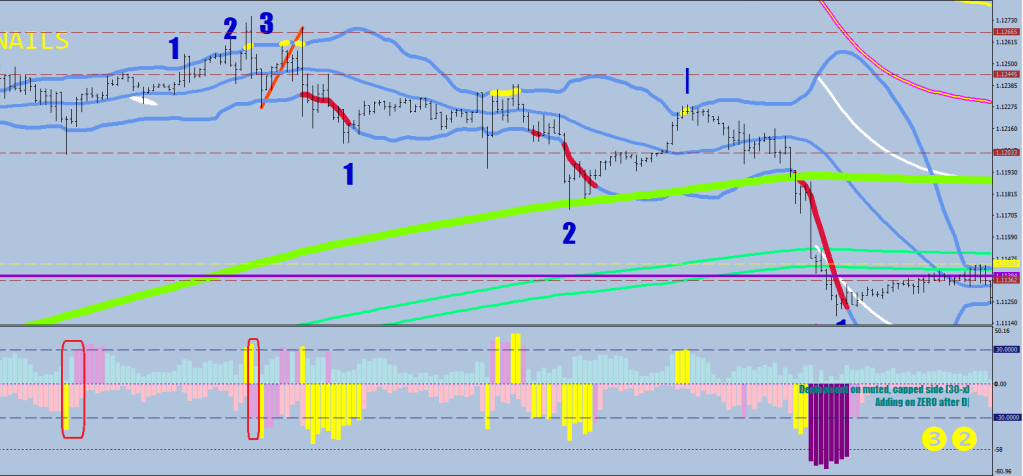
A yellow on one side followed by 2 plums on the other is a direction picked.

Missing tooth in the middle.

What is missing here? A yellow print on the upside followed by 2 plums down.

The plum basically a move that consolidates before breaching volatility. The oppressed or subordinate side is the dusk before the dawn.


ExtATRBuffer[i]= -1*(iHigh(symbol,0,iHighest(symbol,0,MODE_HIGH,sample-1,i+1))-Low[i])*10000;
 if (ExtATRBuffer[i]<-80) ExtATRBuffer[i]=-80;
else if (ExtATRBuffer[i]<-28 && ExtATRBuffer[i]>-58 
&& Low[i]<iBands(symbol,0,30,2,0,PRICE_MEDIAN,MODE_LOWER,i)) ExtATRBuffer6[i]=ExtATRBuffer[i];
else if (ExtATRBuffer[i]<-28 && ExtATRBuffer[i]>-58 
&& Low[i]>iBands(symbol,0,30,2,0,PRICE_MEDIAN,MODE_LOWER,i)) ExtATRBuffer7[i]=ExtATRBuffer[i];

 ExtATRBuffer2[i]=(High[i]-iLow(symbol,0,iLowest(symbol,0,MODE_LOW,sample-1,i+1)))*10000;
 if (ExtATRBuffer2[i]>80) ExtATRBuffer2[i]=80;
 else if (ExtATRBuffer2[i]>28 && ExtATRBuffer2[i]<58 
 && High[i]>iBands(symbol,0,30,2,0,PRICE_MEDIAN,MODE_UPPER,i) ) ExtATRBuffer6[i]=ExtATRBuffer2[i];
 if (ExtATRBuffer[i]<-58) ExtATRBuffer3[i]=ExtATRBuffer[i];
else if (ExtATRBuffer2[i]>28 && ExtATRBuffer2[i]<58 
  && High[i]<iBands(symbol,0,30,2,0,PRICE_MEDIAN,MODE_UPPER,i) ) ExtATRBuffer7[i]=ExtATRBuffer2[i];
 if (ExtATRBuffer[i]<-58) ExtATRBuffer3[i]=ExtATRBuffer[i];
 else if (ExtATRBuffer2[i]>58) ExtATRBuffer3[i]=ExtATRBuffer2[i]; 

   SetIndexBuffer(0,ExtATRBuffer);   
   SetIndexStyle(0,DRAW_HISTOGRAM,STYLE_SOLID,4,indicator_color1);
   SetIndexBuffer(1,ExtATRBuffer2);   
   SetIndexStyle(1,DRAW_HISTOGRAM,STYLE_SOLID,4,indicator_color2);
     SetIndexBuffer(2,ExtATRBuffer3);   
   SetIndexStyle(2,DRAW_HISTOGRAM,STYLE_SOLID,4,indicator_color3); 
        SetIndexBuffer(3,ExtATRBuffer4);   
   SetIndexStyle(3,DRAW_HISTOGRAM,STYLE_SOLID,4,indicator_color4); 
   SetIndexBuffer(4,ExtATRBuffer5);   
   SetIndexStyle(4,DRAW_HISTOGRAM,STYLE_SOLID,4,indicator_color5);
      SetIndexBuffer(5,ExtATRBuffer6);   
   SetIndexStyle(5,DRAW_HISTOGRAM,STYLE_SOLID,4,indicator_color6);
      SetIndexBuffer(6,ExtATRBuffer7);   
   SetIndexStyle(6,DRAW_HISTOGRAM,STYLE_SOLID,4,indicator_color7);
#property indicator_color1  clrPink
#property indicator_color2  clrPowderBlue
#property indicator_color3  clrPurple
#property indicator_color4  clrGreen
#property indicator_color5  clrRed
#property indicator_color6  clrYellow
#property indicator_color7  clrPlum

So this was about posting clips again?

The Key

The key to aggression is counter directional volatility.

The key to target projection is counter directional volatility.

While the market does not display the ability to move agaist the trend, it remains in a permanent limbo.

I thought the criteria for an Aggressive entry was settling back to the 30-min S30 first, and although the A would end up printing on the other side of this MA, the actual show card is 30+ pips of move first in the wannabe aggression.

Similarly, MFI beat projections are requiring a conter move in excess of 58 pips to be taken seriously.

So the first fight to engage in is for claiming enough volatility.

I do not know if I have picked the right metric, but I like the 4-hour sample 30 minute chart combo.

This is what I’ve been trying to tell you all my life: news does not change positioning.

COT data is delayed by a week and nobody knows how to read it. Funds cannot just dump what they have into decreased liquidity.

Also drawing “sell side liquidity” and “buy side liquidity” would not get you any closer to understanding the next move’s sustainability.

The market speaks to you via making directional volatility plots.

There was a fake out of the Weekly S2 (1.0945) and the daily S2 (1.0939).

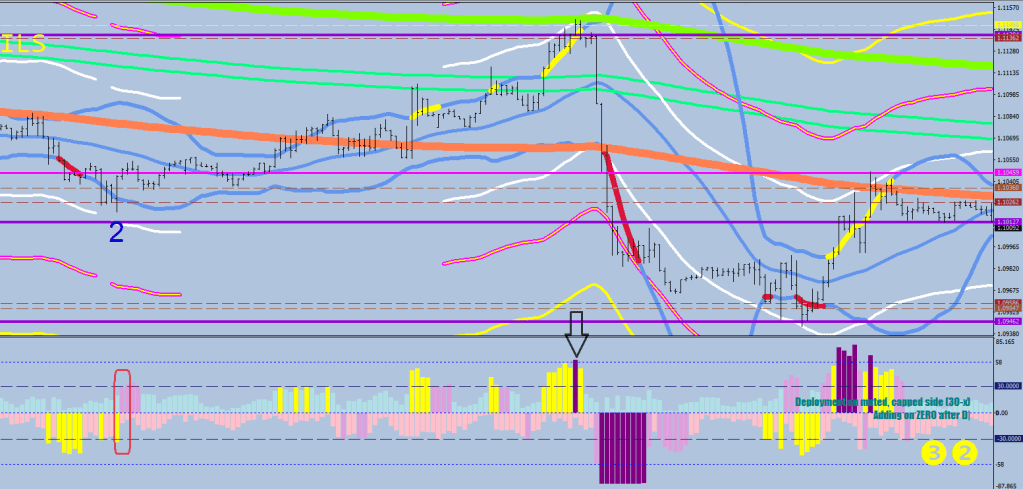
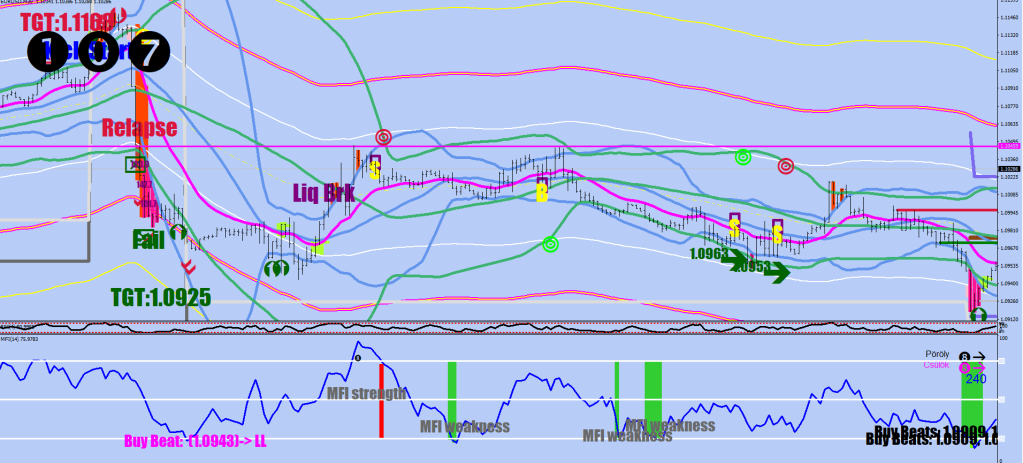
Other: the Money Flow beat got an extra filter, the ionosphere. A low / high outside means that a lower low / higher high is yet to come.

 if (mfi[i+12]<mfi[i+13] && mfi[i+12]<mfi[i+11] && mfi[ArrayMinimum(mfi,3,i+11)]<mfi[ArrayMinimum(mfi,23,i+15)] && mfi[i+12]<21 && iStochastic(symbol,0,120,3,3,MODE_SMA,PRICE_MEDIAN,MODE_MAIN,i)<72){
            ObjectCreate("Sals"+DoubleToStr(i), OBJ_TEXT, indicator_window+1, Time[i+10], mfi[i]-mfi[i]*.2); 
        ObjectSetText("Sals"+DoubleToStr(i), "Buy Beats: "+DoubleToString(NormalizeDouble(iLow(symbol,0,iLowest(symbol,0,MODE_LOW,16,i+1))-80*Point,4),4)+", "+DoubleToString(NormalizeDouble(iLow(symbol,0,iLowest(symbol,0,MODE_LOW,16,i+1))-140*Point,4),4)+", ("+DoubleToString(NormalizeDouble(iLow(symbol,0,iLowest(symbol,0,MODE_LOW,16,i+1))-220*Point,4),4)+")", 22, "Impact", Black); 
         if (Low[i+12]<(stratod[i+12]-400*Point)) ObjectSetText("Sals"+DoubleToStr(i), "Buy Beat: "+" ("+DoubleToString(NormalizeDouble(iLow(symbol,0,iLowest(symbol,0,MODE_LOW,16,i+1))-220*Point,4),4)+")-> LL", 22, "Impact", Magenta); 
         if (iStochastic(symbol,0,120,3,3,MODE_SMA,PRICE_MEDIAN,MODE_MAIN,i+12)>10) ObjectSetText("Sals"+DoubleToStr(i), "MFI weakness", 22, "Impact", DimGray); 
         
      }

Also the golden stripes now have a look right +1 sample comparison

  if (i>0 && RSI2[i-1]>RSI2[i] && Low[i+1]<guardraild[i+1] && RSI2[i]>2 && 
   ((RSI2[i]<RSI2[i+1] && RSI2[i+1]>.5 && RSI2[i+1]<3.5 && RSI2[i+2]<4.5)
   || (RSI2[i]>RSI2[i+1] && RSI2[i+1]>.5 && RSI2[i+1]<3.5 && RSI2[i+2]>3.5  && RSI2[i+2]<7 
   && iMFI(symbol,0,14,i+1)<45 
   && iMFI(symbol,0,14,i+1)>25  ))
   && iLow(symbol,0,iLowest(symbol,0,MODE_LOW,6,i))< iLow(symbol,0,iLowest(symbol,0,MODE_LOW,10,i+7))
   )

Still a virgin afer all these years

Market M.O.

Let the virgin become a surgeon and the surgeon turn into a sturgeon.

The market operates the following way: it is printing virgin levels that it can push against go get a directional move going.

Where’s the fire? One virgin put out…

show me the meaning of being yellow

these levels are attractors, but repellants soon after their cancellation before ultimately becoming neutral

This is an example for the 3rd spike not making it outside the BB, thus the outer limit was printed by spike 2.

Hijacking

Hi, my name is Jack and I’ll be your hijacker today.

Everything’s been going like clockwork for several months in terms of terminal patterns coming about and playing out to the T.

Today, there was a shocker move: the zero got run over.

After the volatility breach / break out the price would settle back to the 30 SMA for a reset. The move from there towards back to the BB gets cut short by the Aggression. That’s player one (with a Zero shirt on) positioning at one side of the volleyball net. Player 2 tries to hit back the ball. If he/she slips, there is a helper by the end of the BB field. That’s a second touch for serving back the ball. If the second player drops it as well, the break is on.

Similarly, now the price is expected to settle back to the S30 net for another Aggression that would be received by the Zero and there would be another game where hijacking becomes a possibility.


Now let’s move onto Baroness Münchausen.

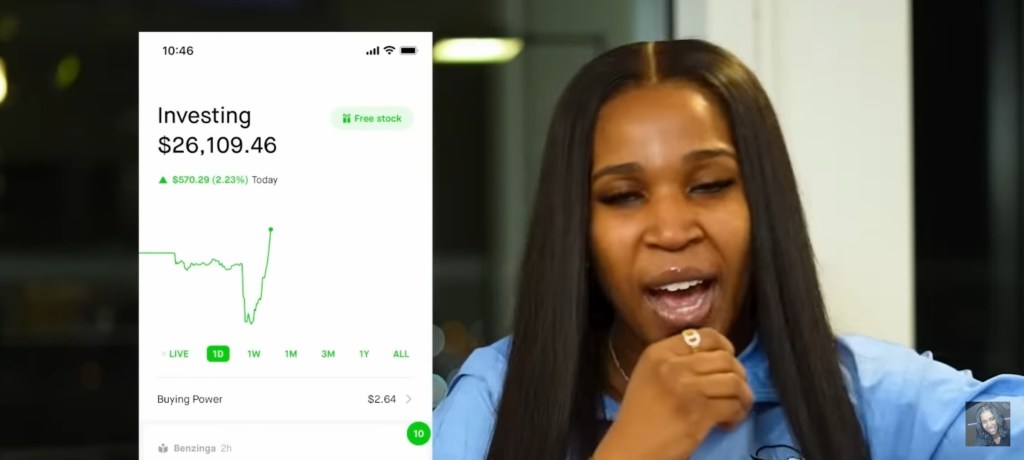
With that tumbnail image and a random snapshot of a 26k Robin Hood account with a daily gain of $570 (2.23%) from somewhere are meant to be the definite proofs for her claim of making 6.5 million in 2 years starting with a negative balance.

“I turned $26 to 26k, then to 100k”…

“You think I’m lying? Well, motherfucker I’ve got proof”

This is a terrible future we are veering towards. The bigger liar you are, the less spine you have, the higher the likelihood of you succeeding and getting rewarded in life.

742k views of this absolute nonsense.

“There is the retail and the institutional approach. You can trade it either way.”

Sure, it is a personal preference to make money or to lose.

After this you need to ponder a bit about how much people like Graham Stephan and Yassir Paffrath are inflating their bottom lines as well.

Graham would sell his mother for a revenue producing YouTube video, refer to his insurance policy of making a vid on giving his girlfriend 100k to max out returns.

Disgusting these people are.