A parabolic market starts off with a 7hr pullback + squeeze, then stays outside the Stratosphere / 8 emo (max. 1 close over) The parabolic move would make it outside the 30BB.
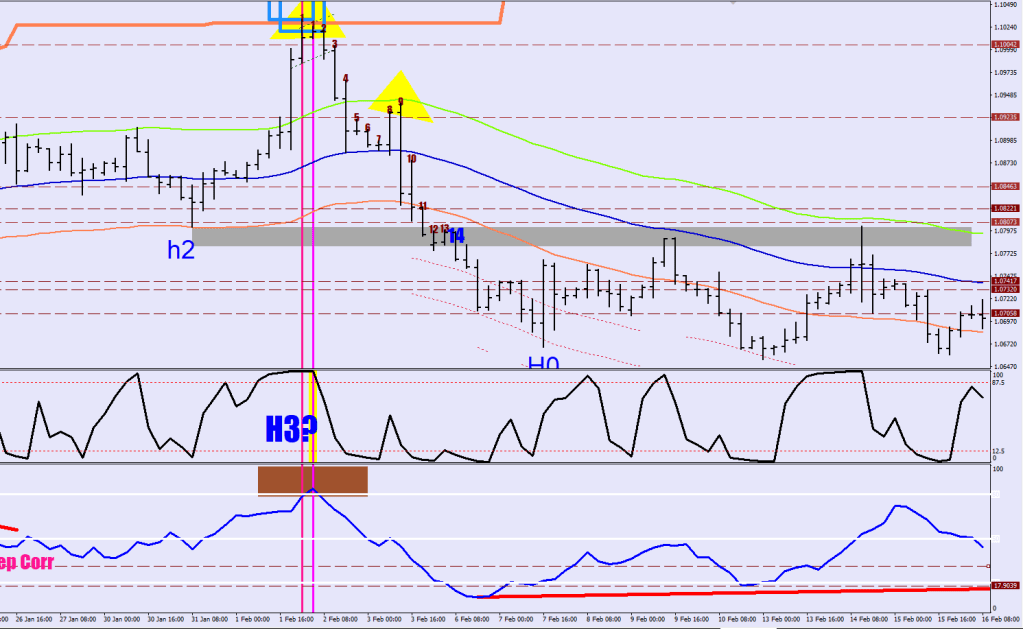
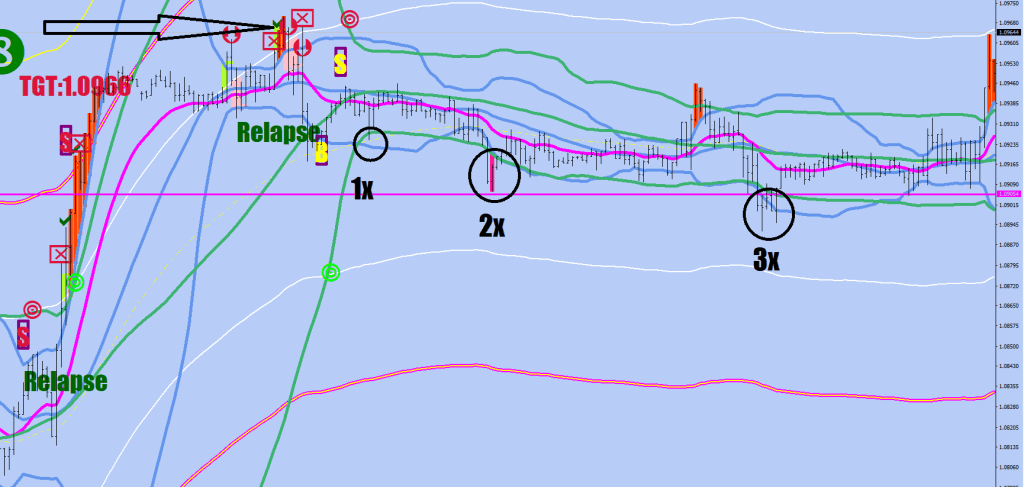
The market is going from powder box to powder box making H1-h1 H2-h2 H3-h3 sequences, where the h2 box either holds as a support, or it gets broken. The first hump after the back tedt gets a H0 count. The initial penetration starts a counter. If 14 manages to keep out of the box by more than 50%, you are home free. If 14/15 makes it over 50%, a continuation in the same direction is expected – from H3.
A quick drop away from the powder box is a mean reversion to E9D.
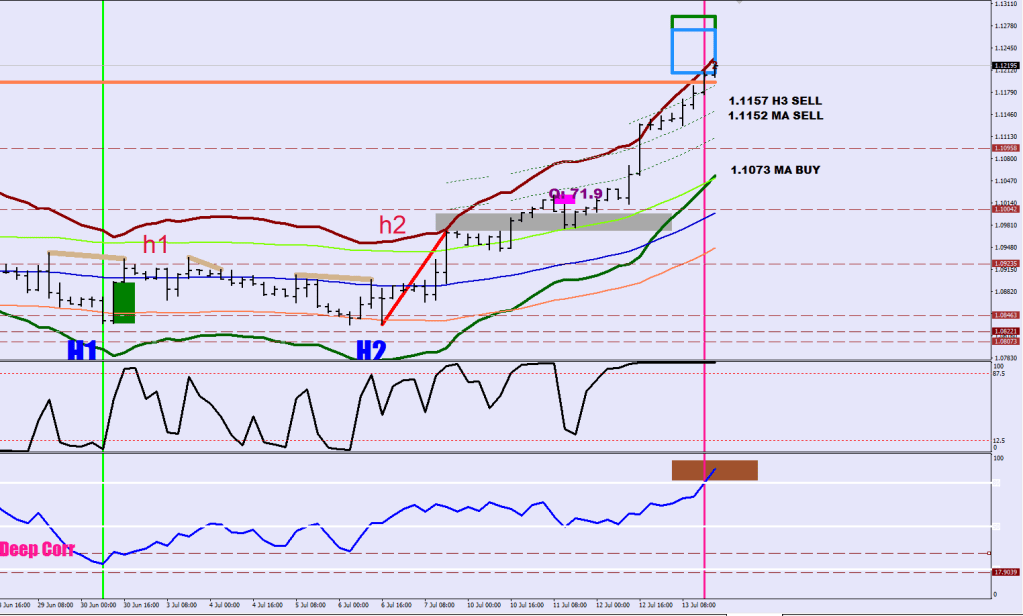
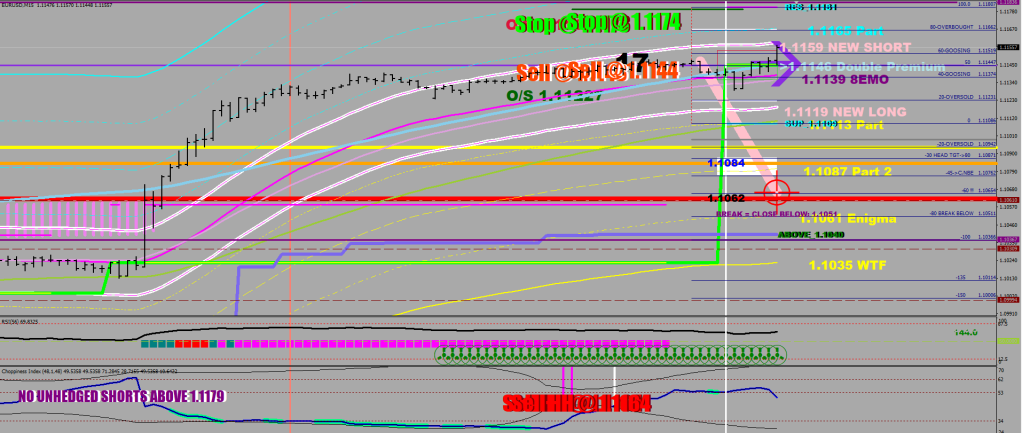
Tie Machine has the MFI peak beats at 1.1152 & 1.1158.
Axel H has the Ionasphere breach pointing to 1.1160
The CI rabbits mark up the range of 1.1144-1.1174, usually the peak comes in 6-8 pips of the outer number. There is also a 1.1164 HH sell call
The divergence lines show a started reversal divergence in yellow, and we are adding another point to the line.
The Quarterloo weekly plots show a white lie (white palm) over this breach above the megaphone and the brown trendline. Should get a close back below by the end. R3 came in at 1.1148.
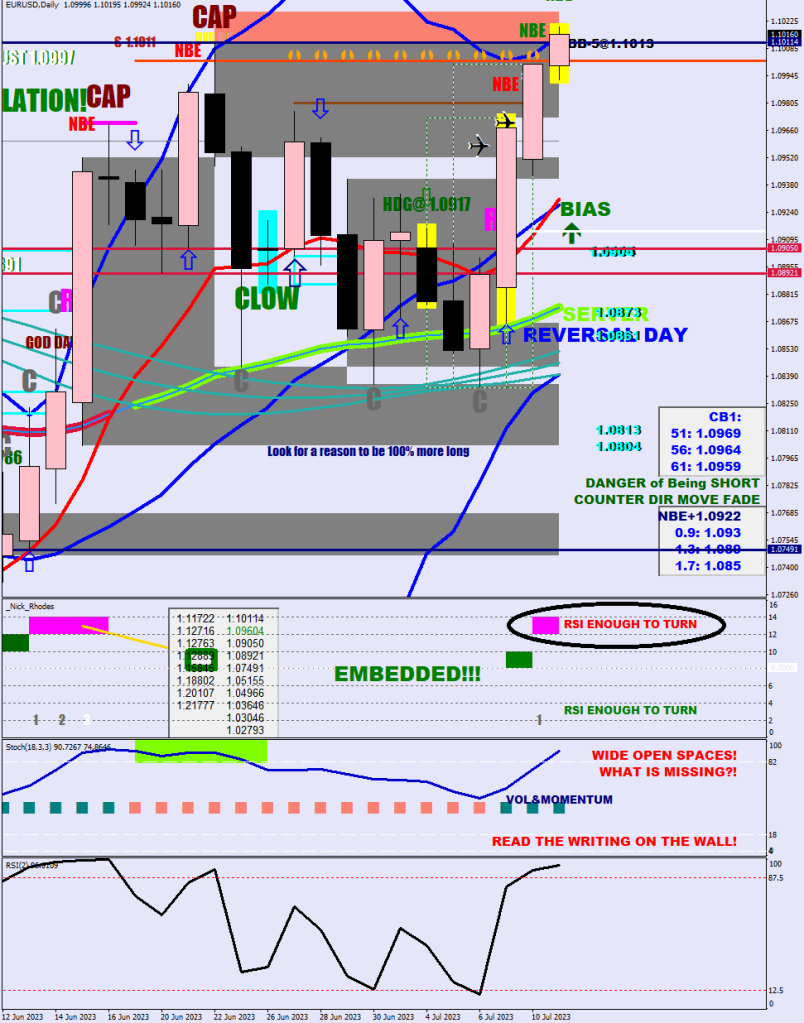
The daily shows a hearty attempt to catch up with the bottom of the uptrend from the bottom.
We all get biassed by others, so we must come up with something more reliable, something close to black and white.
So what tools am I proposing for this reason?
RSI2 HL2 hourly to start the counter.
Second thing is clear definitions in your head. A pullback that has low volatility and never makes it beyond the hourly 30 SMA is a pullback, evren if it looks like an ABC structure.
A correction thus would get to the other side of the nentioned barrier, providing us with the first check point.
Not a correction.
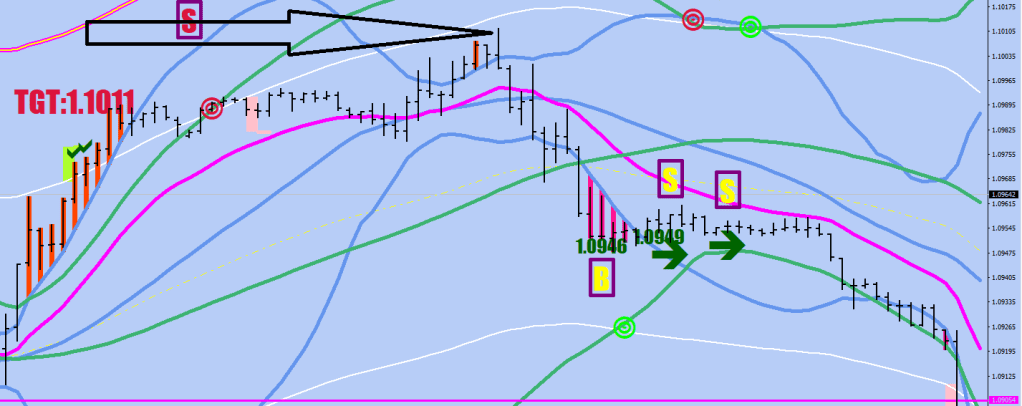
A move to the other side of the S30 in 7 hours is a break out preparation (Score), with a count down for a follow through by the 11th hour.
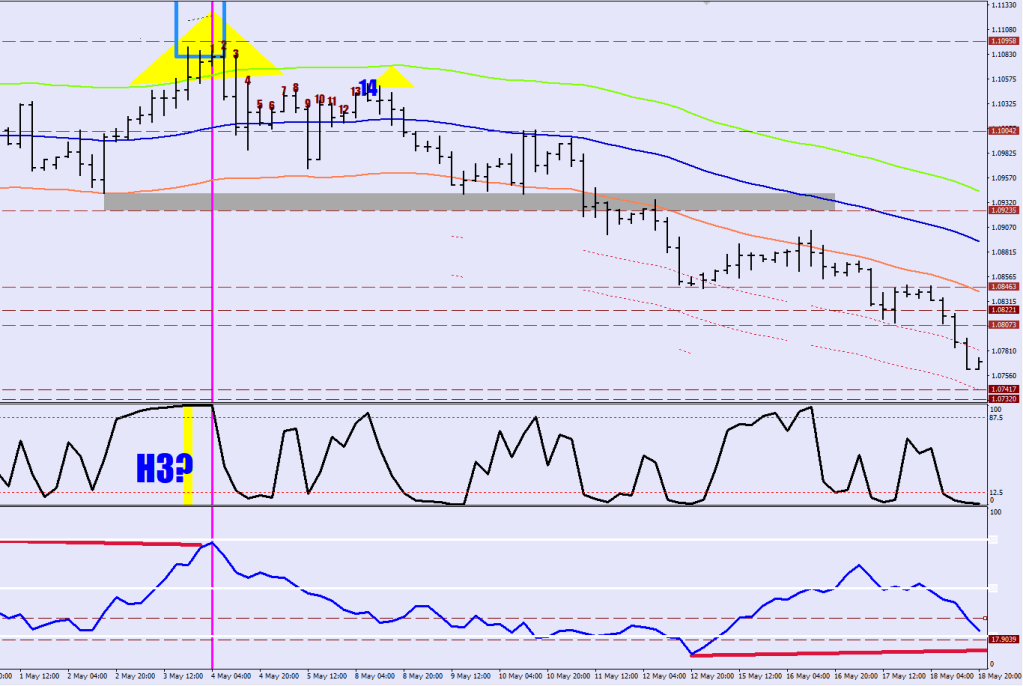
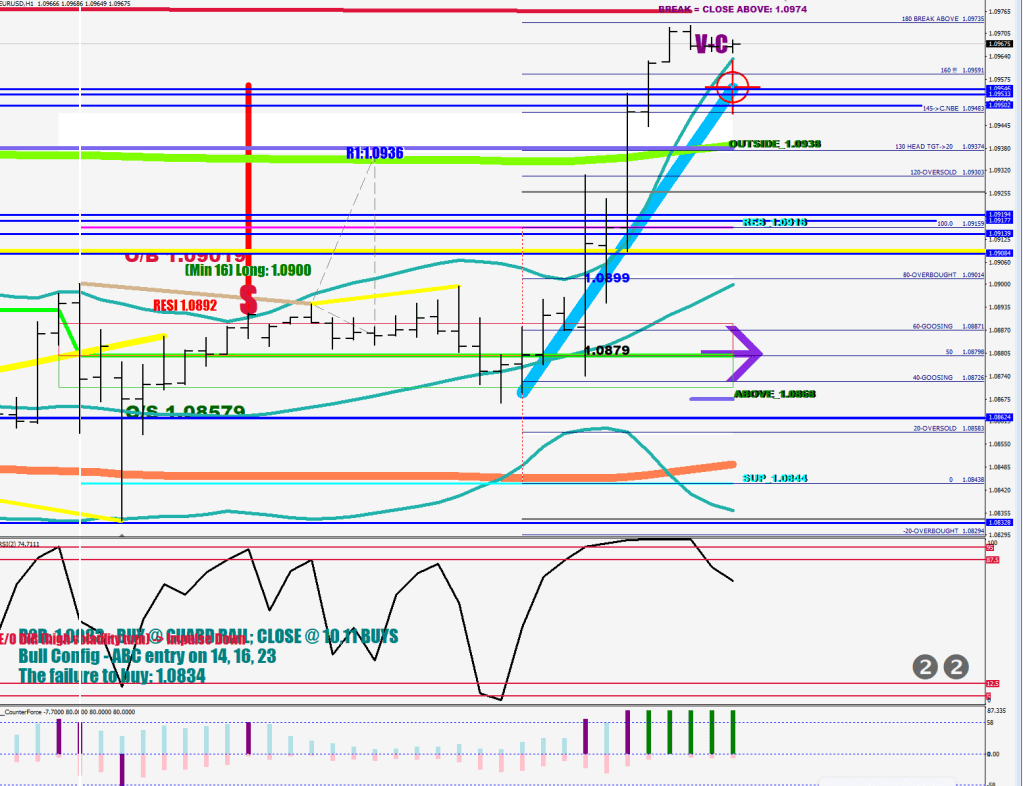
This ABC correction was a loneliness kind though only lasted 8/10 hours (see first image) versus the common 14-16 hours long one.
Here’s Pippoletto elegantly and smoothly identifying the entire ABC correction as an A leg down. I’m sure, Mr. Fifonacci was there to back him up on this.
Looks on one time frame may not be enough. All the Elliott zombies of the world may not be enough.
My mind was elsewhere, I was trying to find a liquidity break instead of evaluating the correction properly.
The 2x 30 min disconnection was lot followed by an RSI4<10 and an RSI4>10 for a liquidity break call.
No liq. Brk, but MFI went off the charts.
The point is, you do need the right indicators, the ability to count and the knowledge of what is what and when.
Hello junkie sweetheart, open up the floor and shout it out…
Alphaville is great. It never had the issue of not up to par lyrics. This is an article for noone.
One feature of an ending tail may be 15 hours of selling / buying with the 15th hour still making some progress. By this I mean.closes on one side of the 8 EMO.
To me it was a revelation that time picks the level.
So, what works and what doesn’t?
T3 alone was a miss.
I screwed up a filter value by 1 point to back up a false premise. Curve fitting.
Yet, if we apply the 15-hour metric and the back to back Stratosphere failure evidence to a money flow peak-beat, no we are onto something.
X-X
My head is in the gutter, but I’m smelling fine – can you taste the difference between populist contentful writing?
Coherent, well composed things are hard to make fun of. It feels like a rape, a disrespect.
A parody of something funny just underlines the fact that it was a laughing matter to begin with.
MFI beat to be exact. By which I mean MFI divergence. The size of the beat is coming in at 8/14/22 pips + abated MFI strength relative to the reference point.
It is important that the reference 14-sample 30M MFI is made with an overbought/oversold 120-sample stochastic reading.
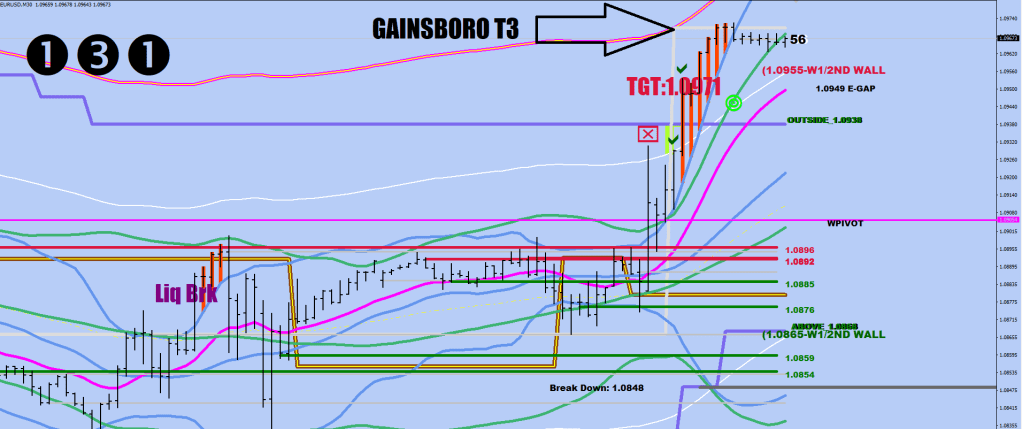
The dark gray line is “darko”, a fluctuation-size displacemet of the gainsboro T3.
How do you know which one of the 3 numbers would be ultimately right? You don’t.
You need to cut your directional holdings that are in gain, balance out the rest or – if you don’t have any holdings, go in with your normal size at 8 pips, add some, say another 20% at 14 pips and add some more at 22.
…
1.0995 got called too
had to change back one value to correct this issue
if (mfi[i+12]>mfi[i+13] && mfi[i+12]>mfi[i+11] && mfi[ArrayMaximum(mfi,3,i+11)]>mfi[ArrayMaximum(mfi,23,i+15)] && mfi[i+12]>79 &&
No print on the precious red is the difference.
The concept is great, but the calibration may be off as you can see.
You put up all of your money on a less than binary option… and it’s gone.
I remember how much I was always against gambling. My ex boss literally almost had to force me to throw some of his coins in random slots in Reno. Been to Vegas 4 times. Never gambled a penny.
The cabinet maker I knew lost 17k (all) on a single spin on Roulette. What an idiot – I thought.
Yet, before I left the US, in a span of less than a year I lost a total of 170k, two thirds of my savings. TNA plus Weekly Spy calls if you want details.
When you find yourself in a desperate situation, you reach after trading for a fix. I quit one job and lost the other. From monthly 4,500 savings to 2,200 shortfall. I became a wall street degenerate, and the addiction never went away.
Confusing luck for knowledge is a big one.
My only hope for a future in trading was always to specialize, so that’s the path I took.
All I know is that I am trading with debt now. Not a smart thing to do. Taking a holiday to St. Maarten & Anguilla, because I’m married, this year is a 20th, a 50th and an 18th anniversary. Epenses spiraling out of control, kid going to univ. , needing new comp & I’m buying ome 8-core for myself as well while at it.
On the plus side I have some tangible knowledge now that should translate to income. Luck is sure to run out. Understanding can last you for a while.
So who’s doing it right then?
I hate to say it, i hate to say it, but it’s probably Sting.
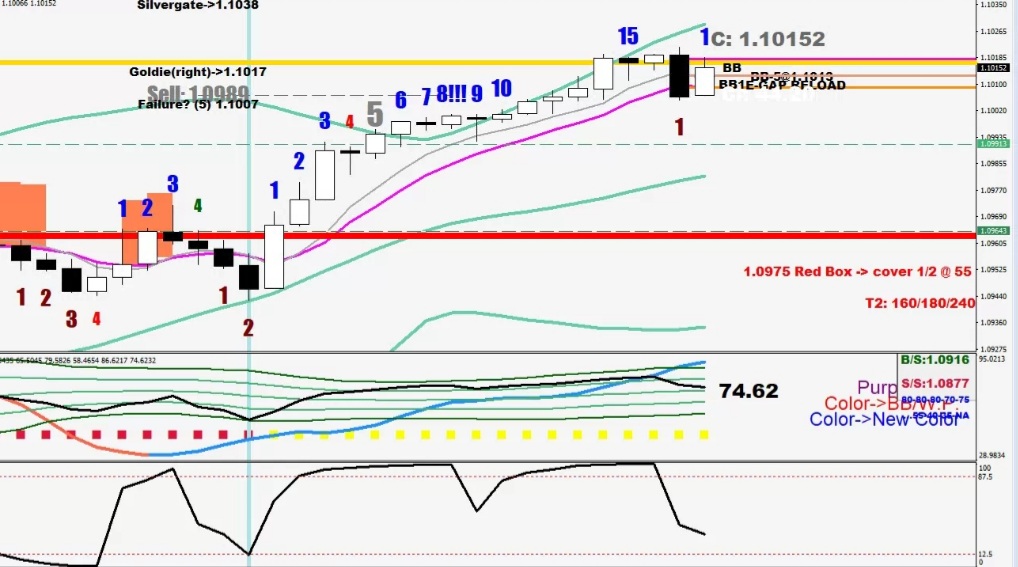
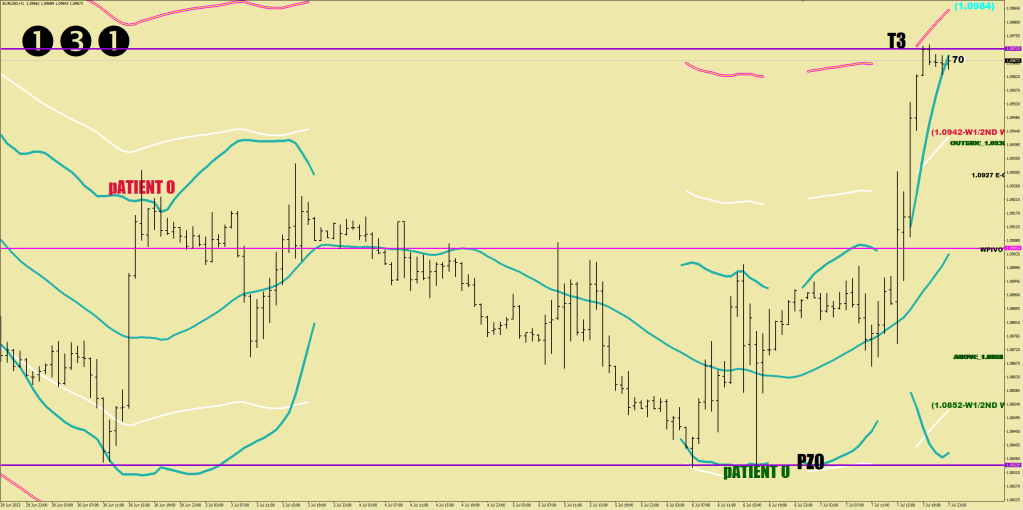
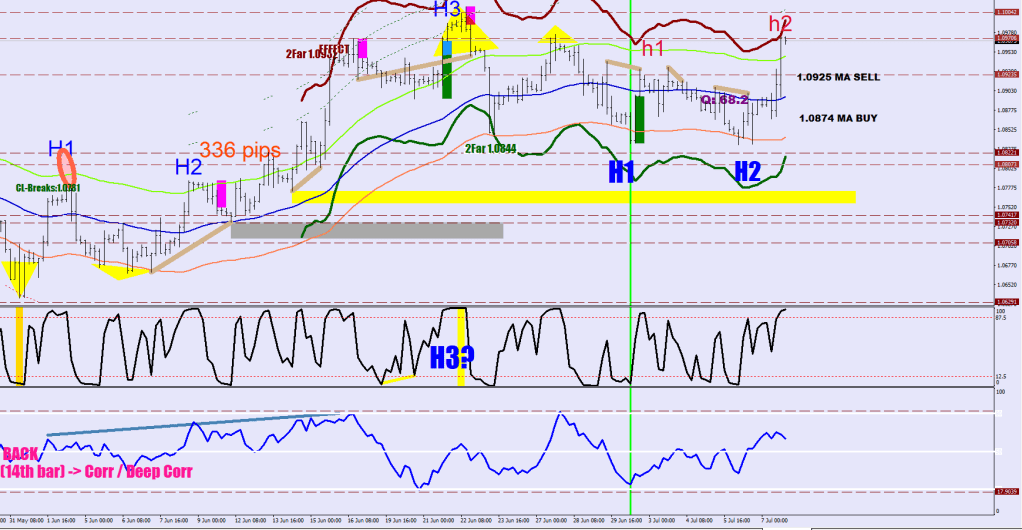
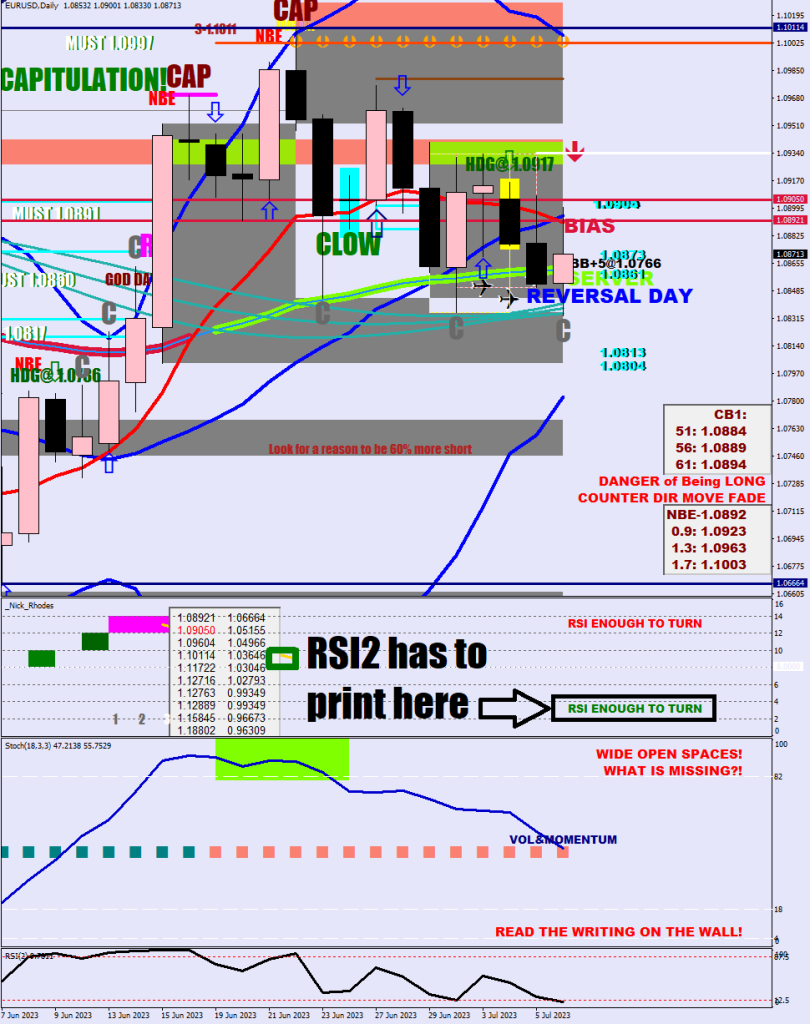
You are looking at a SAAB black panel. An aviation heritage, displaying only important information, leaving all else black.
People can’t stand my charts, because they are so busy. I just added this T3 line in Gainsboro.
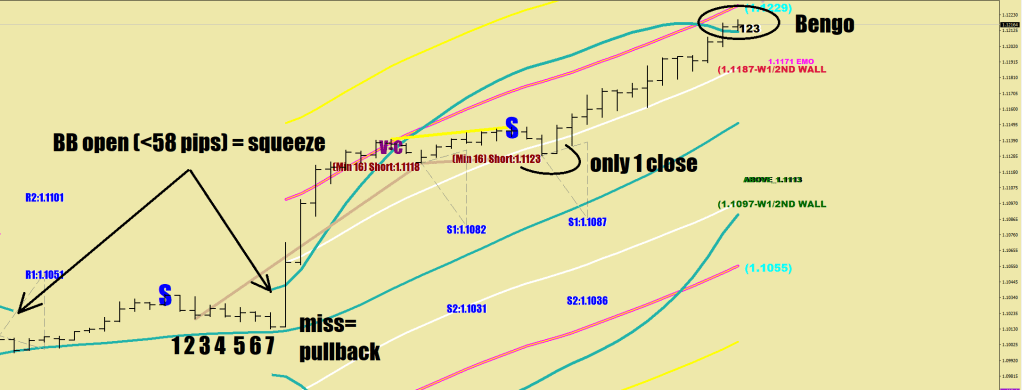
The black numbers are the width of the 30-sample hourly BB.
And now, I would be pedaling against my own trend with my PaleGoldenrod (another MT4 color) panel.
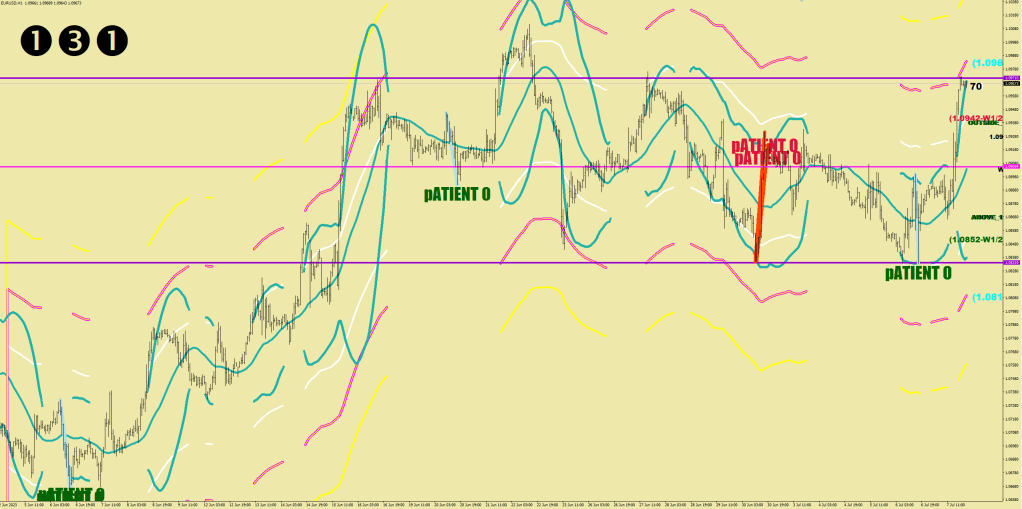
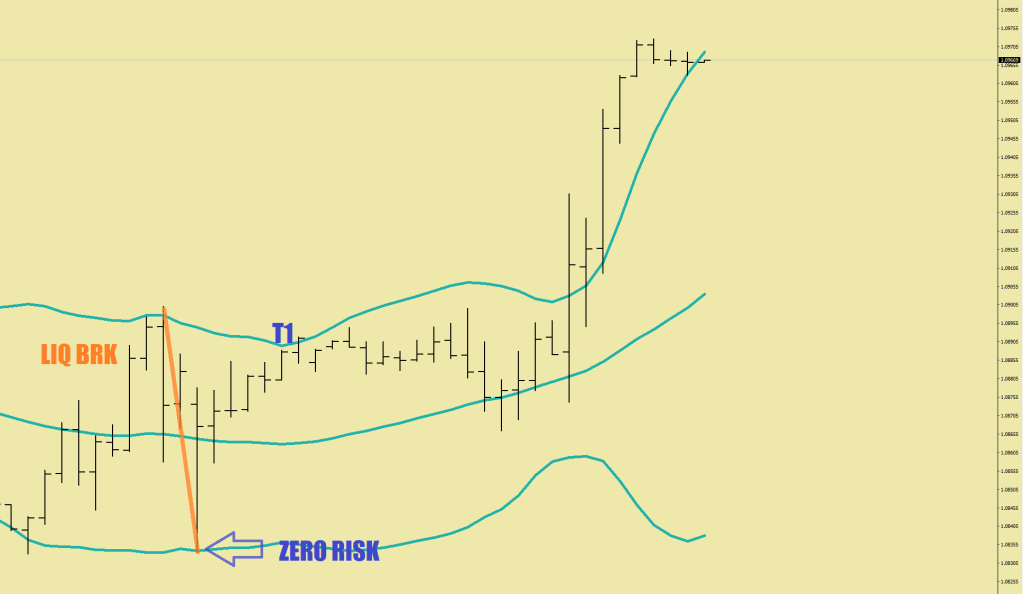
Patient 0 is the starting point of a zero risk entry. Zero risk means a possible moratorium of a fluctuation size (32 pips). Patient zero needs a BB 58 pips or wider (zo do all the targets) and a move from one BB to the other within 7 hours.
The line encounters are the terminals.
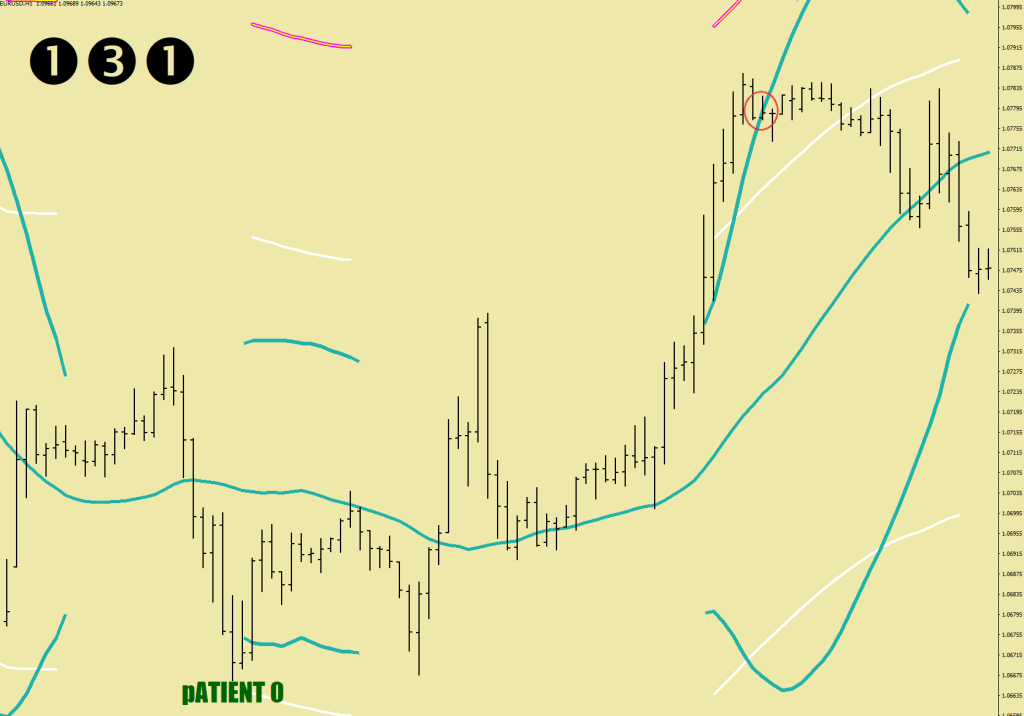
The Pirelli Zero horizontal plot could be automatized, but I have to put the T3 on manually as it reqires a 30-minute chart with a nil-checkmark sequence for a valid projection – see the first image.
– …or the break of the S high / breaking outside the 30-min 30-sample BB on the upside.
Those green bars will adjust the daily S1 and S2.
A subject I would normally never pick: risk and reward. You cannot plan for any distance that has not been fulfilled already; an arbitrary number that is not rooted in statistics is just an arbitrary number. What’s more, your risk only makes sense if a stop loss is set and does not get changed around, and if you knew your reward ahead of time, you would have zero risk.
Now with all of that said, let’s take into account how this idea could be shaped to a tool.
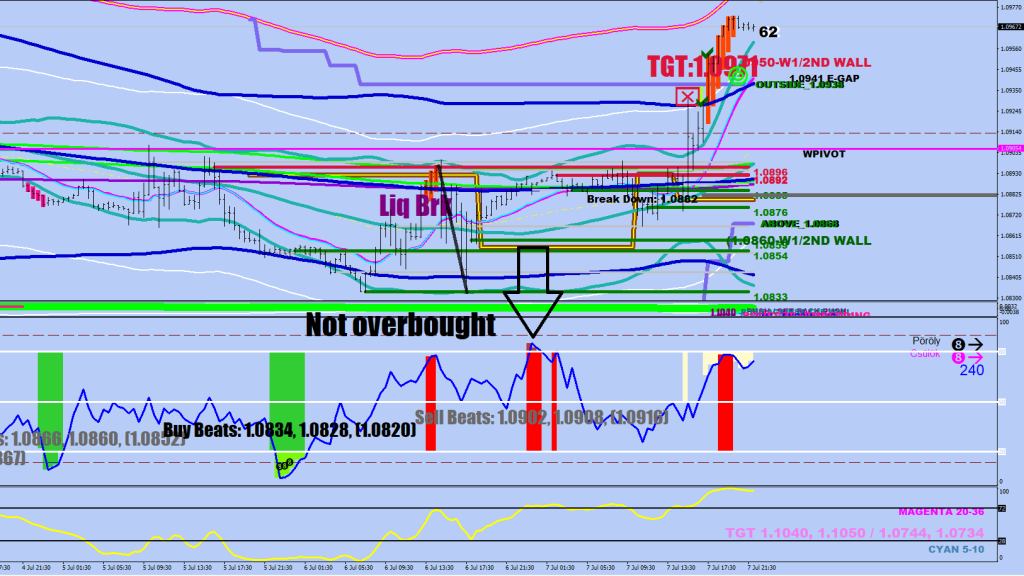
Once you have the direction right based on Money Flow divergence or the Liquidity break, you can call the 30-sample HL2 hourly BB’s one side zero risk.
The other end of the Bollinger Band would be T1, or Reward 1.
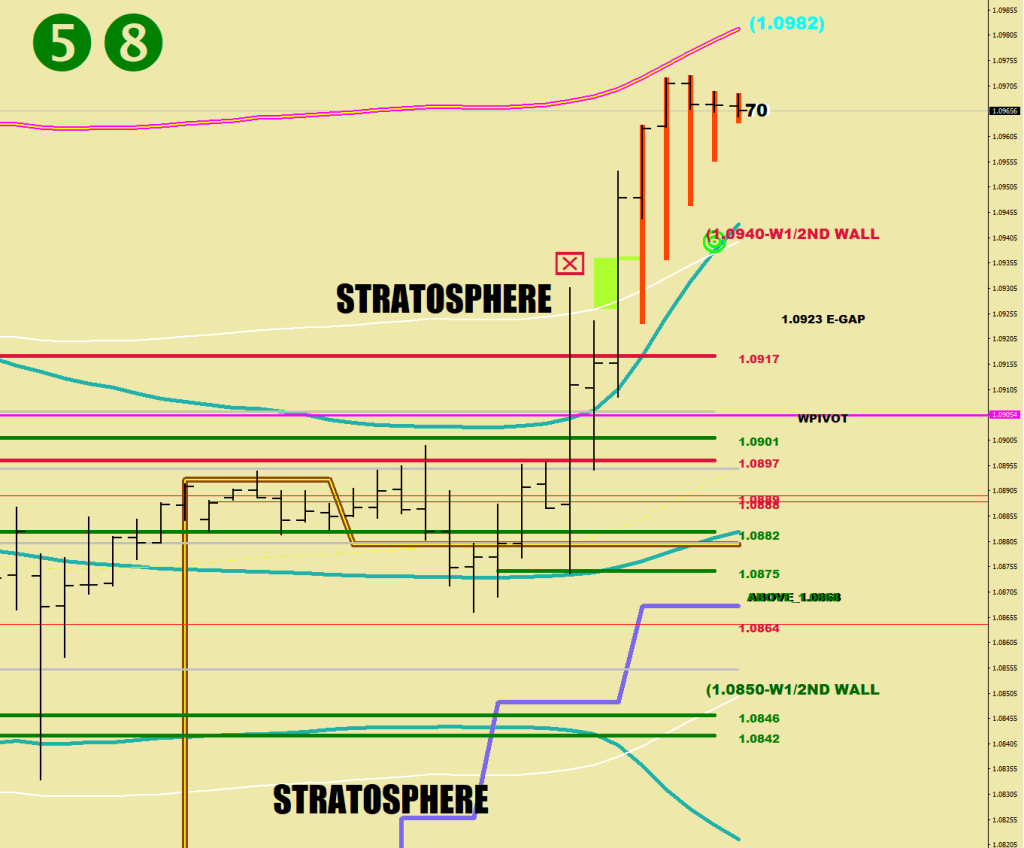
The second target would be the Stratosphere line which is 45 pips away from the E-16 HL2 (white lines).
This is why I automatically fit my orders with a Code 47 cropper (close 47 pips away from the E-16) by adding 4.7 or 0.47 for stop loss.
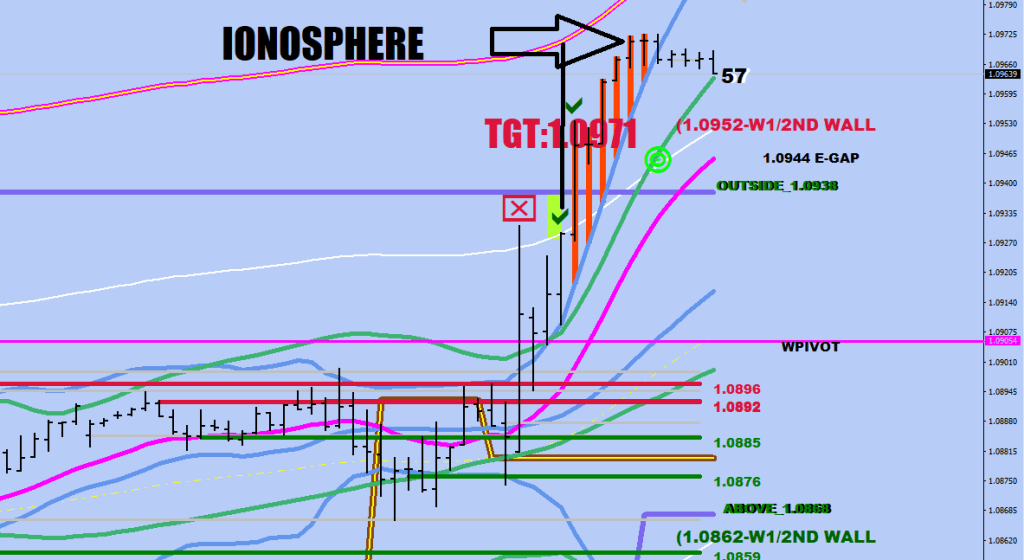
T3, or the ultimate target does not exist until you see the the 30-minute closing outside the Stratosphere line, this is when a target projection to the momentary location of the Ionosphere line comes into picture.
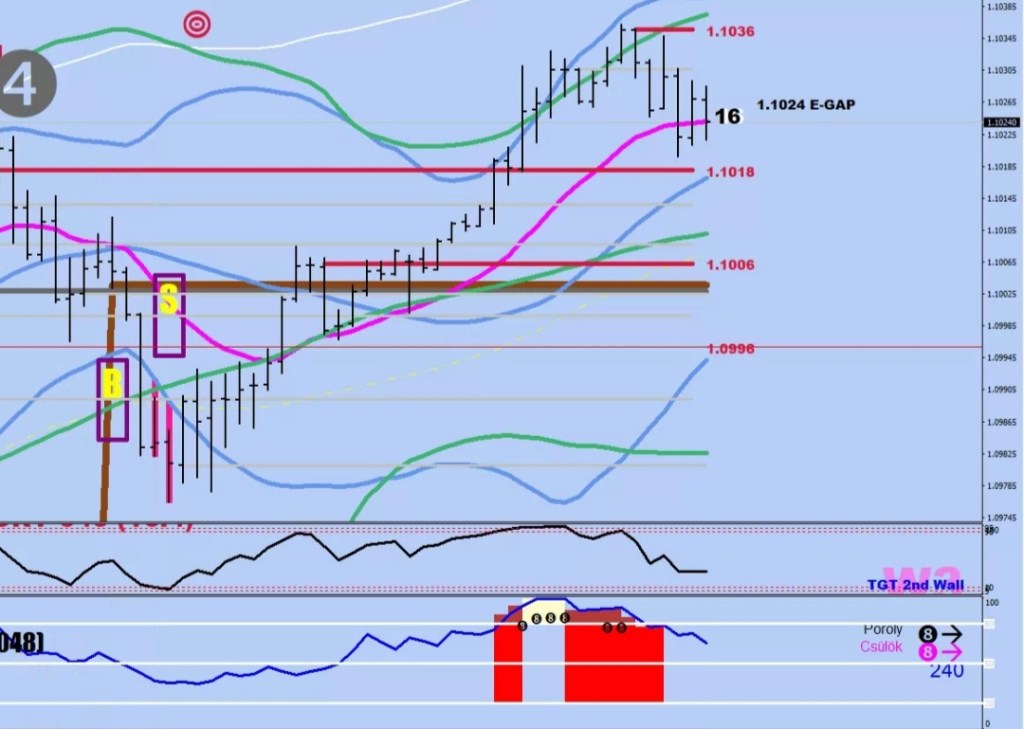
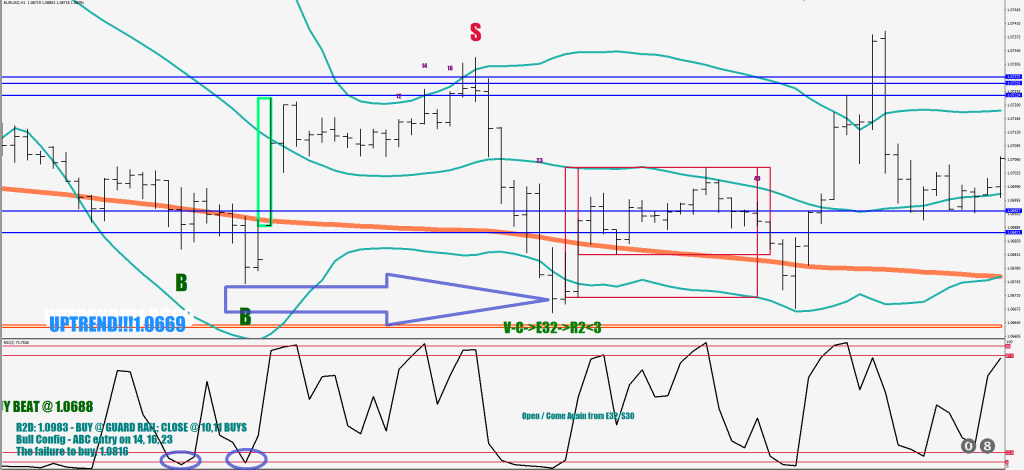
As a bonus here are earlier examples of what happens when the T3 gets hit.
The condition is known as Double B which prompts a triple breach.
The double B marks the end of the middle wave, i.e. wave 5 of Wave 3. After the triple bypass a Wave 5 would follow to apply a further divergence finishing the direction for good.
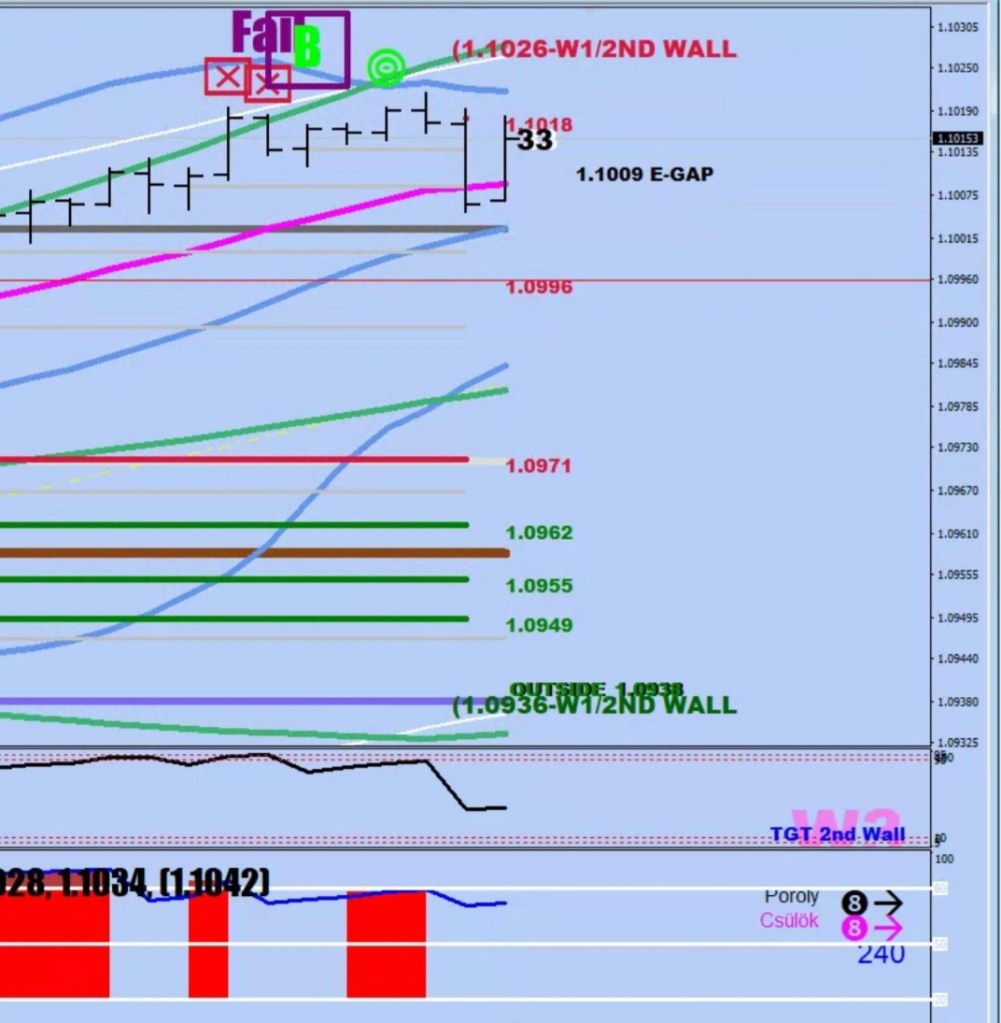
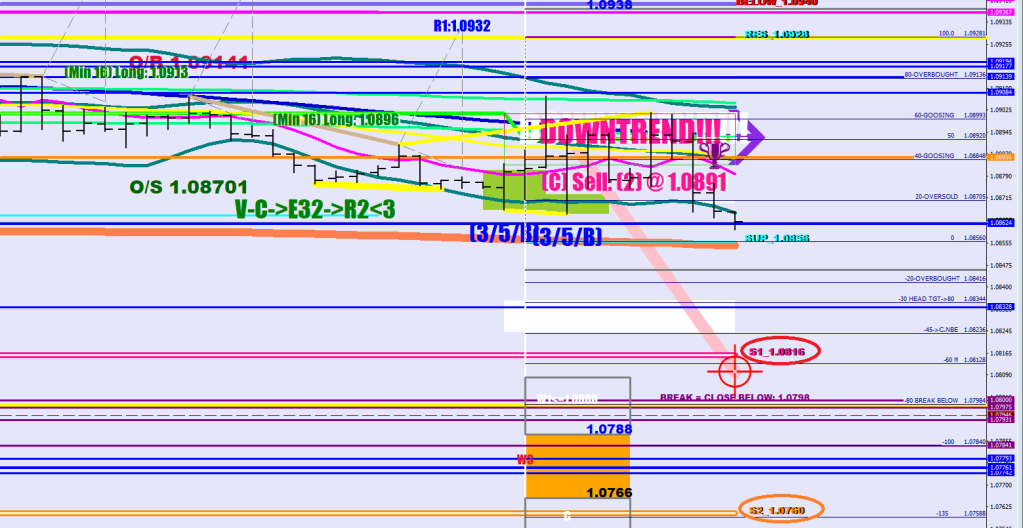
There will be more downside from the 30-sample upper BB, but not a whole lot beyond the current low.
The 3 lines are the S-120, the E-207L and the BB30 HL2 upper.
The one thing that may be different this time is getting a new consolidation. Following the earlier plan, the S1 daily (1.0816) – S1 intraday (1.0808) would be expected to hold.
I’d say we are now back to looking at the 1.0780-1.0760 range. (Daily S2)
How about the consolidation mean that has been plotting lower for the last 50 hours? (Yellow-Brown)
A Wave 5 could take price to the Daily S1 or the S2 depending on instant emotion. They are gonna be tested for the first time, so I would think some bounce off the S2 (1.0760).
I would sell any move up to 1.09.
To let you grin.
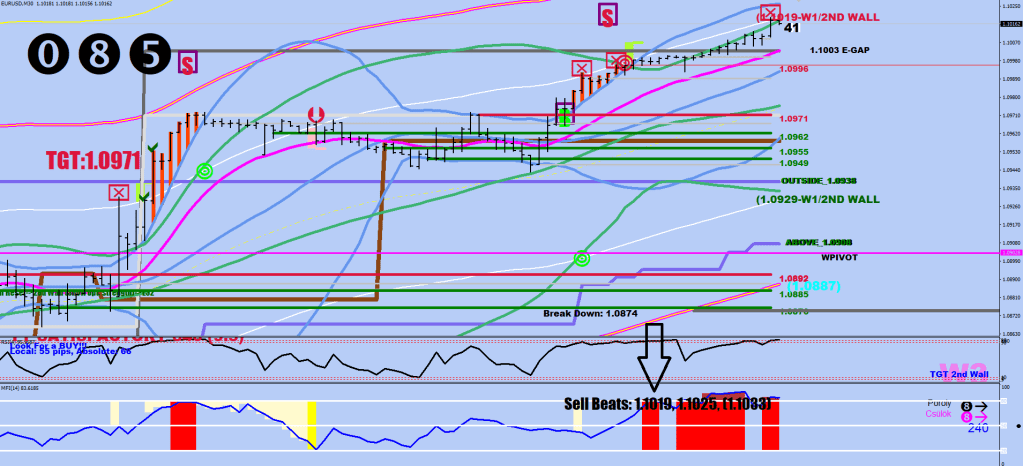
Today’s notes of the new trading environment.
The direction is coming from a Fail + a back test. 3 disconnects results in the re-visit of the 30-min BB. If the 3rd disconnect goes beyond the Stratosphere, that also qualifies as a direction change. A target projection fill also qualifies as a direction change if the heavy disconnection block does not turn support. A liquidity break goes against the overall direction hard for 6-7 hours. It is 2×30 mins or more spent being disconnected, printing a deep RSI4 reading on the 3rd candle and giving up on strength on the 4th.