3rd Divergent Pitch print. Yes, but there’s more to it.
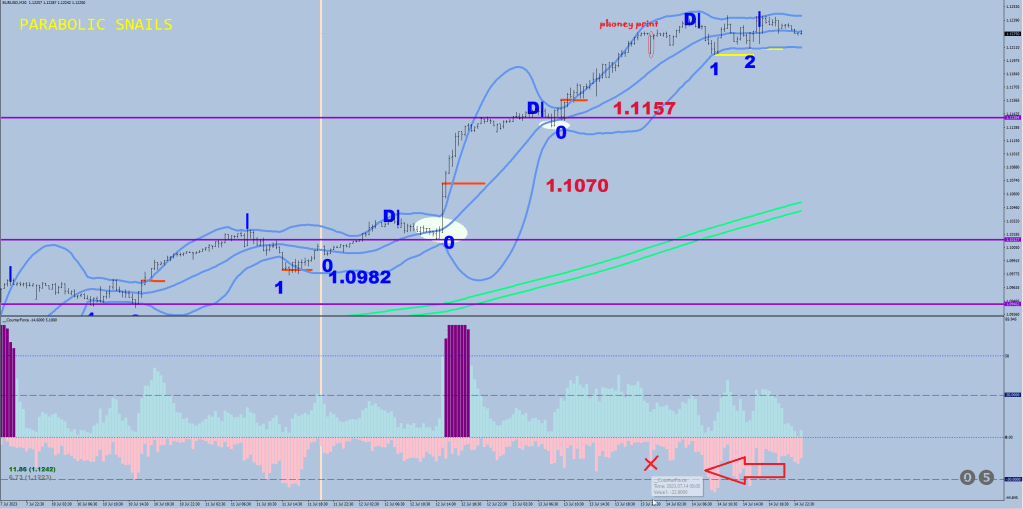
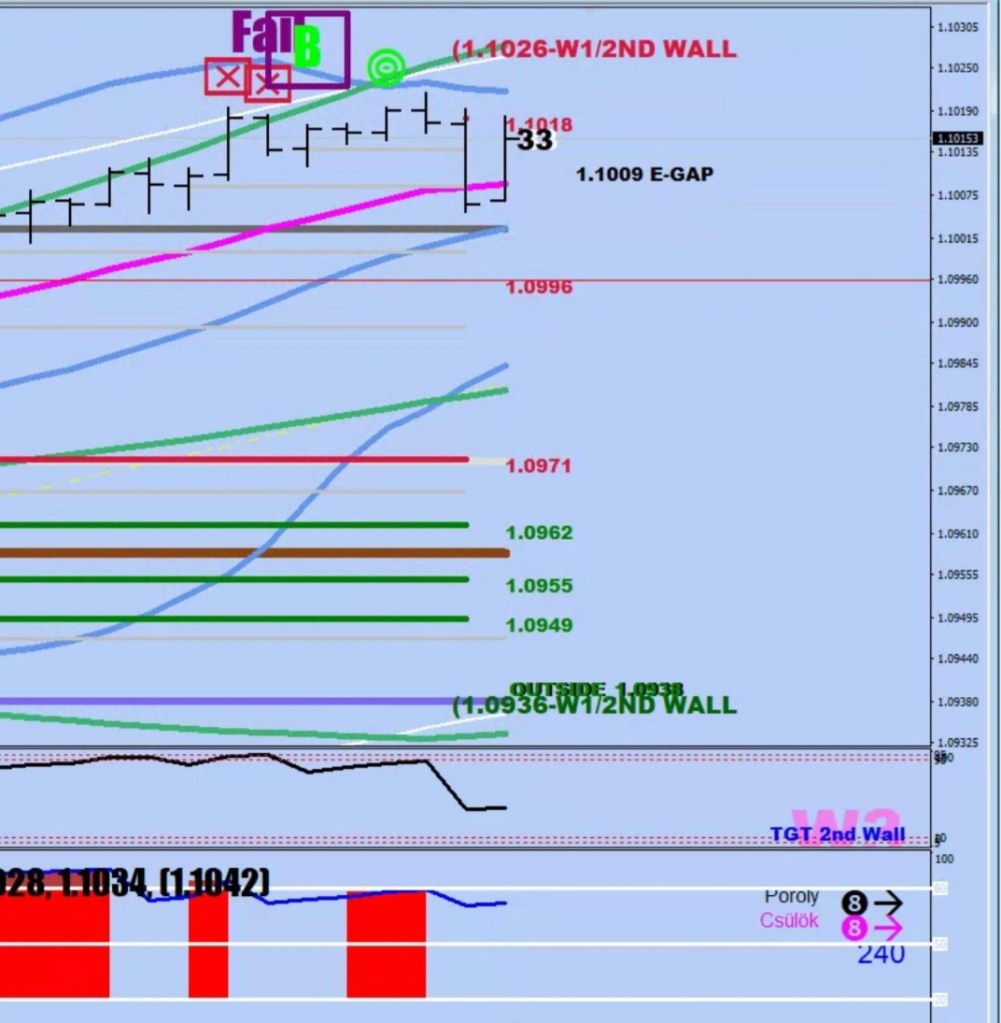
1st thing to metnion about the return of counter volatility is that there would be phoney prints due to the 10PM GMT forex broker re-balancing, where they smack up the spread to call in all nearby pending orders within 20 pips, see below.
Nevertheless, someone did end up turning off the buying program that did not allow dips to form in excess of 25 pips on Friday, see Arrow.
Hitting the lower Bollinger Band for the first time is also a clue, but remember, that the bands could contract below 30 pips, so the overall 30-pip dip criteria may not get fulfilled.
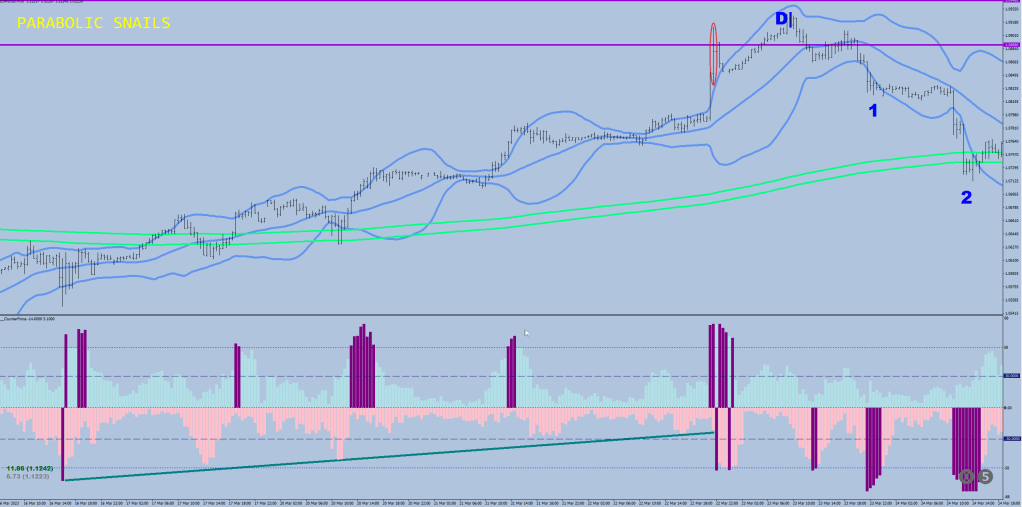
On a previous example, the buying wasn’t so extremely intense. The below 30 dips were more like counters. Again, count 3 was Dracula.
As you can see, the dip after the D Pitch went below the BB, but did not reach 30 pips.
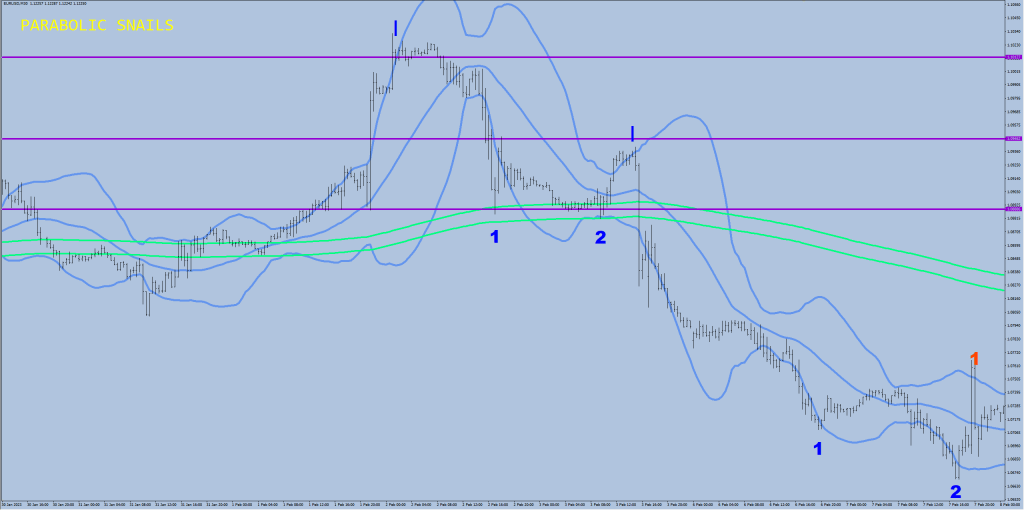
The last example shows a volatility taper & explosion. The top wasn’t much further out
Either way, monitoring counter-directional volatility development is a great too to have, escpecially when price gets outside the Valley (Guard Rails).
The 3 mentioned “Trending” makets are very different from one another. Trending by itself does not say much. Parabolic? Channeling? Tapering?
As far as the correction goes it should have two legs where price would get below the 30-sample BB and show for 50+ pips of downside volatility.
Push (hand) and echo (house) stats. (Upside for now)
The purple boxes are there to help to give two likely levels to get in on.
With the current high not changing, it is 1.1163 & 1.1112.
There is a 3rd line that comes from the measurement maximums is 166 pips lower (cca 1.1078)
The shallowest push pullback are at about 90 pips.
Looking back all the mean reversions, the likelyhood is great that the entire move would not end before getting below the Green River (E9D) by up to 46 pips.
Total pullback legths were 90, 168, 97, 167 pips.
The echo peaking may be occurring the following week, most likely two weeks out, but there has been an example of a third week, and also worth noting that there was an echo that received a “time out” because of falling short after 2 weeks and price was headed lower to close the wave structure with toucing down on the S1 which is 250 pips lower from the push value.
No point talking about the c1 and c2 values and the target line just yet.
Hey now,
We want to know how this correction would go first.
Snapshots of 3 examples.
The likeliest route is the next one. A quick ABC with opressed volatility peaks (D-bats) and a terminal 46 pips below the Green Flow.
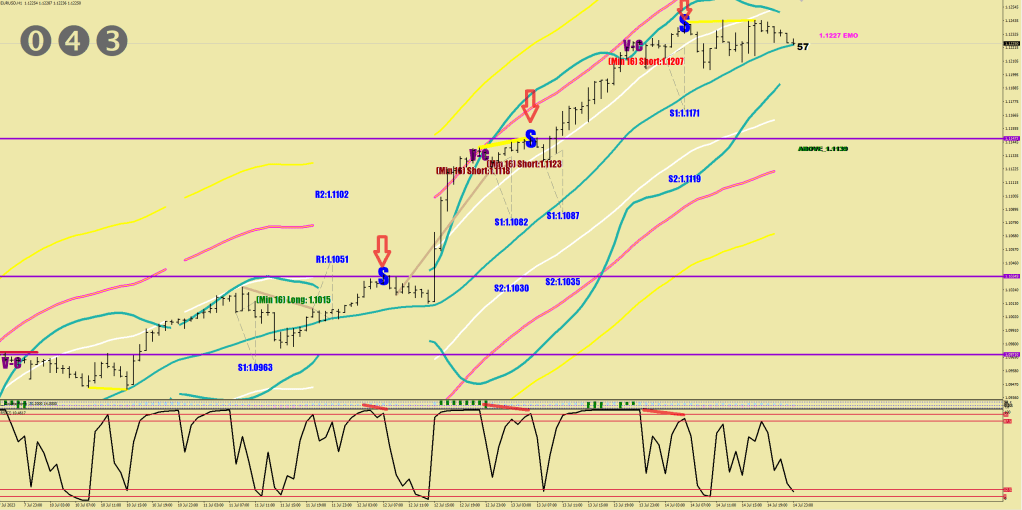
The divergent pitch. First, on the hourly. RSI2 divergences marked with red (S, arrow). Prompting some sort of corrective movement.
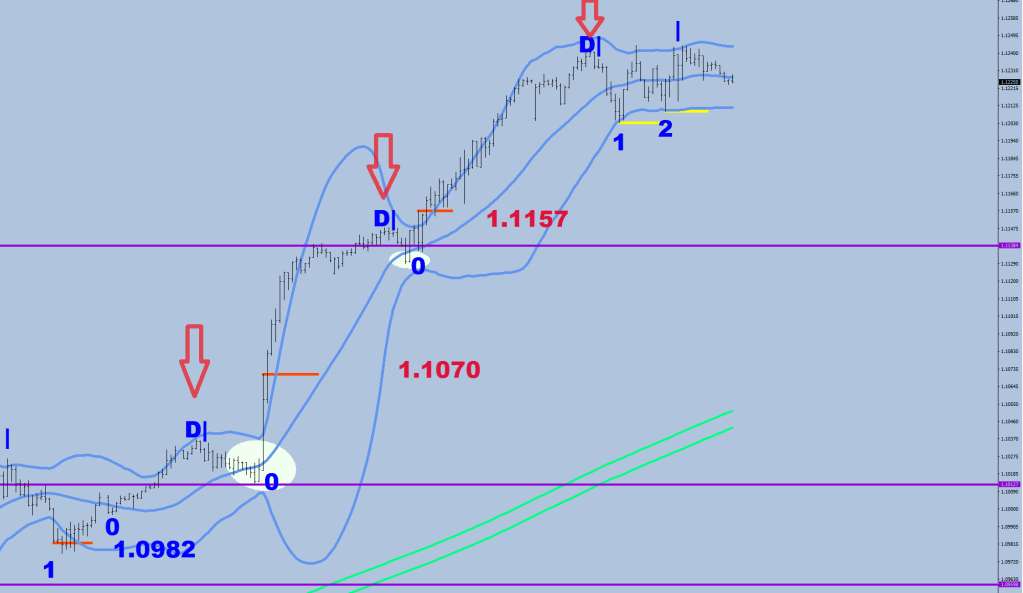
On the 30m, you are looking at the same 3 pitches. See that these pitches fall short of the 30-sample BB top.
See how the response for the first two was getting in just below the 30 sample SMA, before the lower BB (white oval+zero).
The last time was different.
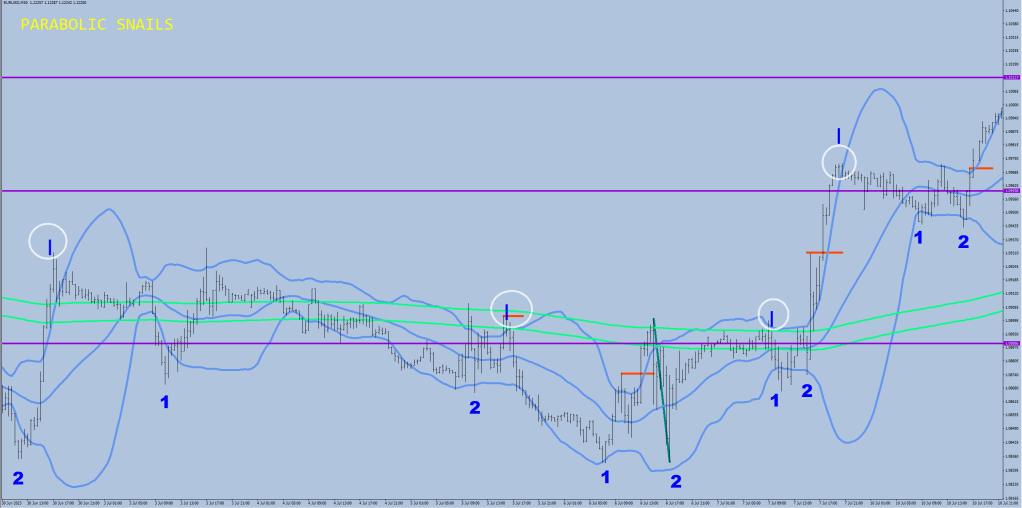
We got a Blush Response called Capillary (1) and Dialect (2).
Short histoty.
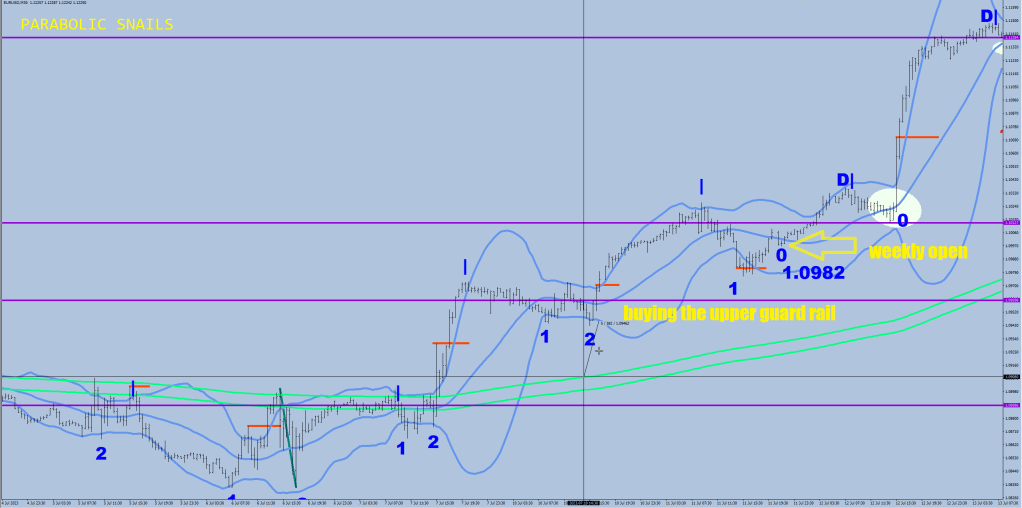
Before last week they overwhelmed the Dialect Response at the open with an aggressive buy, the market was already being kept out of the E9 Valley which is the 414 EMA band on the 30-minute. The valley’s limits are 1 fluctuation maximum away from the EMA band, which is 38.4 pips. That’s the measurement plotted between the Response and the Green River.
extern double FSize=32;
double FMax = FSize*6/5;
The future.
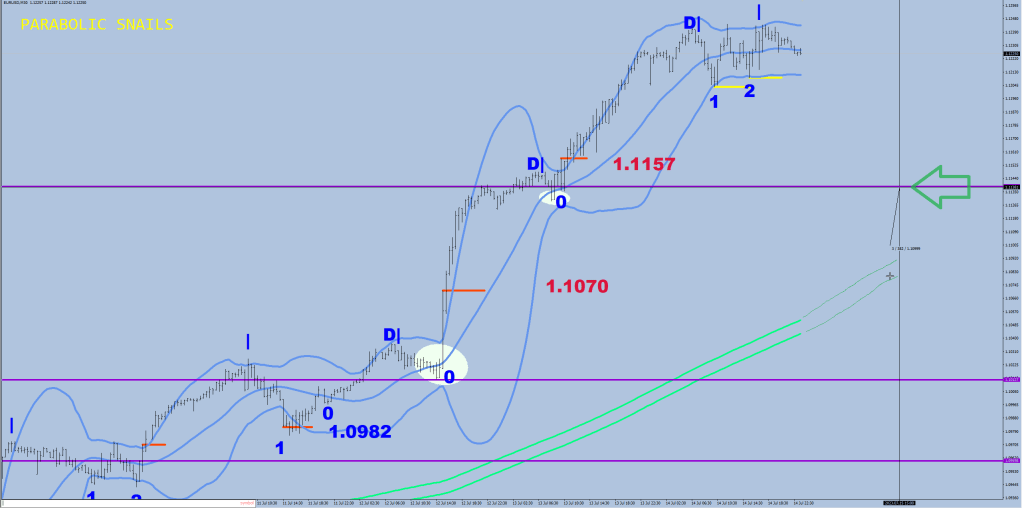
The most likely areas to be revisited on a “Mean Reversal”, are the Upper Guard rail, the Green River itself and the area below the Green River to the Lower Guard rail. These numbers would change dynamically, but I did plot where I think the rubber would meet the contact lense. That arrow is where the Upper Guard rail may arrive on Monday / Tuesday.
This guy is very good. If only he took a couple of lessons from me, he could be perfect.
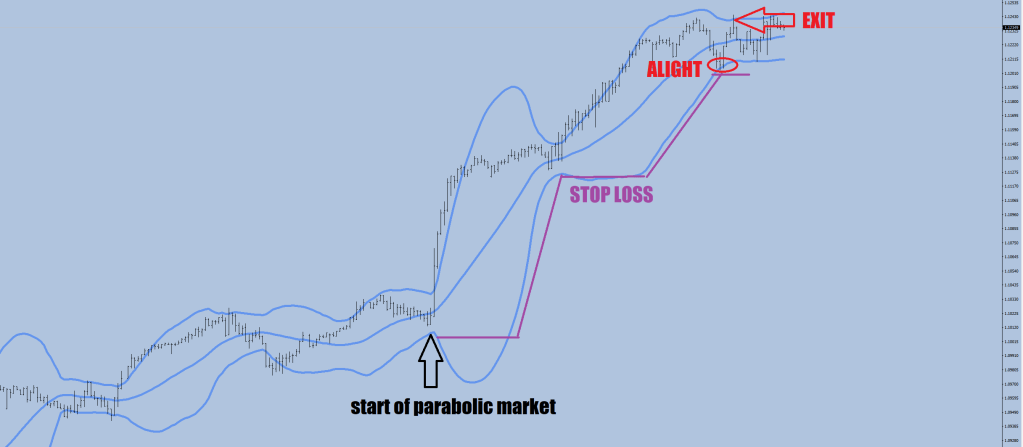
The idea has landed. I always use the stoplosses for codes to target something. I have never used the targets as codes to adjust stop losses until now.
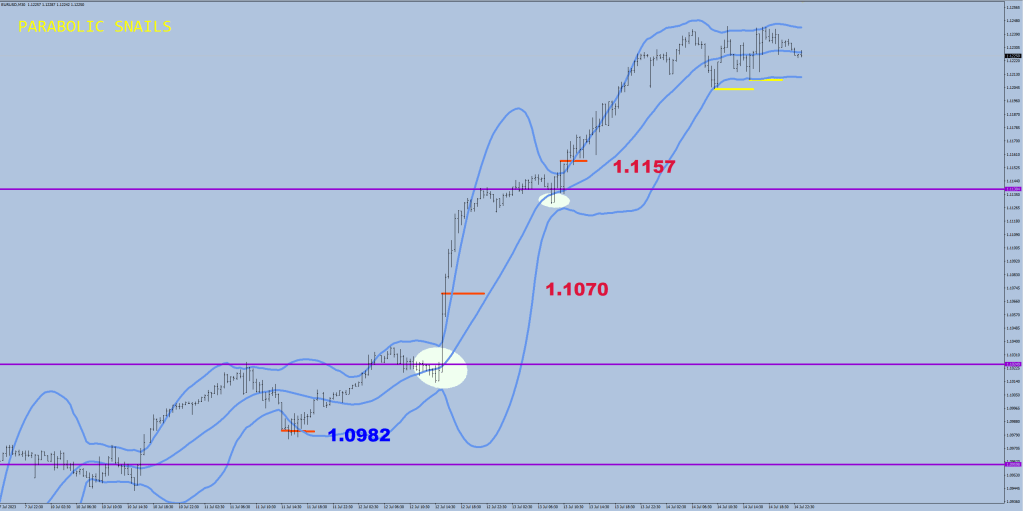
The thing about a parabolic market that it would alight before it wants to get off.
It is a sign of a parabolic move in itself that price does not touch one end of the 30-sample 30 minute BB. When it finally does, there would be one final hurray that is likely going to tag the other end one last time.
It is a rather differrent concept for me to dwindle on. Instead of cutting your position short, manage the stop loss at the right distance.
Keep away from the band by 10 pips and even out the bulges. First step is to feed the last 36 values into arrays.
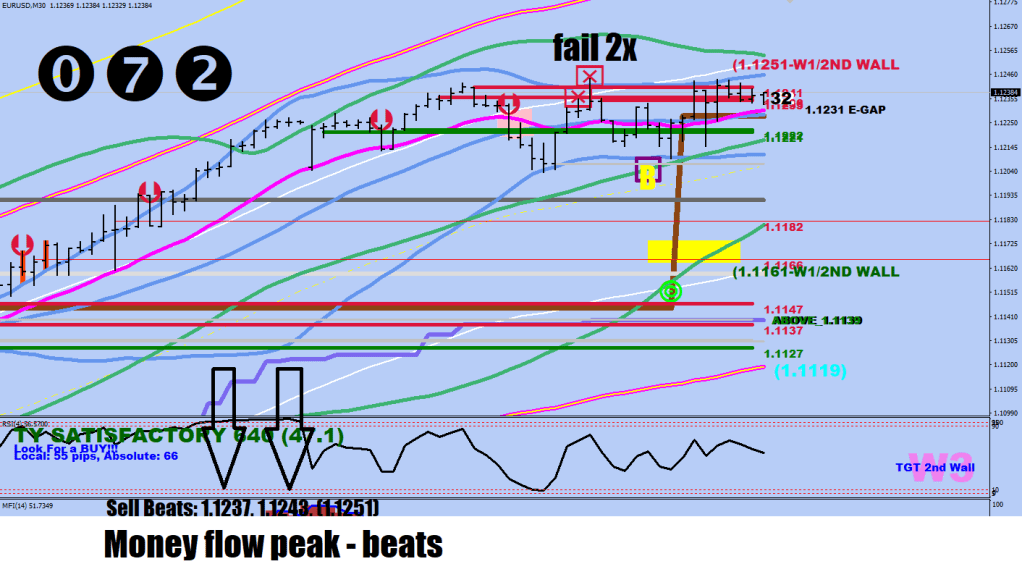
The Money flow beat projections do amount to something after all albeit the caveat is that the parabolic market has to make it ouside the BB like afore mentioned.
The 2x failure at the Stratosphere line does still mean something. The TY scissor is opened to 47 pips, that’s extra bullish. No move is likely to make it below the 9-day EMA band by more that 20-30 pips.
5.8x stretch from the mean still amounts to something (white line is 5x). A normal market would shy away by 4x. Even if it is opex Friday.
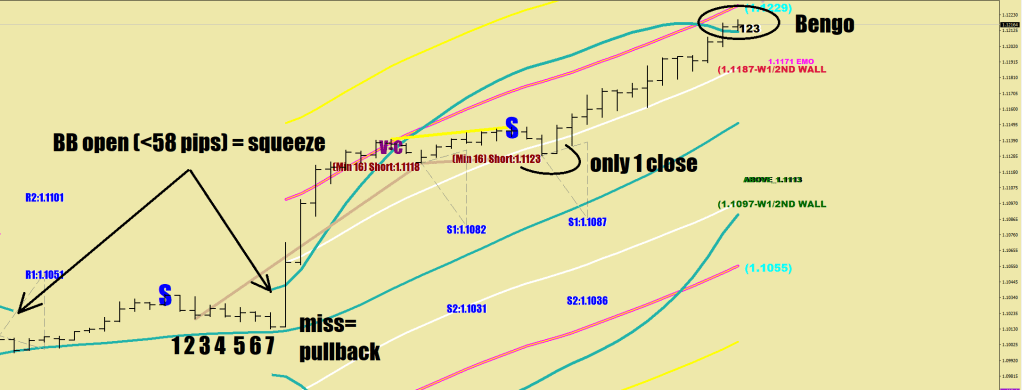
A parabolic market starts off with a 7hr pullback + squeeze, then stays outside the Stratosphere / 8 emo (max. 1 close over) The parabolic move would make it outside the 30BB.
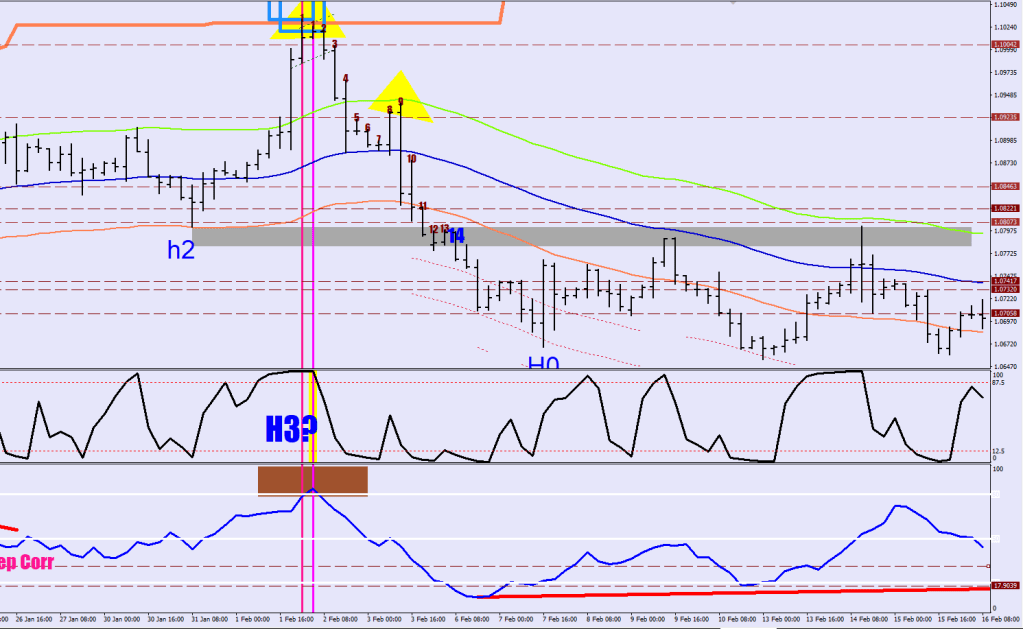
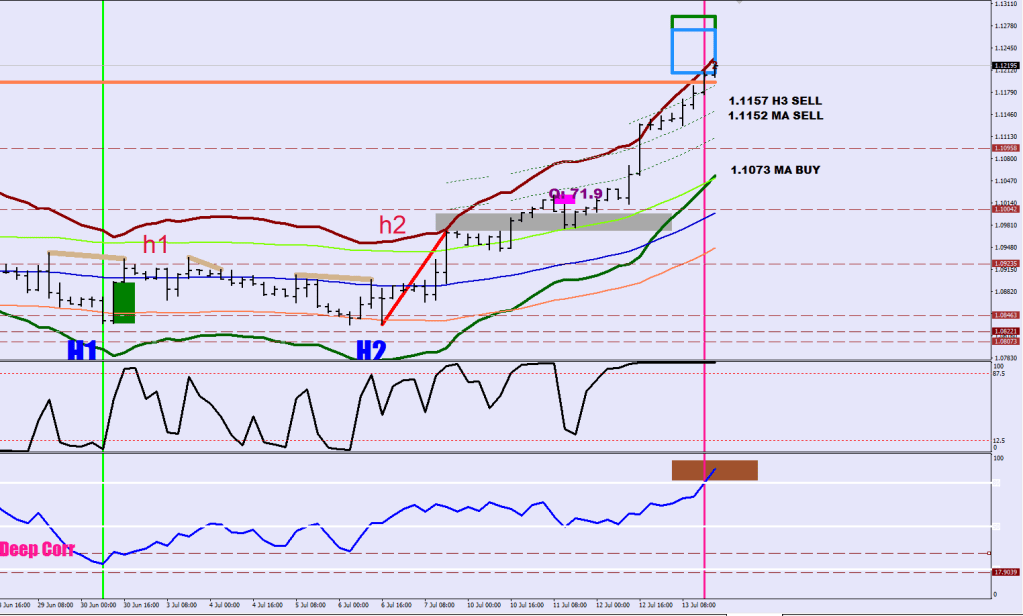
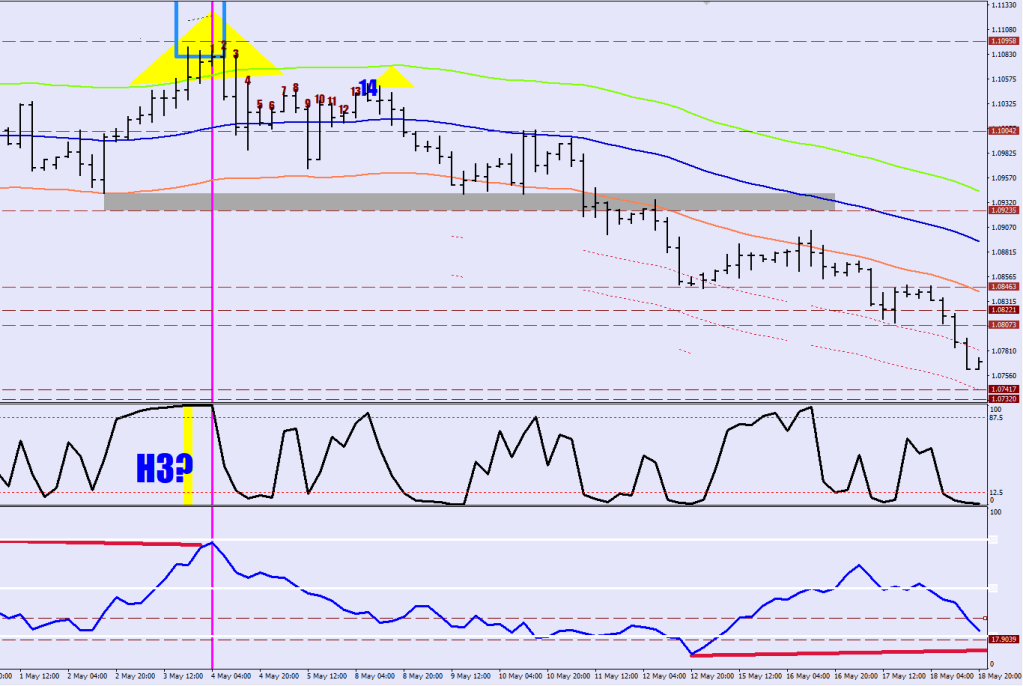
The market is going from powder box to powder box making H1-h1 H2-h2 H3-h3 sequences, where the h2 box either holds as a support, or it gets broken. The first hump after the back tedt gets a H0 count. The initial penetration starts a counter. If 14 manages to keep out of the box by more than 50%, you are home free. If 14/15 makes it over 50%, a continuation in the same direction is expected – from H3.
A quick drop away from the powder box is a mean reversion to E9D.
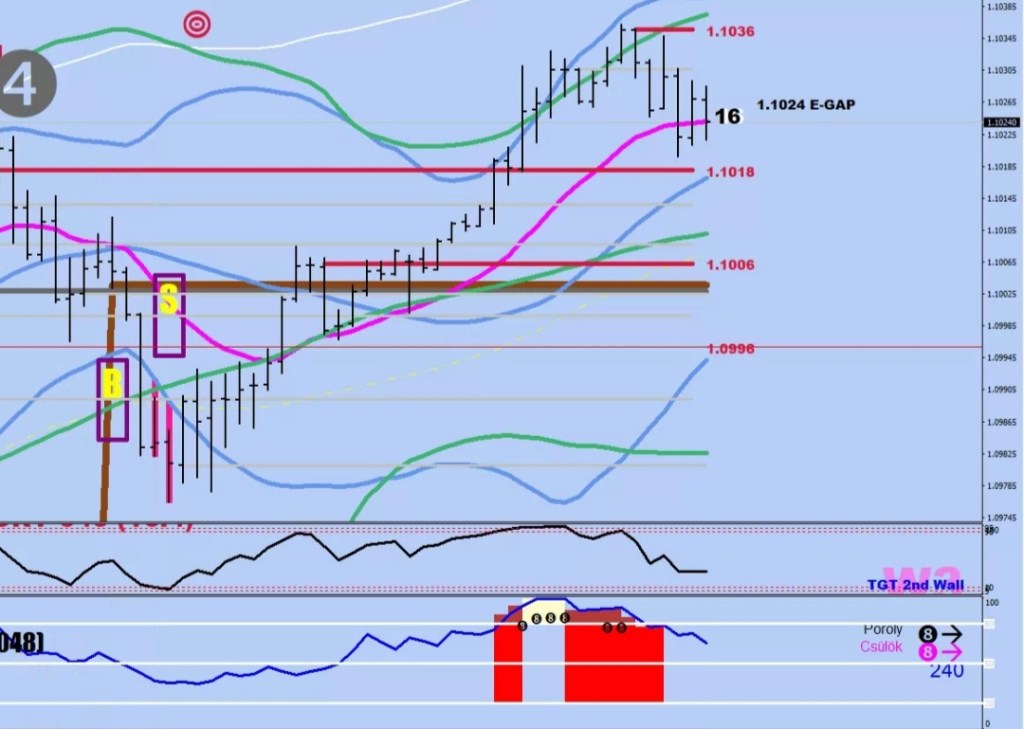
Tie Machine has the MFI peak beats at 1.1152 & 1.1158.
Axel H has the Ionasphere breach pointing to 1.1160
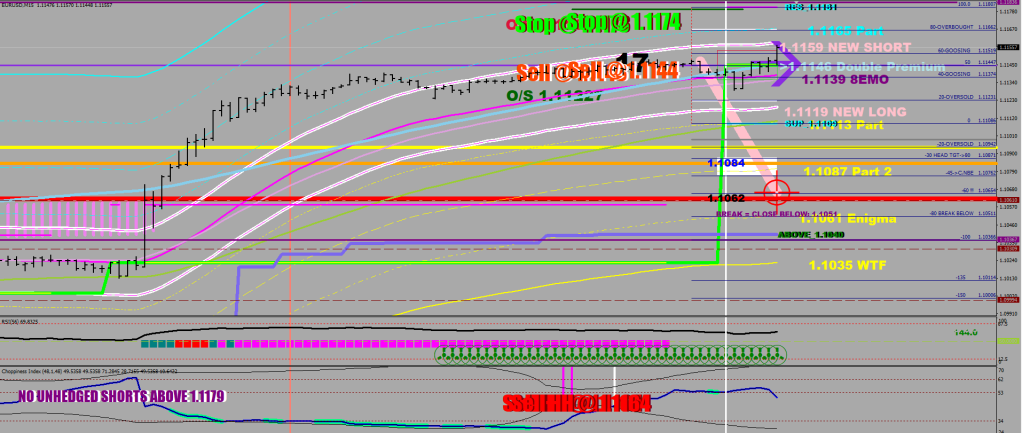
The CI rabbits mark up the range of 1.1144-1.1174, usually the peak comes in 6-8 pips of the outer number. There is also a 1.1164 HH sell call
The divergence lines show a started reversal divergence in yellow, and we are adding another point to the line.
The Quarterloo weekly plots show a white lie (white palm) over this breach above the megaphone and the brown trendline. Should get a close back below by the end. R3 came in at 1.1148.
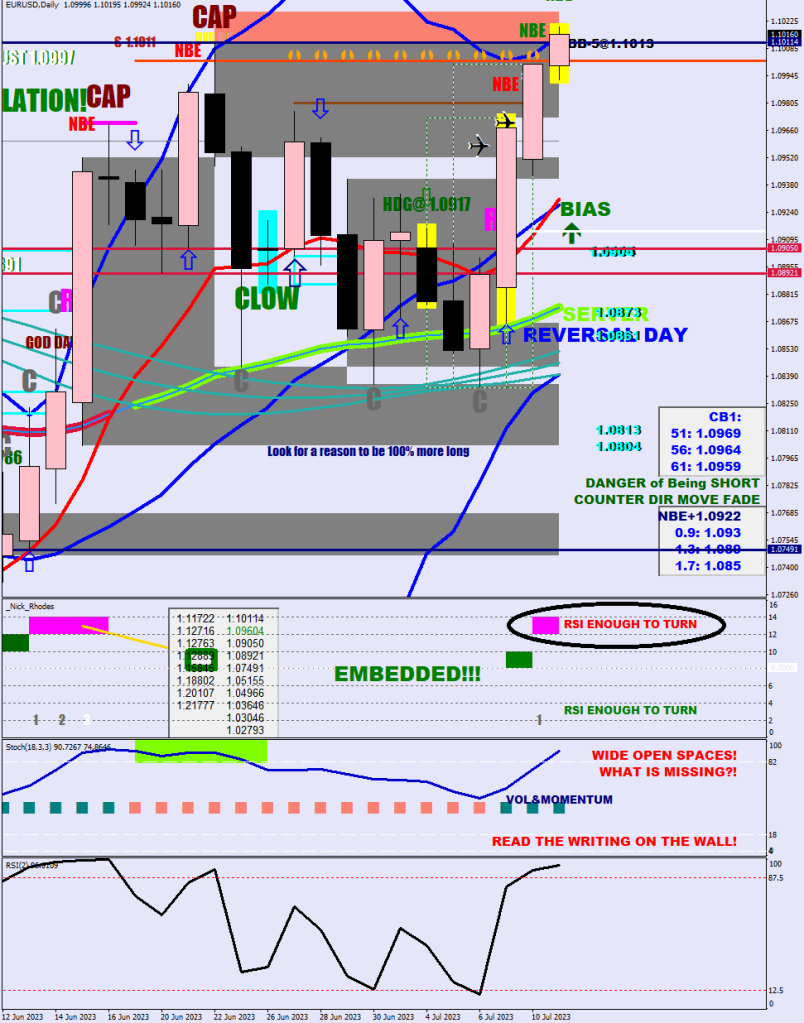
The daily shows a hearty attempt to catch up with the bottom of the uptrend from the bottom.
We all get biassed by others, so we must come up with something more reliable, something close to black and white.
So what tools am I proposing for this reason?
RSI2 HL2 hourly to start the counter.
Second thing is clear definitions in your head. A pullback that has low volatility and never makes it beyond the hourly 30 SMA is a pullback, evren if it looks like an ABC structure.
A correction thus would get to the other side of the nentioned barrier, providing us with the first check point.
Not a correction.
A move to the other side of the S30 in 7 hours is a break out preparation (Score), with a count down for a follow through by the 11th hour.
This ABC correction was a loneliness kind though only lasted 8/10 hours (see first image) versus the common 14-16 hours long one.
Here’s Pippoletto elegantly and smoothly identifying the entire ABC correction as an A leg down. I’m sure, Mr. Fifonacci was there to back him up on this.
Looks on one time frame may not be enough. All the Elliott zombies of the world may not be enough.
My mind was elsewhere, I was trying to find a liquidity break instead of evaluating the correction properly.
The 2x 30 min disconnection was lot followed by an RSI4<10 and an RSI4>10 for a liquidity break call.
No liq. Brk, but MFI went off the charts.
The point is, you do need the right indicators, the ability to count and the knowledge of what is what and when.
Hello junkie sweetheart, open up the floor and shout it out…
Alphaville is great. It never had the issue of not up to par lyrics. This is an article for noone.
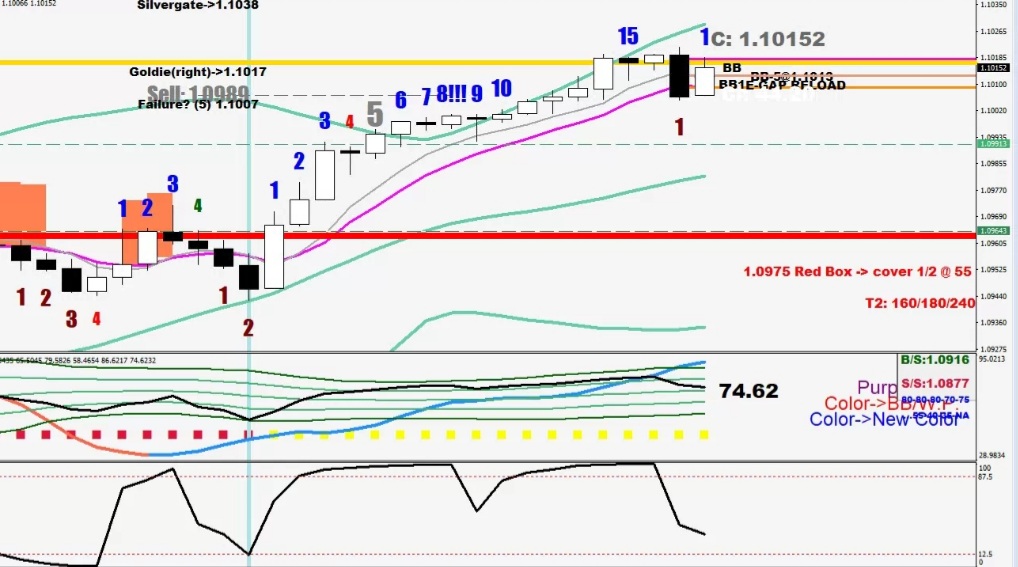
One feature of an ending tail may be 15 hours of selling / buying with the 15th hour still making some progress. By this I mean.closes on one side of the 8 EMO.
To me it was a revelation that time picks the level.
So, what works and what doesn’t?
T3 alone was a miss.
I screwed up a filter value by 1 point to back up a false premise. Curve fitting.
Yet, if we apply the 15-hour metric and the back to back Stratosphere failure evidence to a money flow peak-beat, no we are onto something.
X-X
My head is in the gutter, but I’m smelling fine – can you taste the difference between populist contentful writing?
Coherent, well composed things are hard to make fun of. It feels like a rape, a disrespect.
A parody of something funny just underlines the fact that it was a laughing matter to begin with.
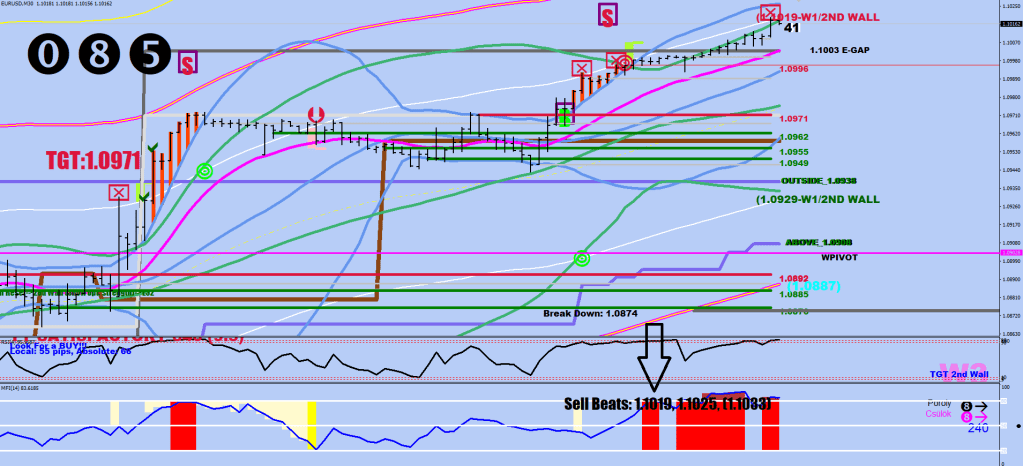
MFI beat to be exact. By which I mean MFI divergence. The size of the beat is coming in at 8/14/22 pips + abated MFI strength relative to the reference point.
It is important that the reference 14-sample 30M MFI is made with an overbought/oversold 120-sample stochastic reading.
The dark gray line is “darko”, a fluctuation-size displacemet of the gainsboro T3.
How do you know which one of the 3 numbers would be ultimately right? You don’t.
You need to cut your directional holdings that are in gain, balance out the rest or – if you don’t have any holdings, go in with your normal size at 8 pips, add some, say another 20% at 14 pips and add some more at 22.
…
1.0995 got called too
had to change back one value to correct this issue
if (mfi[i+12]>mfi[i+13] && mfi[i+12]>mfi[i+11] && mfi[ArrayMaximum(mfi,3,i+11)]>mfi[ArrayMaximum(mfi,23,i+15)] && mfi[i+12]>79 &&
No print on the precious red is the difference.
The concept is great, but the calibration may be off as you can see.












 ForexFore - Internals, indicators, algorithmic trading