This top seems to be the mirror image of the bottom at this point.
They lubed up the selling at the S-30 (cyan).
Now, here comes a conspiracy theory.
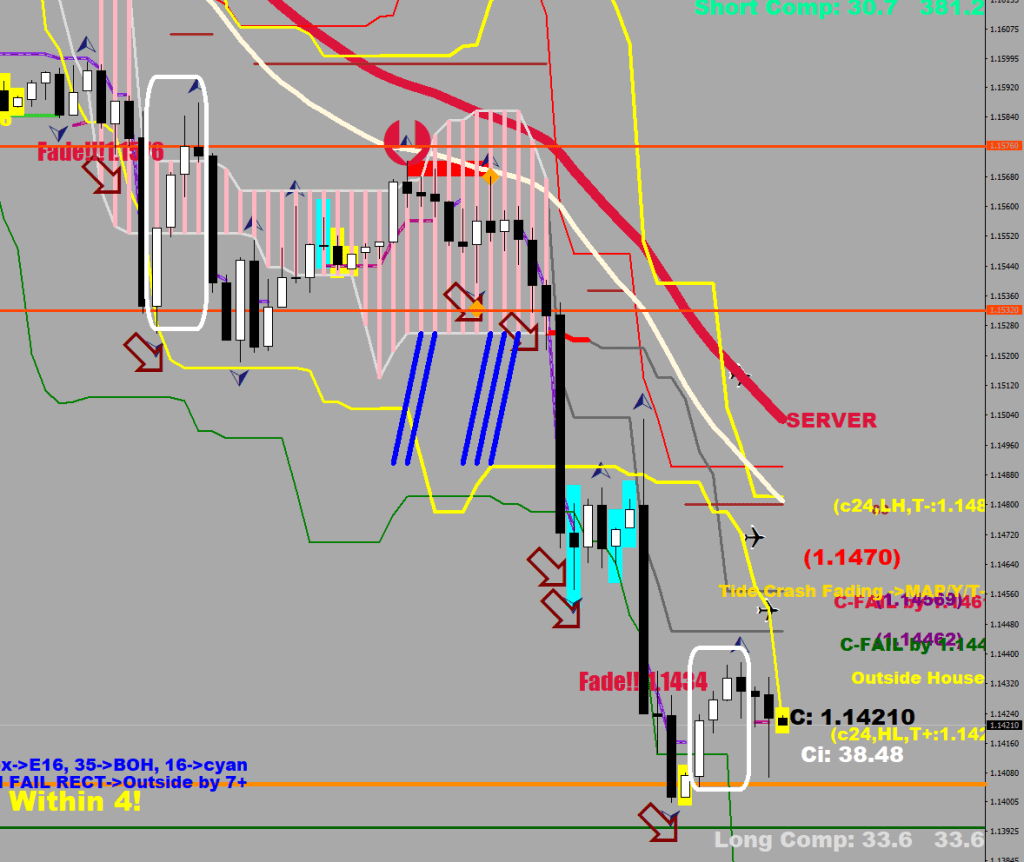
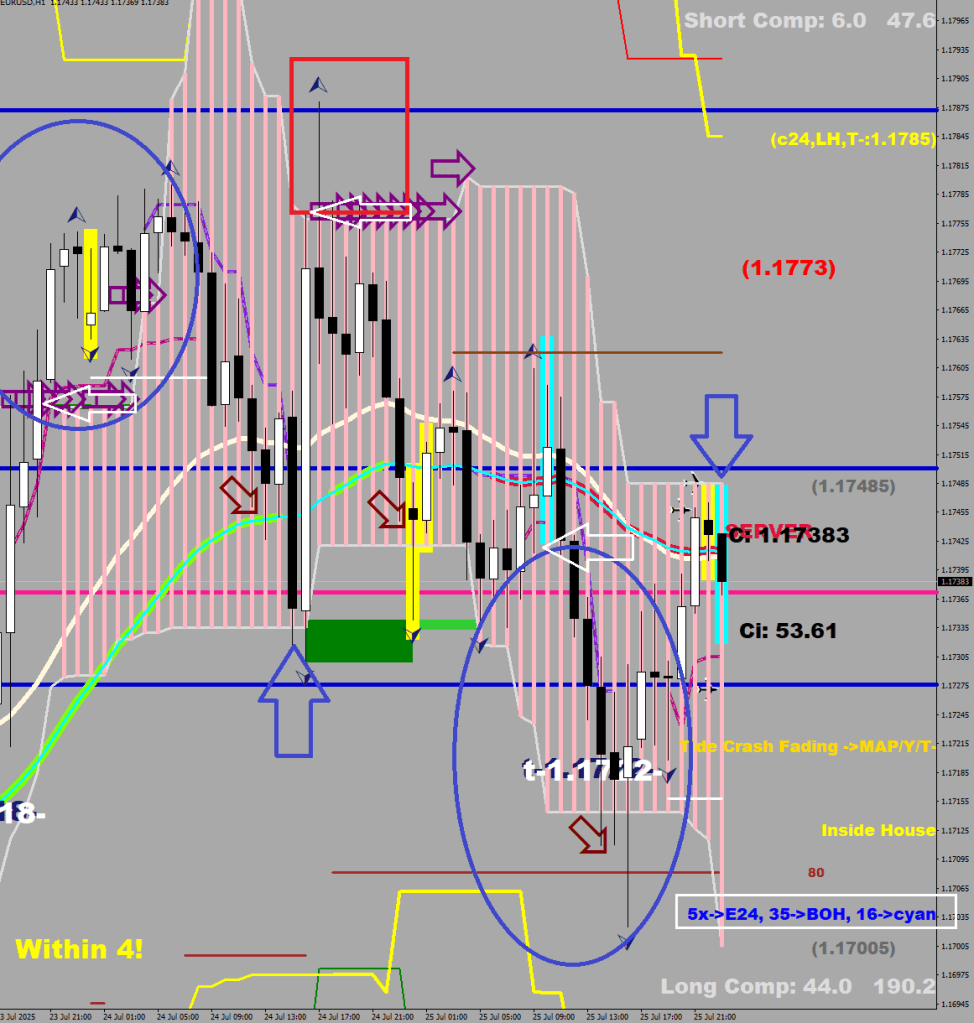
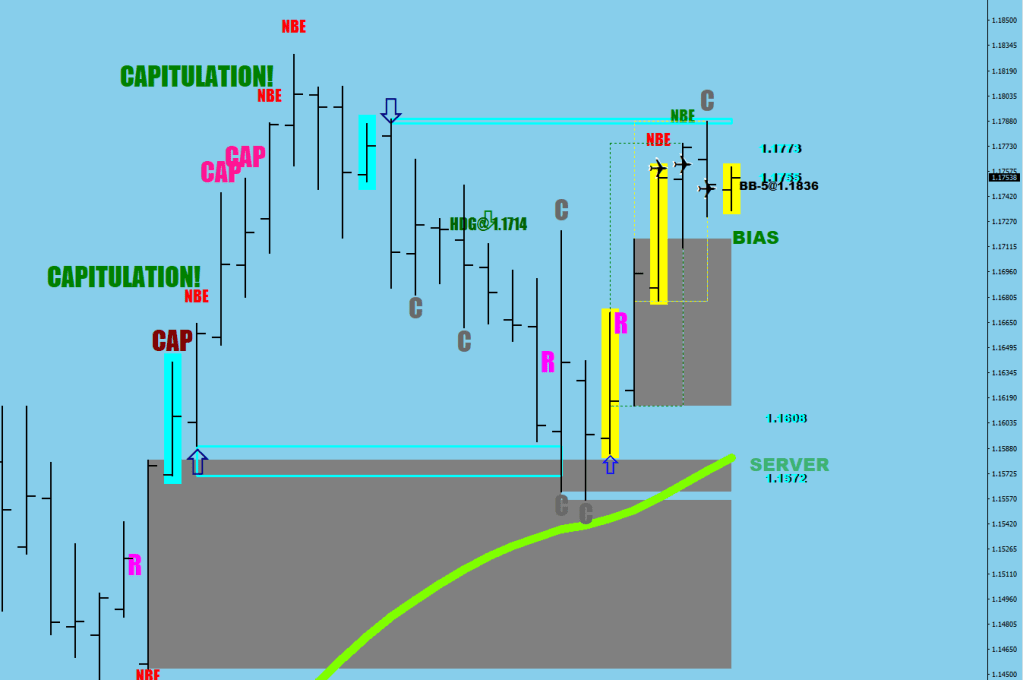
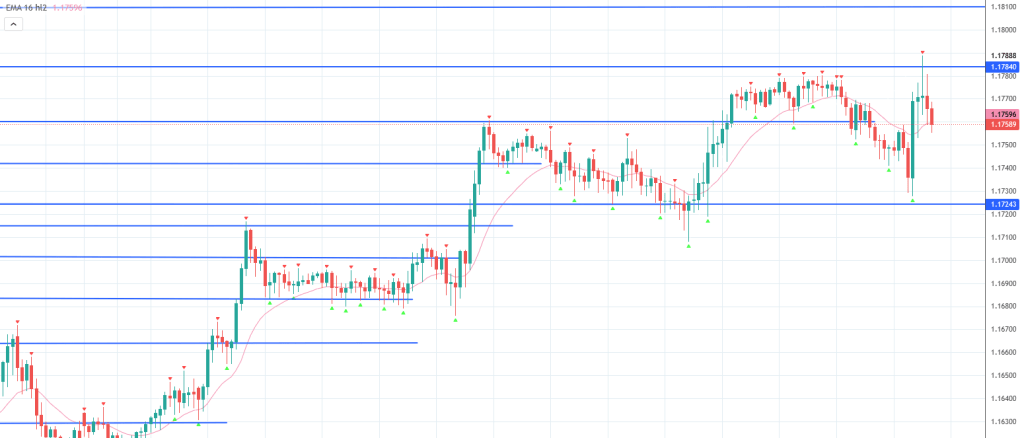
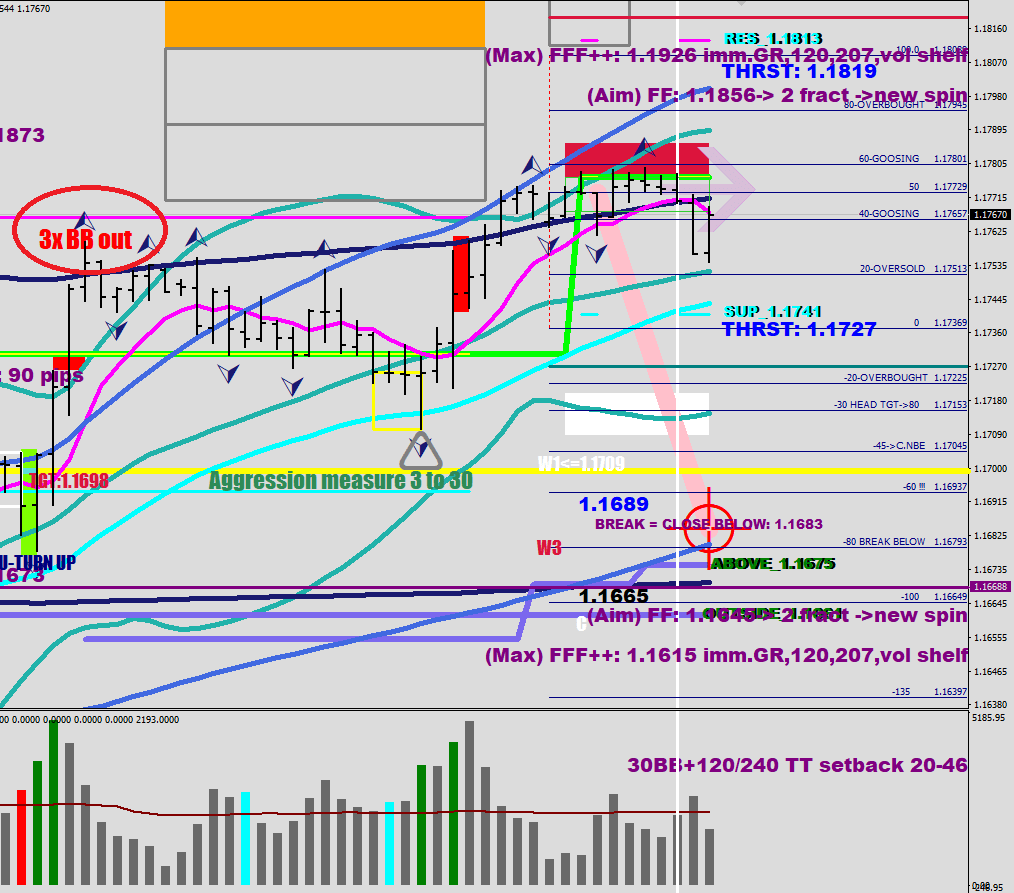
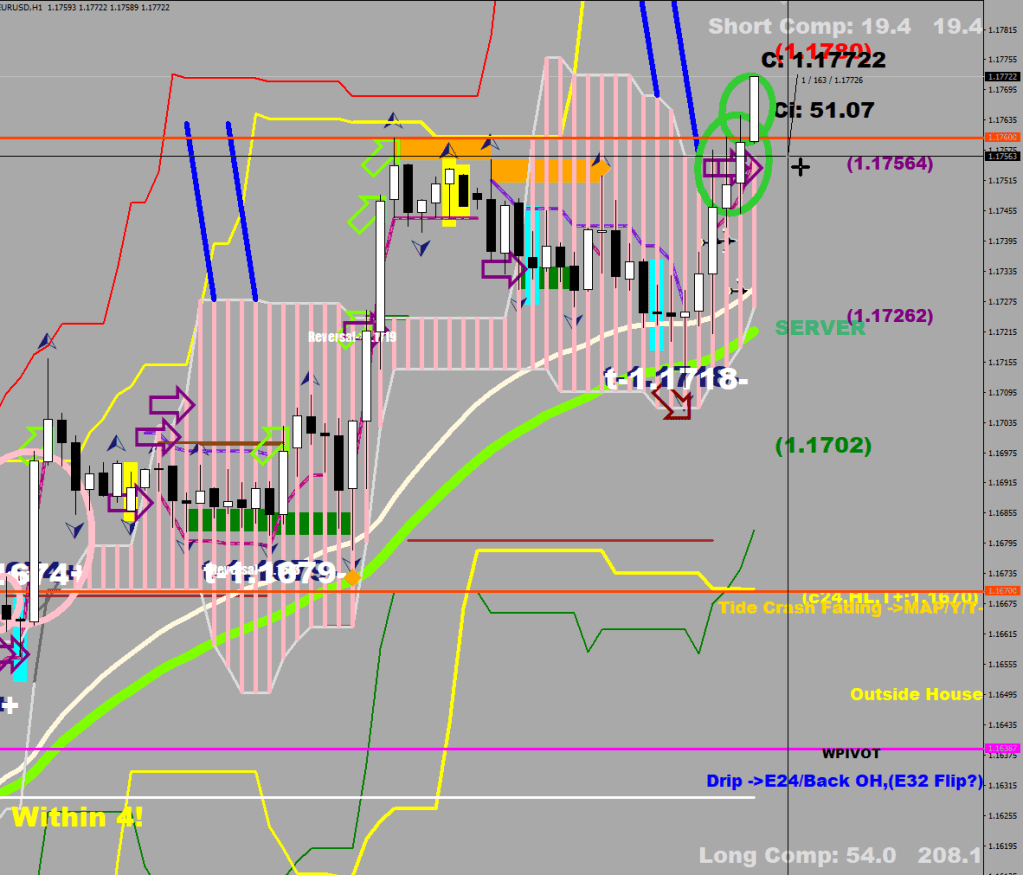
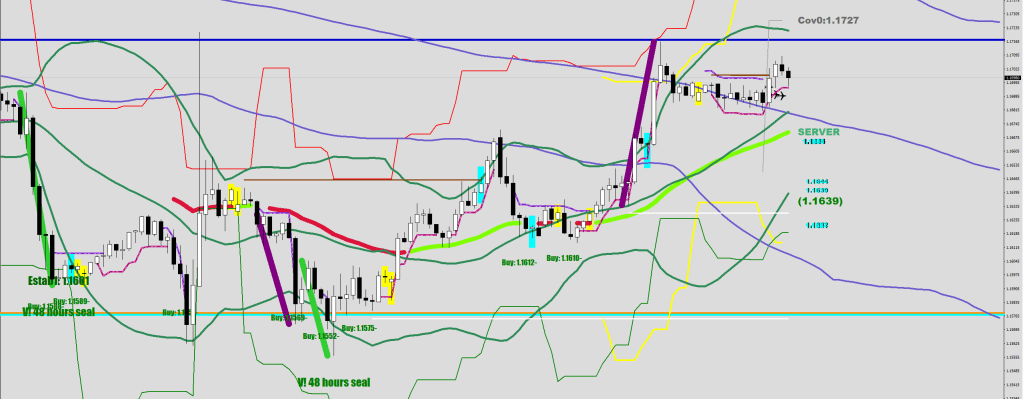
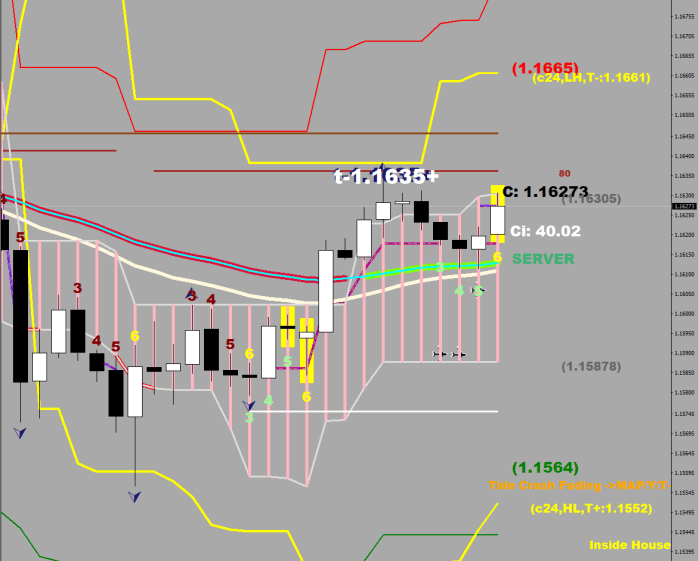
There are breakouts and fakeouts. In the following image, the two blue ovals are breakouts at the edge (/prior edge) of the house. The red rectangle is a breakout failure.
I put a white rectangle around what I think is the matching counterpoints for 3 different breakouts.
The left oval had a 16-pip breakout. When the price came back, it went past the Back Of House, since it went for the Cyan, pro volume candle.
The right oval was a 35-pip breakout. It came back to the BOH for a near miss.
My theory is this: on the way up, the volatility was getting downgraded. 55+ pips, 35+ pips, 16+ pips & a fakeout. On the way down, the volatility should grow. If the A leg managed 35+ pips, the C should do at least 55 beyond the current or a prior edge of the house. 1.1714-(55+ pips) = 1.1658 or so.
Also, once 50+ pips were reached, the market could get another instant drop after a bow-back graze of the E-24, like so:
What comes after 50+ in the sequence? 16 again.
Note how the house also moved down quite a bit. Also, you want the house to be upright.
ExtUpperBuffer[i]=iLow(symbol,0,iLowest(symbol,0,MODE_LOW,12,i))+460*Point;
       ExtLowerBuffer[i]=iHigh(symbol,0,iHighest(symbol,0,MODE_HIGH,12,i))-460*Point;

if (ExtUpperBuffer[i]>ExtLowerBuffer[i]) {ExtUpperBuffer_[i]=ExtUpperBuffer[i]; ExtLowerBuffer_[i]=ExtLowerBuffer[i];
The house is the 13-hour low plus 46 pips and the 13-hour high minus 46 pips.
There is one level at 1.1664 and one at 1.1630.
Guest voices on Album #80
Brendan Perry (Dead Can Dance)>
David Bowie>
Mylene Farmer>
Neneh Cherry>
Paul Chernoff died in 2017. He used to talk about how he inherited his brain from his mother, who seemed to understand when he was telling her about quantum mechanics. Paul usually arrived late for the daily specials.
Sherwood Parker died in 2018. He would be in most nights calling in ahead of time, either a Chicken Broschette or a Nicoise. He used to ride up on the Oakland hills on a bike. He would disappear every once in a while to Switzerland, the CERN particle accelerator.
Ed Monroe used to have a brunch date at 7 AM sharp with a realtor lady. He used to live in the Biotime warehouse where they keep the cryogenically preserved people upside down in drums. He liked my poems. Black coffee, 2 eggs, toast, and anything else at a great discount. He has an Instagram with his artwork.
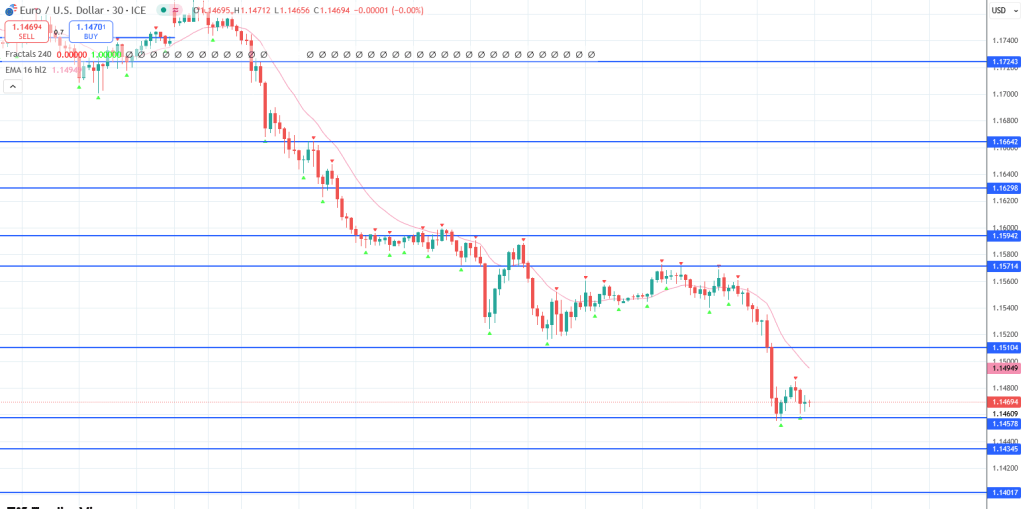
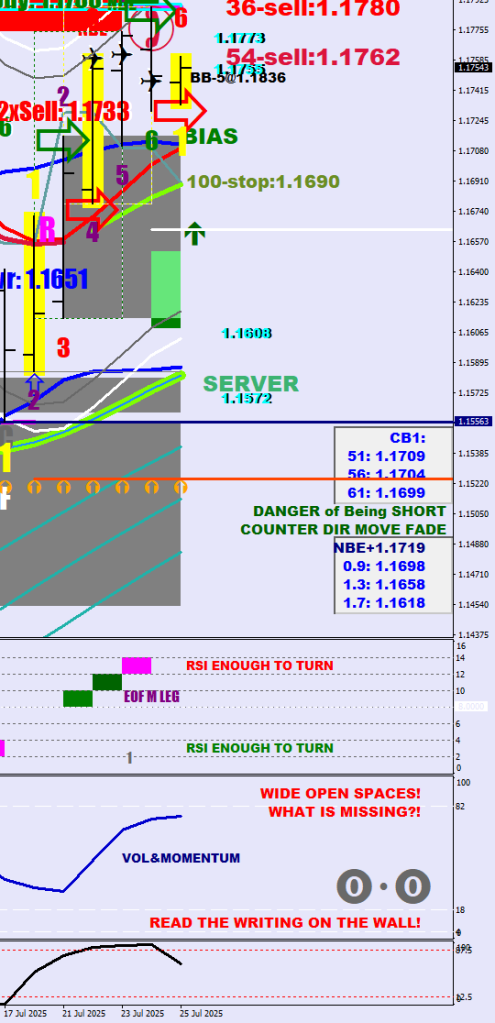
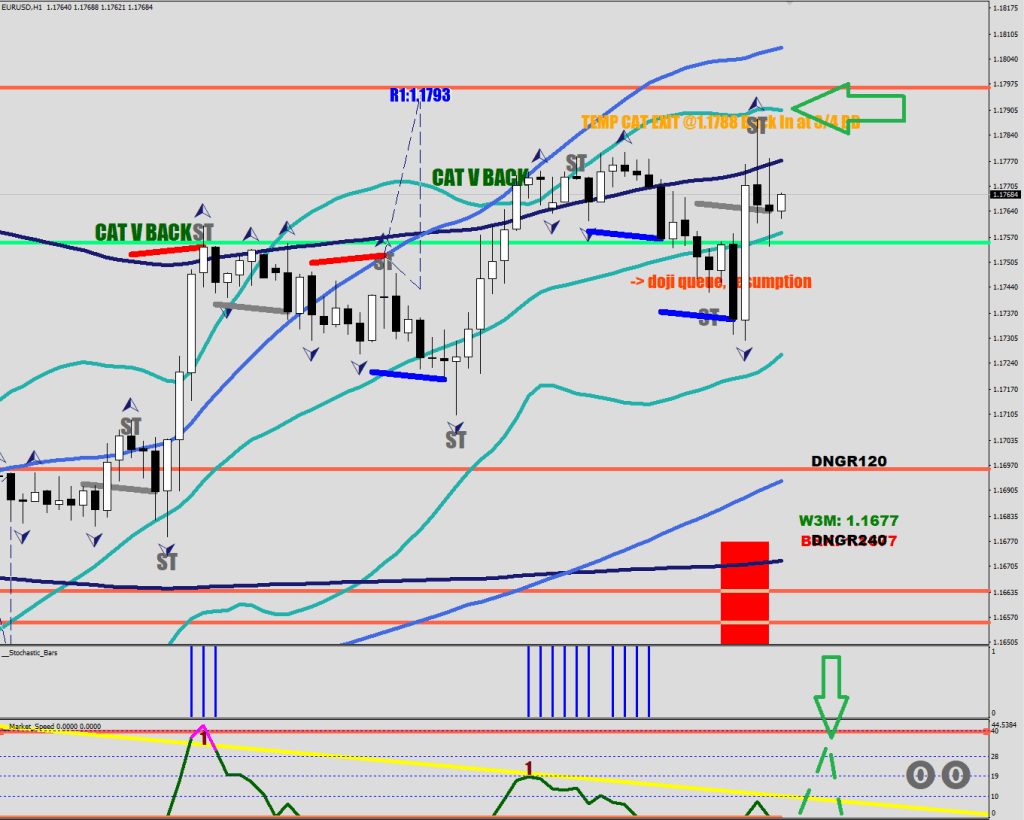
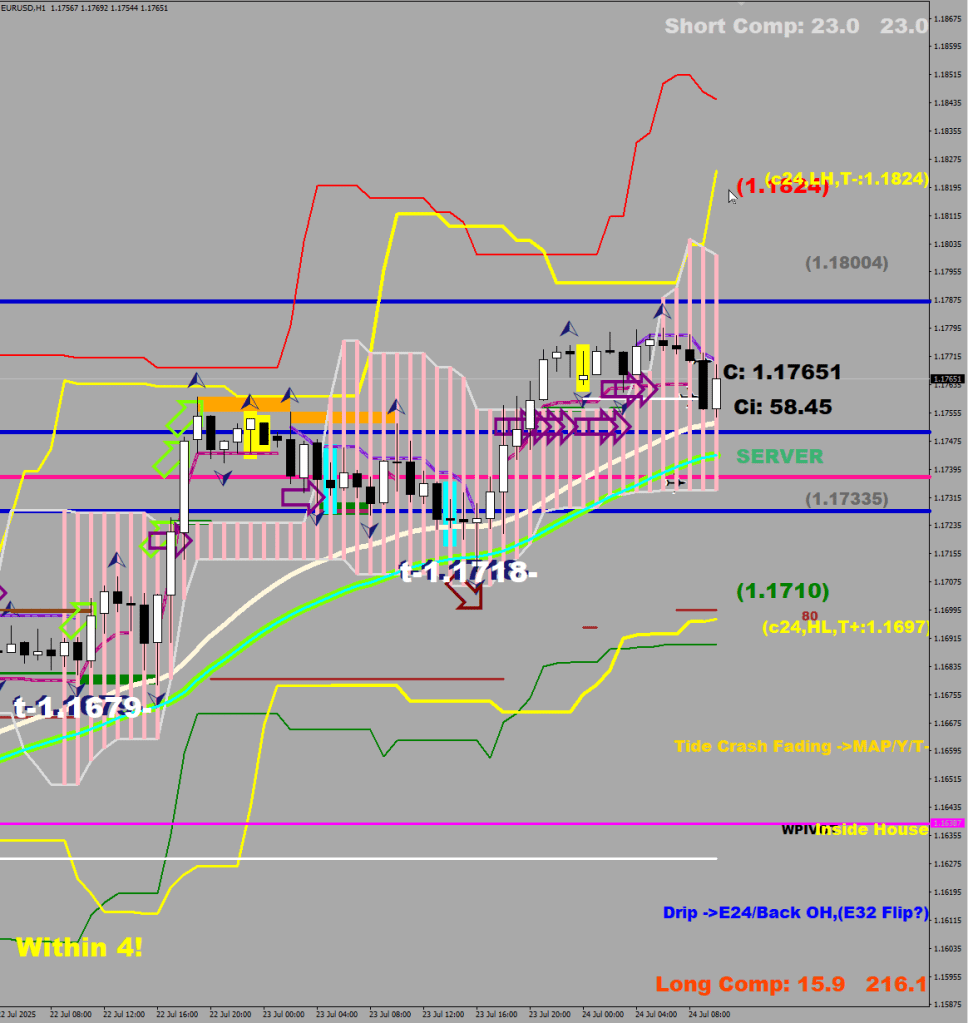
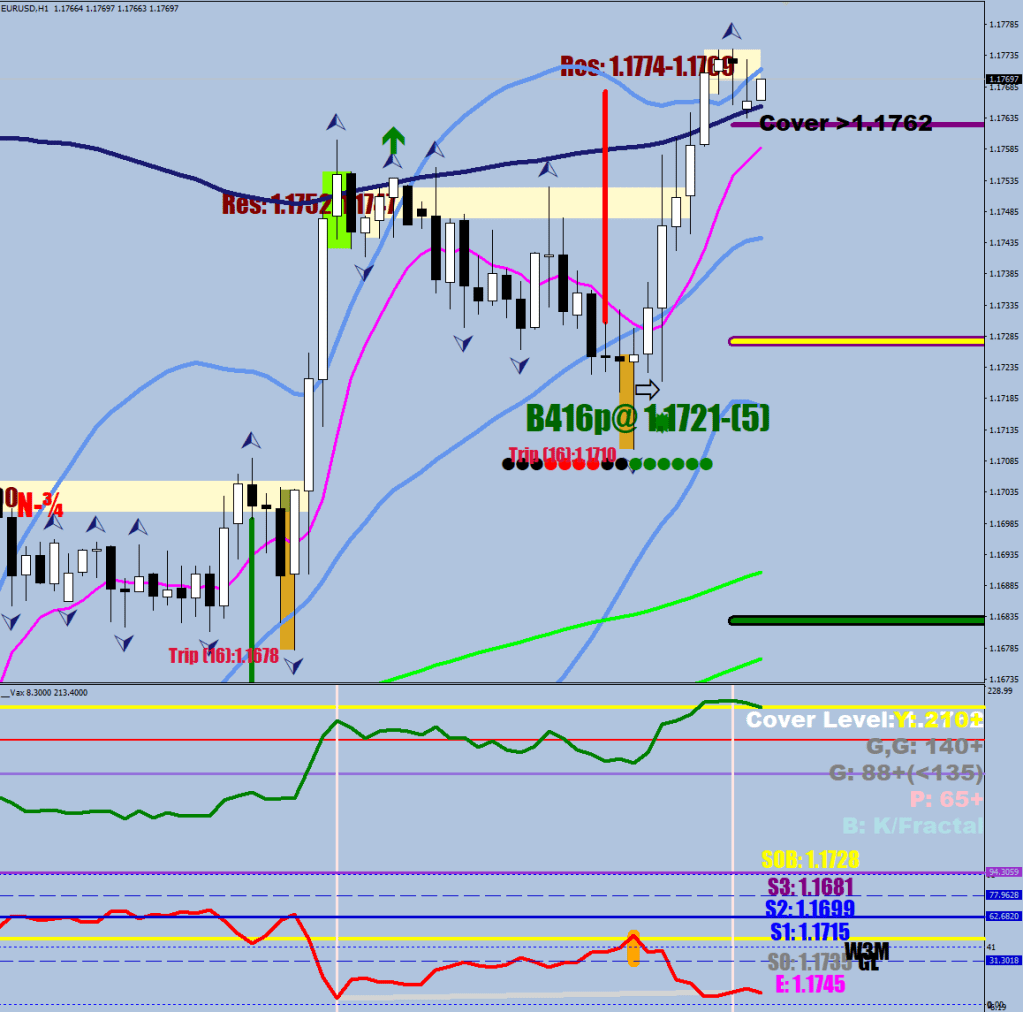
The story is a time-out. A momentum slip (see stochastic bars). An end of an M leg (Measuring).
A stall at a Pro volume block (cyan).
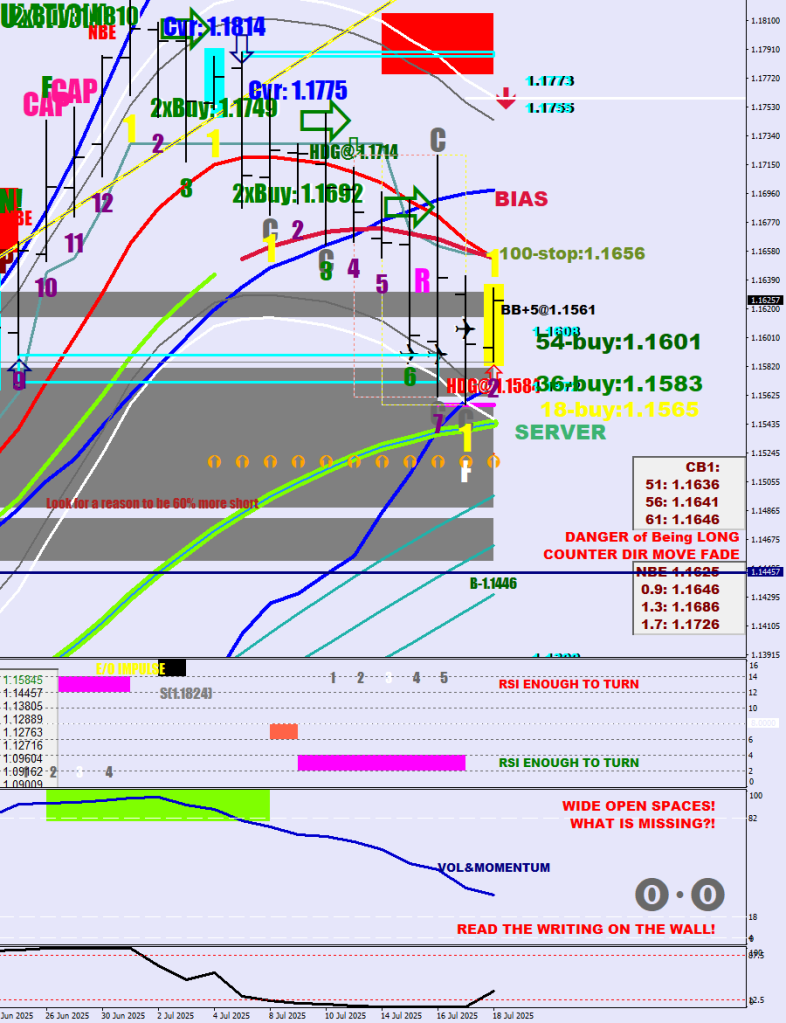
This weakness may escalate, so my current plan is to short (/cover longs) 7-10 pips shy of the 60-sample HL2 BB on the 30 min. See below the fractals constantly missing the upper line.
Despite the fact that when the large structure is over you would see a volatility whip (in white) that would usually tag the Bollinger band one more time (1.1848+ currently).
High volume hourly prints are a great clue. Can you see the projection lines and the result of the interaction here?
Note also how there was no momentum (Stochastic Bar print) on the last pending fractal print (higher high).
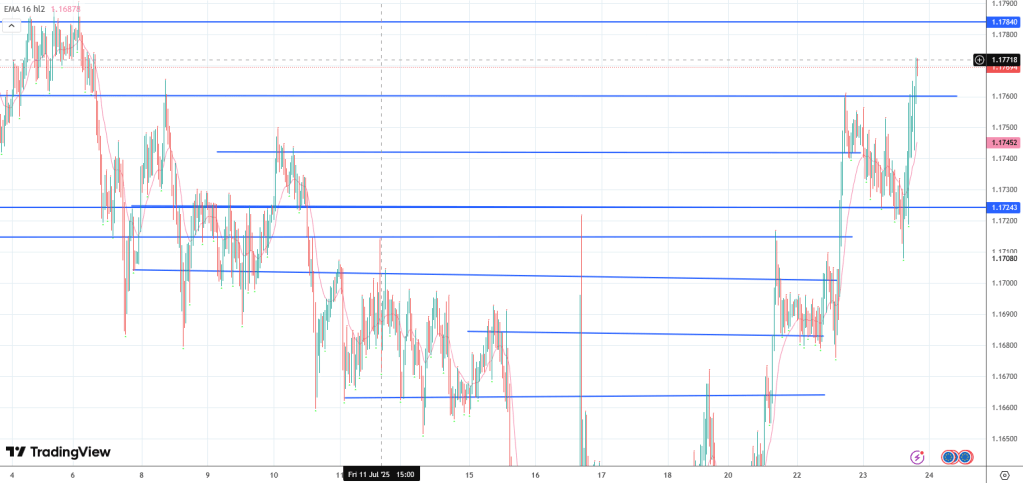
The levels you map beforehand.
I was asked yesterday early morning about what the EU would do next.
I responded with 3 lines.
Top’s not in.
Low 1.17 first.
1.1784 could be EOF W2.
A thrust on the upside would take anywhere from 2.5 hours to 5.5 typically. I don’t acknowledge the move below 46 pips, and I have a 57-pip minimum for a top to be considered as a colored plot and 84 pips to be instantly called a closed top.
The movement has not been overwhelmingly strong. The fact that after the new fractal print, the following candle managed to get below the 8 EMO hints that this is going to be a yellow divergence, meaning not optimal length of separation.
There are 30 more minutes before the new fractal will be advanced on the hourly. In 1 hour and 30 minutes, it can still be voided and the 2-hour timer restarted.
…
The breaches are still missing. The breach of the market speed trendline, and a high that manages to go outside the 30-sample BB.
I can’t yet call a top.
By the way, here’s the gray volatility divergence that was plotted at the bottom.
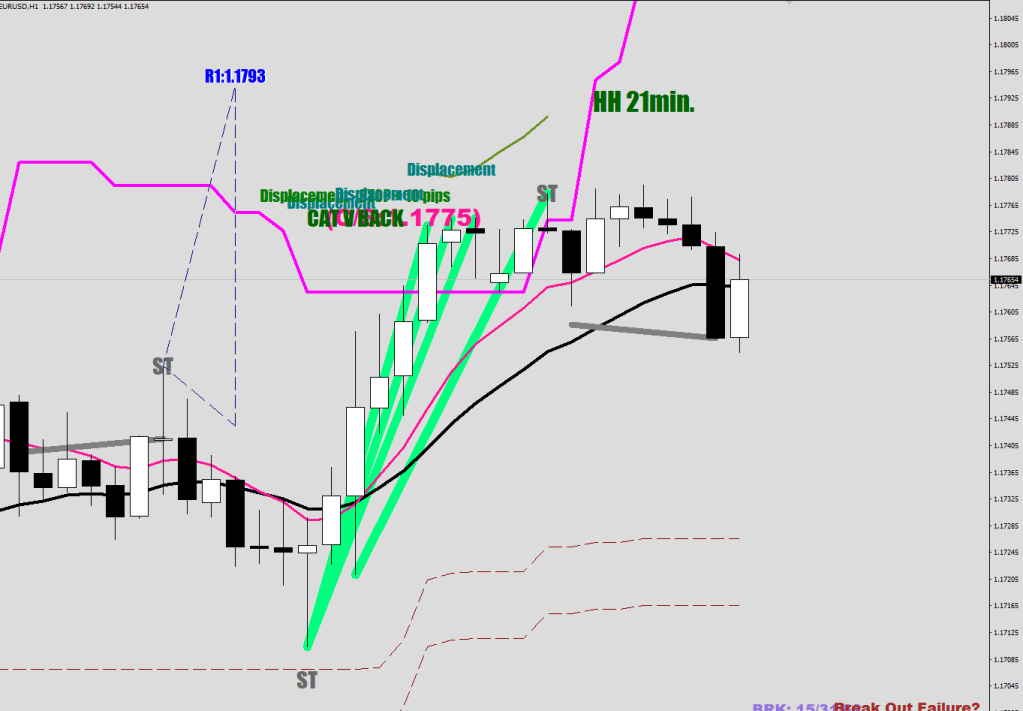
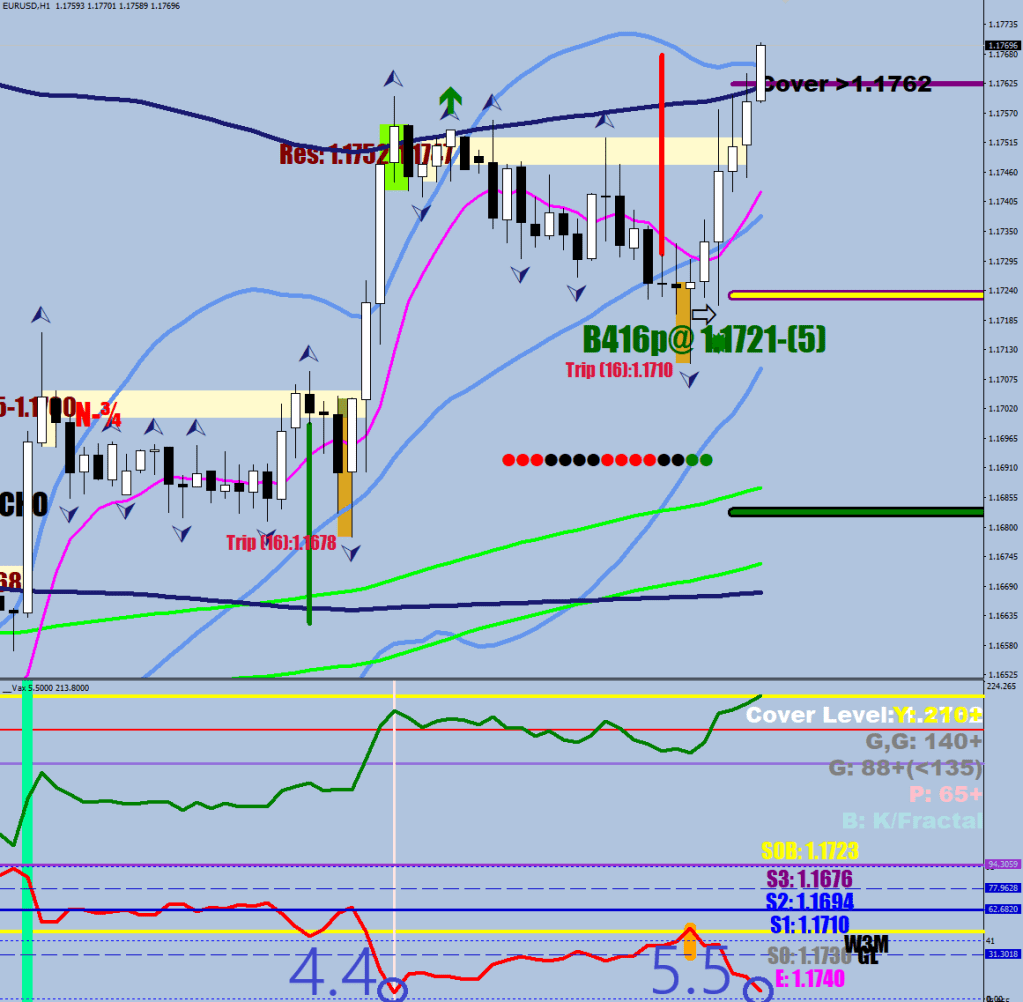
If you are curious how the system responds to a blank shot like today’s, it calls it another HH. 21 minimum is the pips of pullback before proceeding.
The previous swing high printed a volatility compression anchor at 4.4.
Now you need a higher high with a divergence. 5.5 will do.
For a Gray divergence, you simply need the next hour with a lower high that stays above the 8 EMO (Magenta).
At resistance, for sure.
What is .11773 famous for?
The pro volume daily candle’s close.
The first house break had a 55+ pips rally. The second had a 35+ pips rallly, this one has a 16+ pips rally, making it a double divergence.
A Wave 2 from hell (deep, deep retracement), but still a Wave 2.
Update after the print:
With the new high this hour, the Vax print is now at 2.5.
Which means, if this candle settles on the high, there would be no more divergence; instead, the volatility compression anchor value would get updated.
…
Evolving situation, the June high is now within reach.
W3M is at 1.1823. On the bottom, you can see the double divergence on the Market Speed indicator.
A thrust for a finale and tomorrow’s heavy news, stochastic embedding, all-out buying – CTA style compression…
Not a gray divergence. Gainsboro. Not the final high.
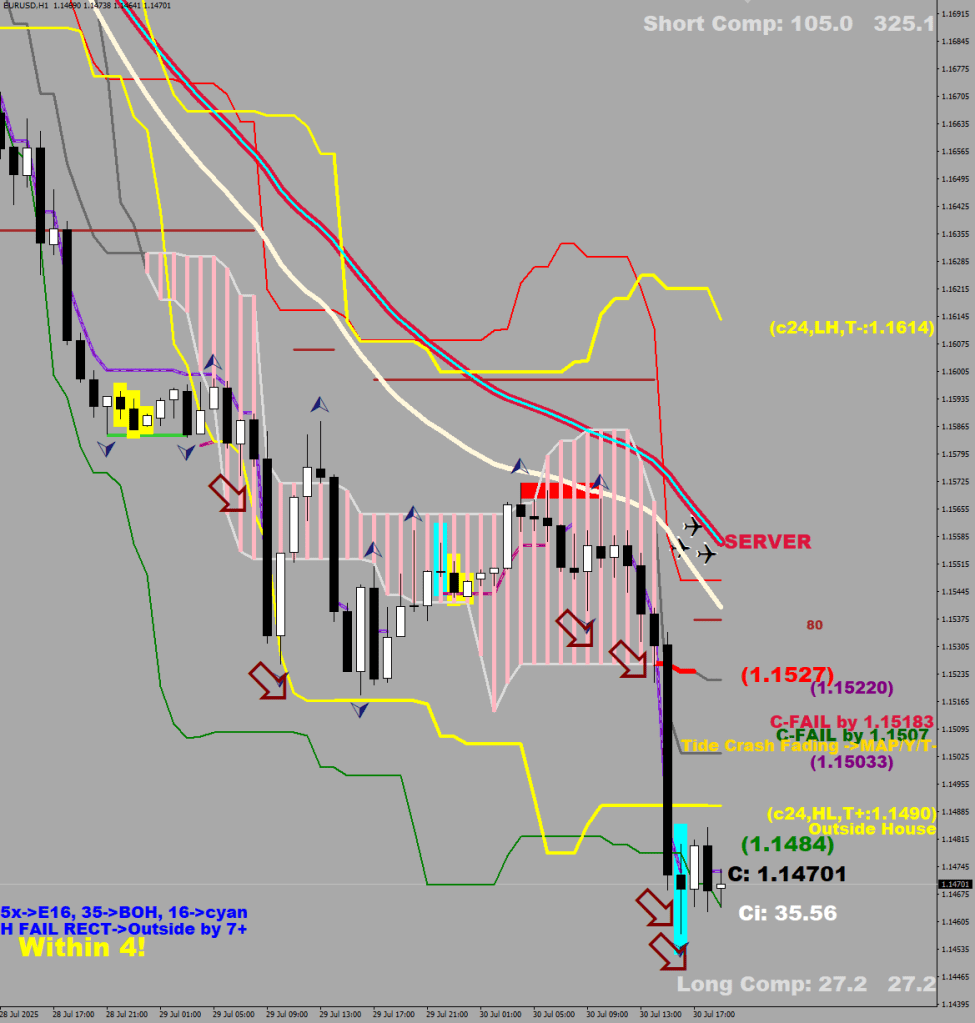
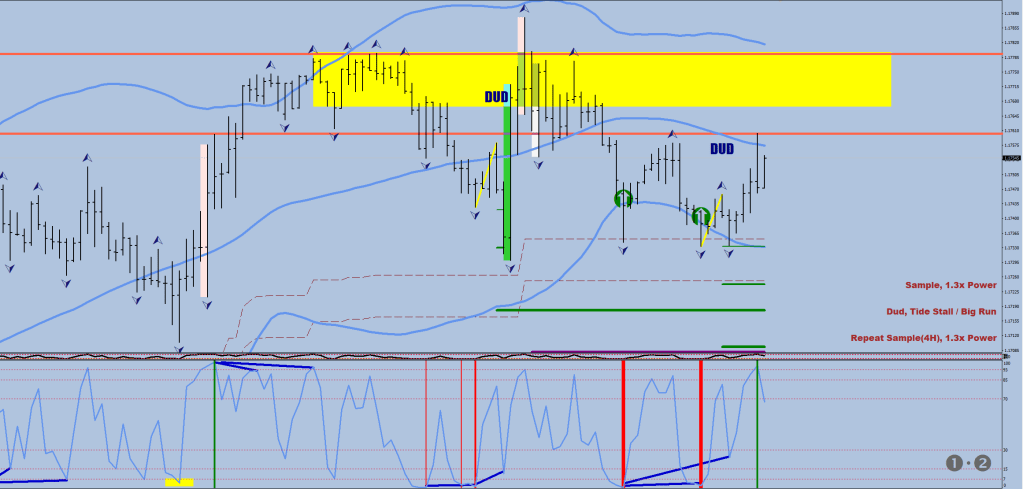
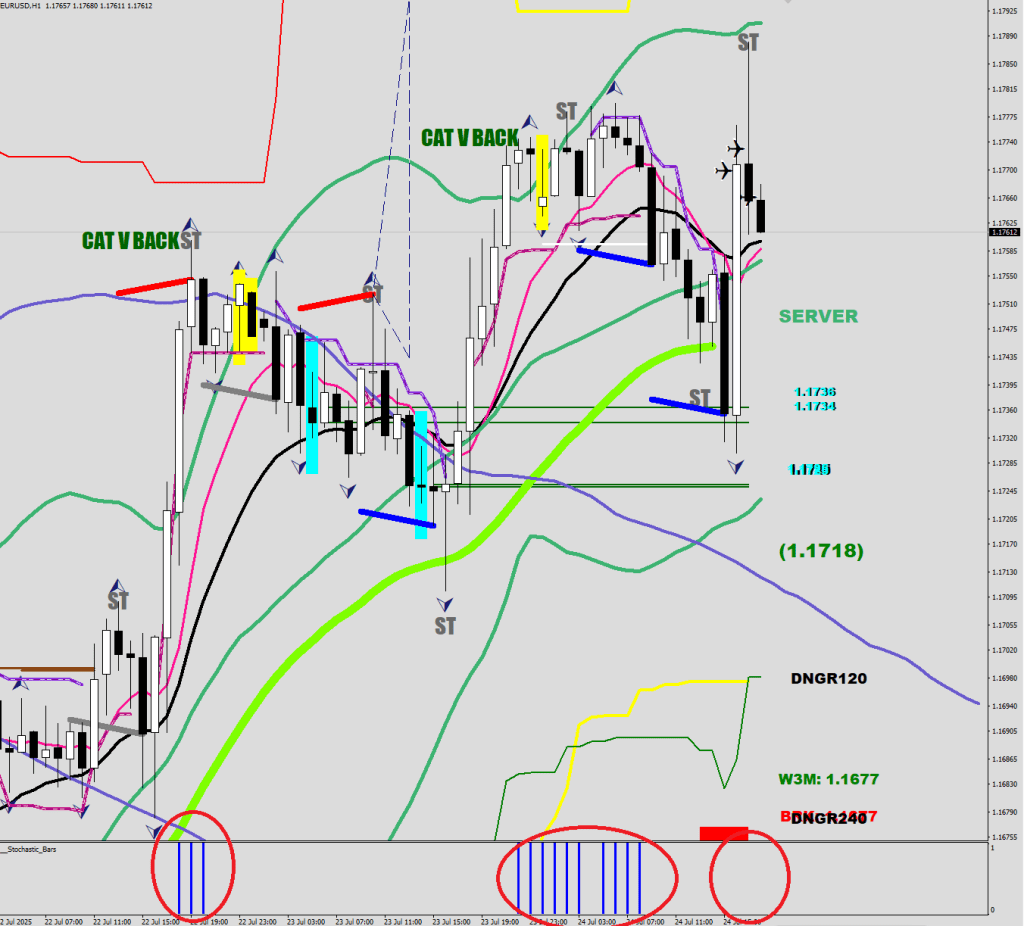
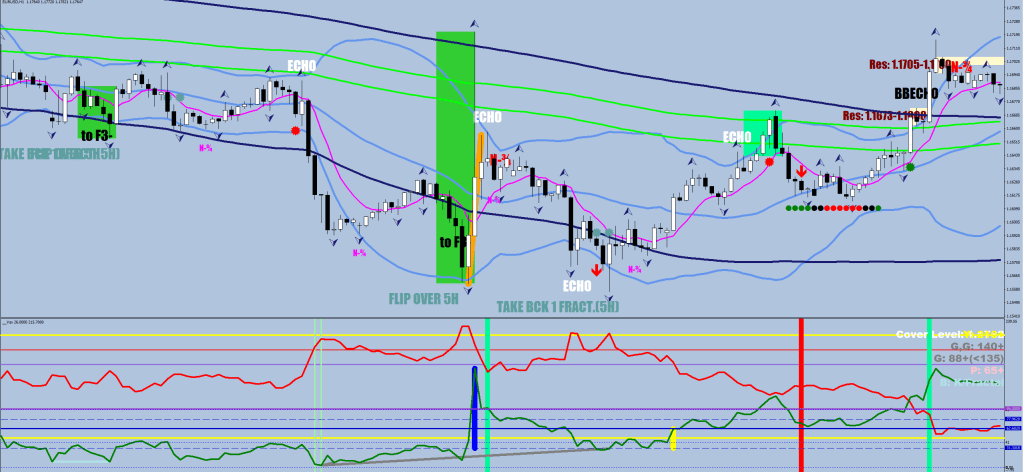
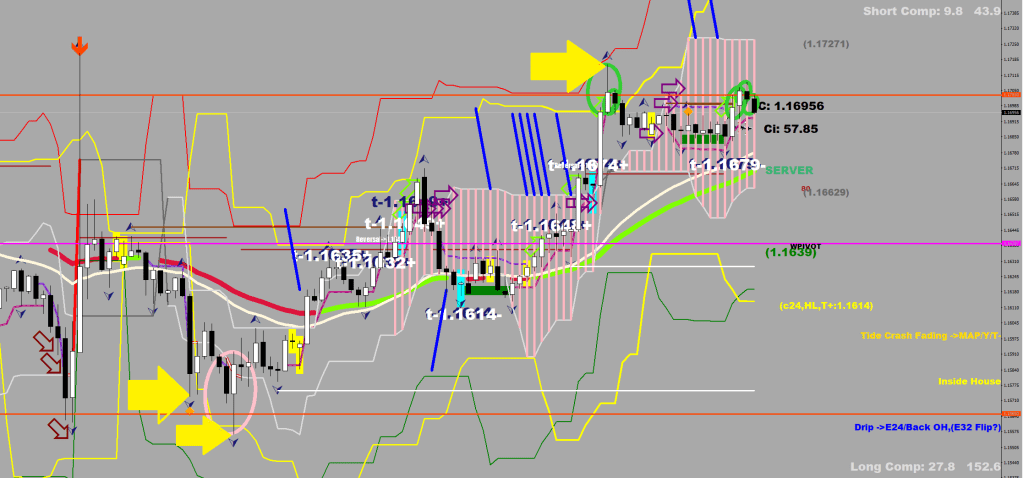
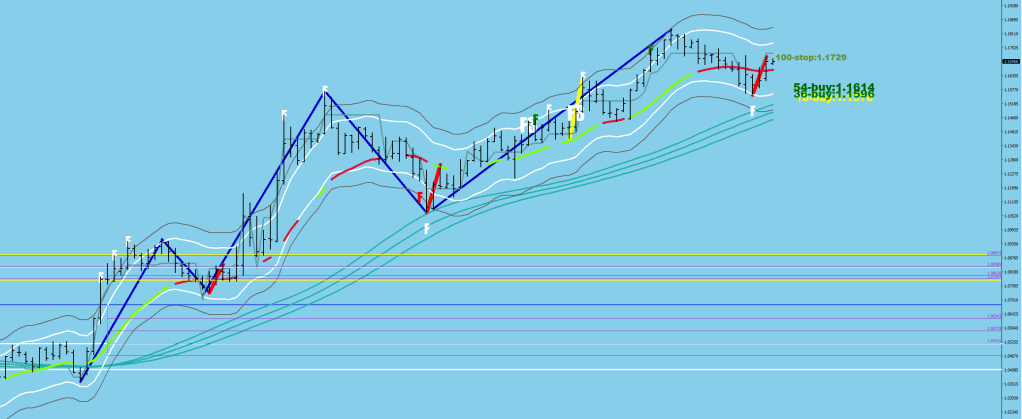
So, the market remains in a Mapping mode. This means that the moves are volatile enough to ultimately get outside the Yellow lines (Yellow arrows) at least on the first legs.
The tide turn signals are not useful in a mapping market. The green and pink hoops are turns occurring about 1 fluctuation maximum away from the 9-day EMA (“the valley”). The blue marker lines are trade suggestions for a 16, 35, 55-pip break, either because of the flip at the E-32 (Khaki) or at the edge of the house (Pink shading).
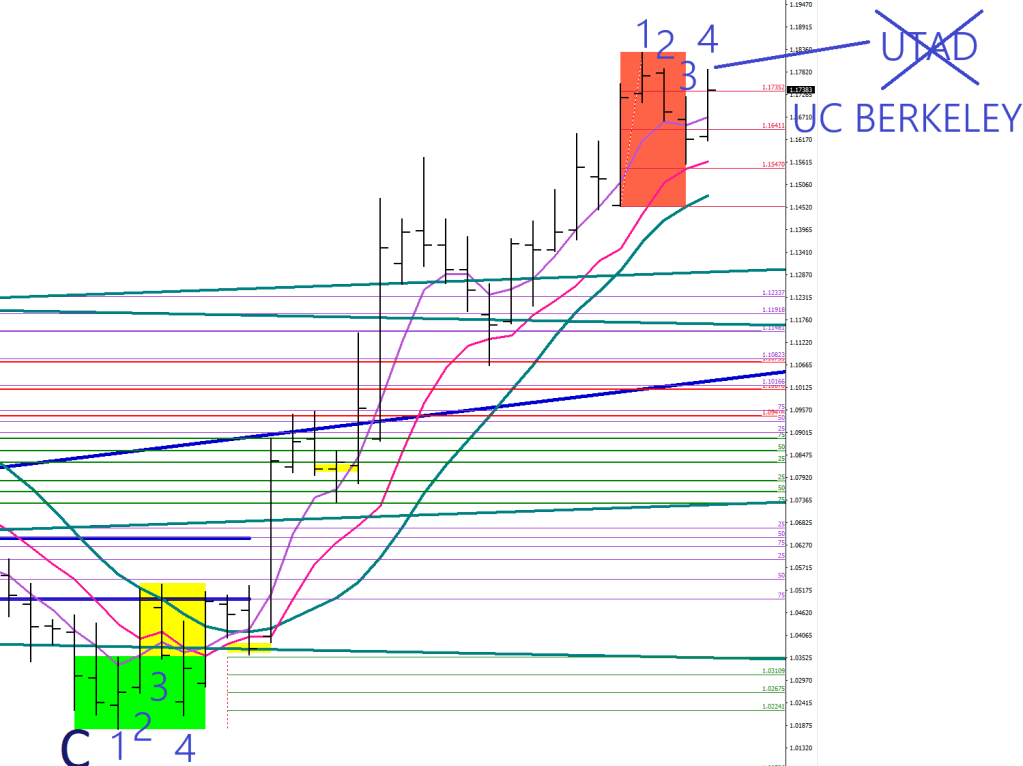
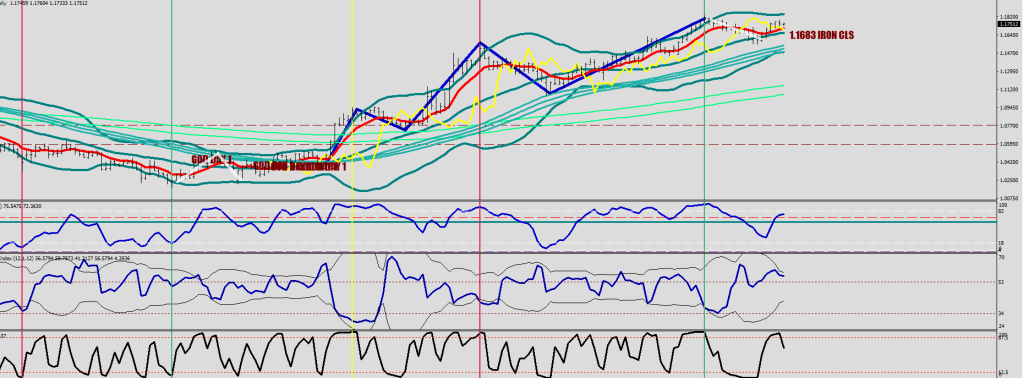
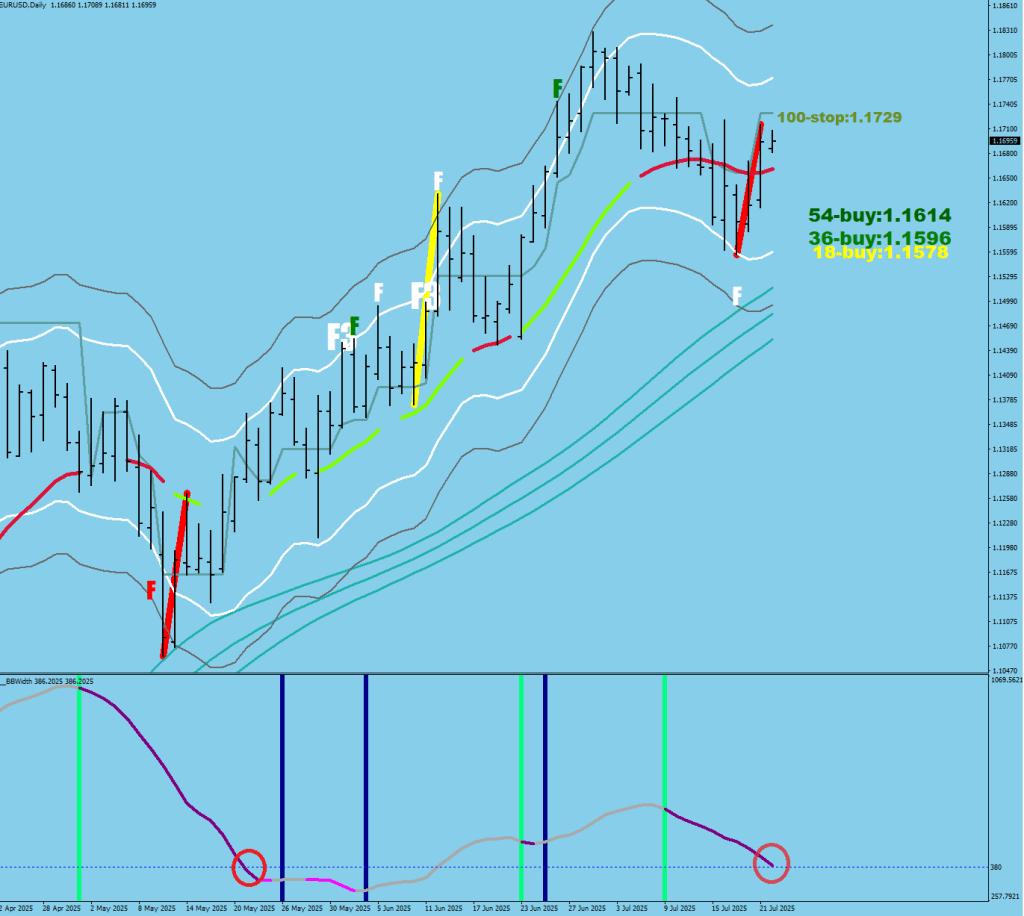
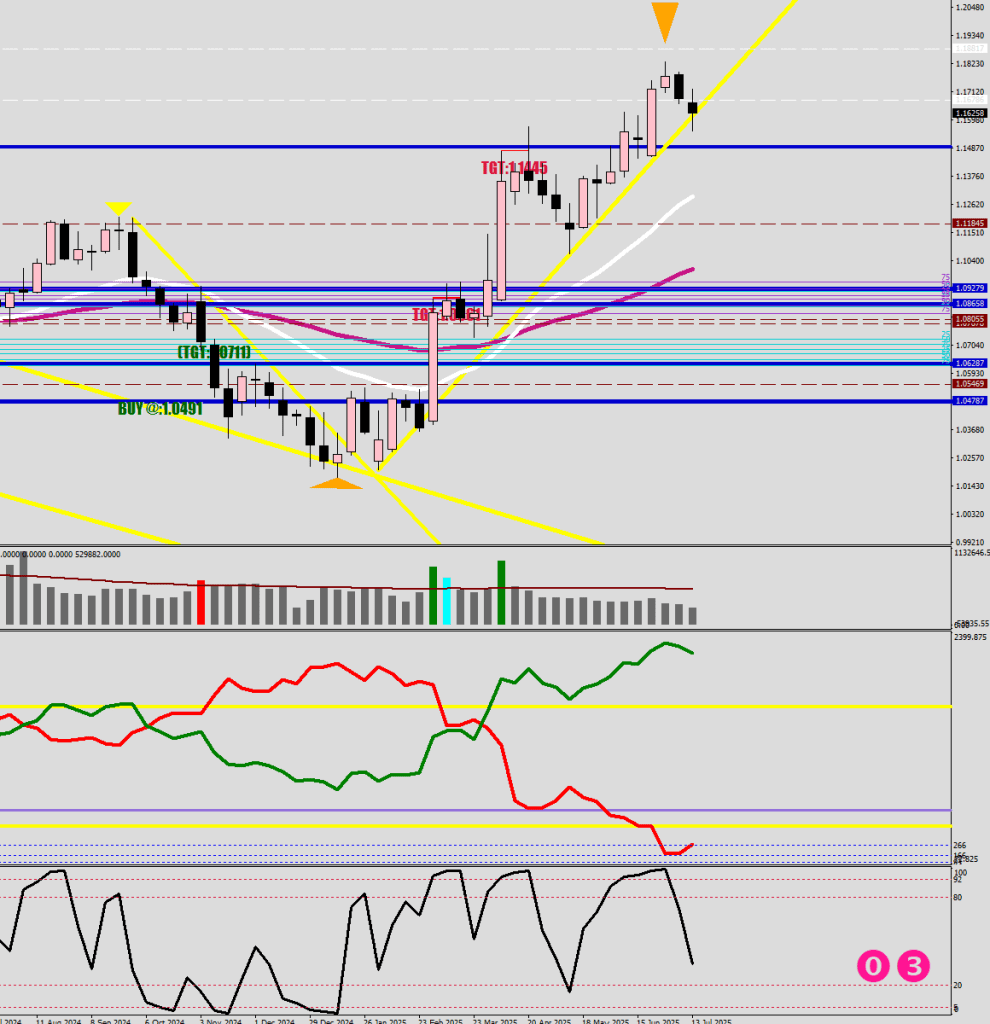
On the daily, the BB squeeze is about to set in, meaning a directional, trending move is pending.
Sure, the last time it was to the upside, and I think it would be to the downside next.
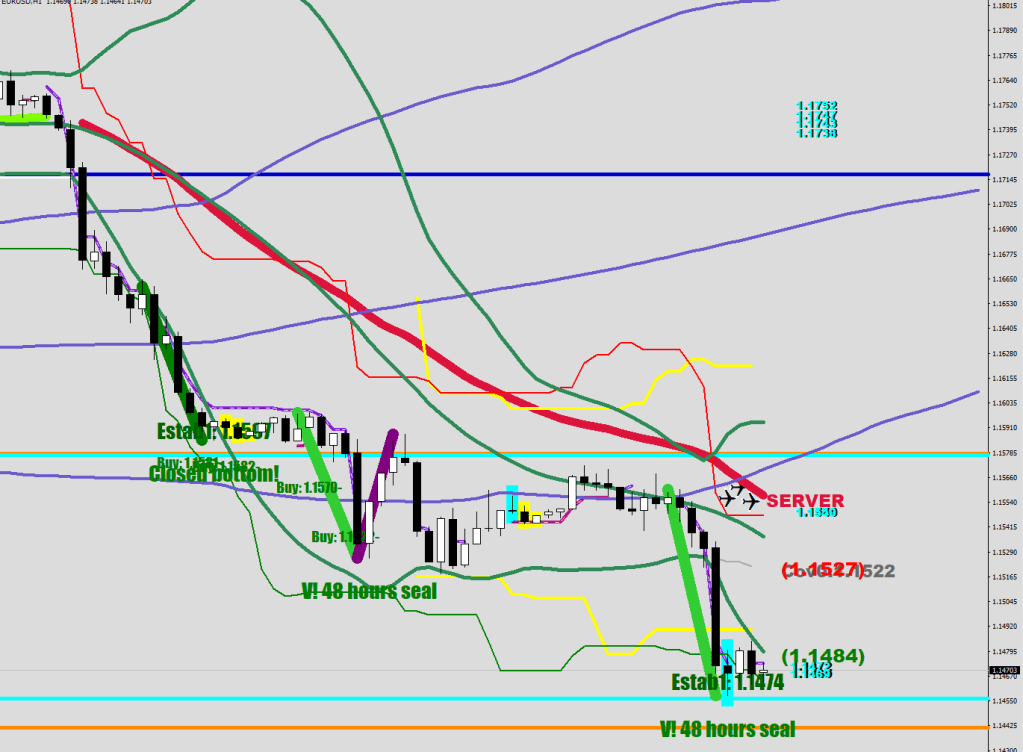
The red diagonal line is a liquidity break to the upside. This one has come from the 2.8 fluctuation maximum line (white – no root), which is different from the previous, failed call that started from beyond 4.5 fluctuation maximum (deep root).
To please E.W. people, here is the 5-wave structure where Wave 3 could not be the shortest. Even if the current move down would be just an ABC (I think otherwise), we have not seen the C leg yet. A liquidity break sounds more like a Wave 2.
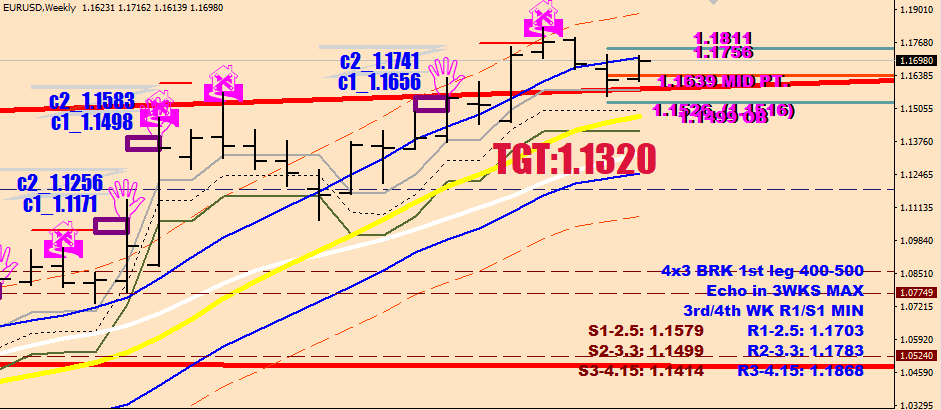
I believe that 1.1380 is in the cards, and possibly 1.1320 as well for the end of Wave 3 down.
Currently, there is an open top (Purple diagonal)
10 hours left to make a higher high; if that happens, the top is a bust. Beyond 10 hours, the beat (if it occurs) should be the bare minimum (1-2 pips).
Currently, I have doubts about the continuation, as the price should have returned to the E-24, but it did not; instead, it rebounded and started rallying after 16 hours, leaving this rally “in the air”, but it is right before Powell, so things may change.
If you like Madis, State Azure, you should fancy this track on album #79, Chill.
Track #6, Hay Little Dreamer is mopping the floor with this one for the views.
There’s my 5th French track here as well, Ensemble Maintenant (Track #9).
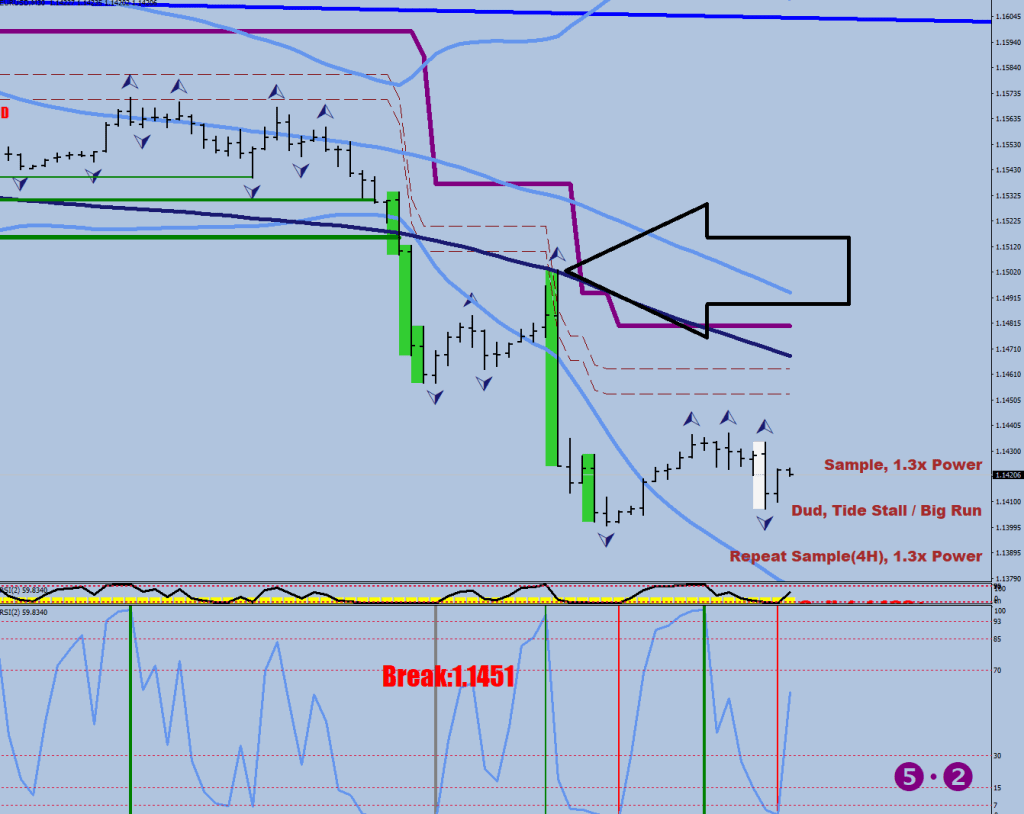
The daily RSI2 is finally getting some relief, but the stochastic has room to go more oversold. On the list of levels, 1.1445 is next.
A tide-turn warning in a Tracking market.
We can finally say that the swing high was made.
Where could the market go after losing the daily overbought status? Probably to neutral @ 50%, which is 1.09.
People who are calling for 1.40 do not seem to remember that when Europe was still functioning, 1.123 was lethally high for them. Now that the car industry, Germany is tits up, 1.18 probably just as high. So, on the way to 1.30, Europe would blow up multiple times with the double whammy of no exports (no income / no gdp) and high currency conversion rate.
My new, 15-calibre album. I went the extra mile with no compression and maxed out quality wherever I could for this re-makes and remixes of my own songs made from scratch. No parodies this time, only original material.
You should always be cautious of moves that are 93+ pips in 3 hours or less.
This market was still accelerating at the low, meaning the move will continue, until a divergence would correct the stretch achieved.
At the larger arrow the acceleration was about 3x fluctuation maximum from the mean (E-9). You would need to see a 2.85+ print with a lower low for a divergence or a larger print for further acceleration (i.e. Wave 3 commencing).
Here is a guy that you want to avoid trying to learn anything from:
This guy is a cowboy, and he’s there to take money from you monthly. One of the most F-ed up personalities ever.