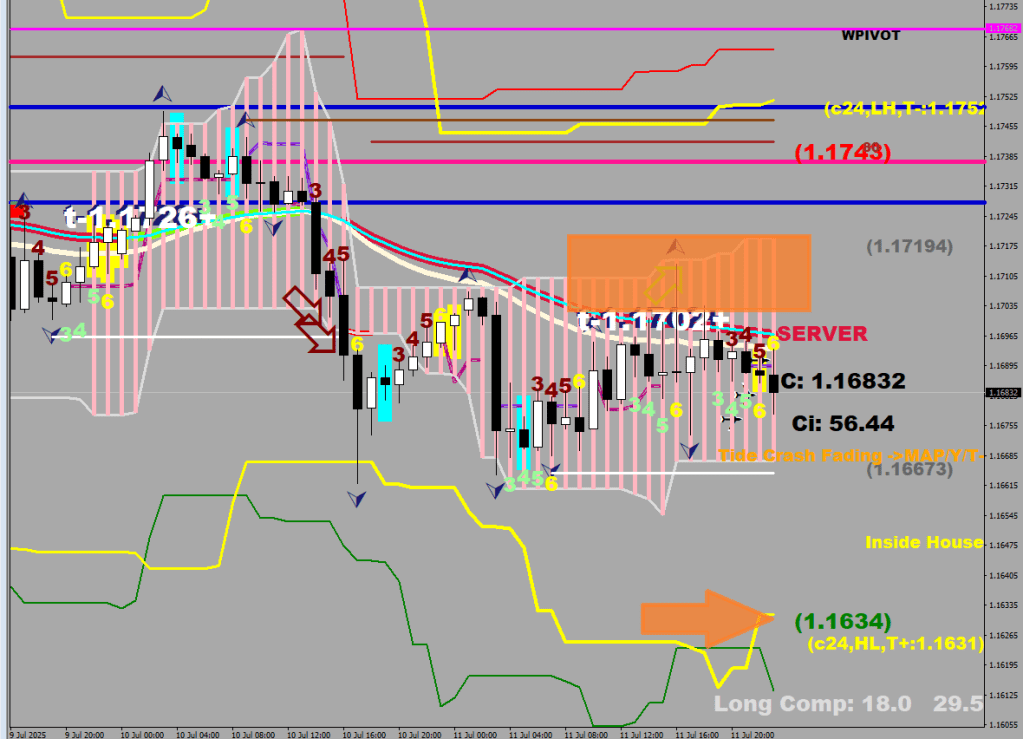
Still in the transitory tide market, with a tide crash having just occurred on the upside.
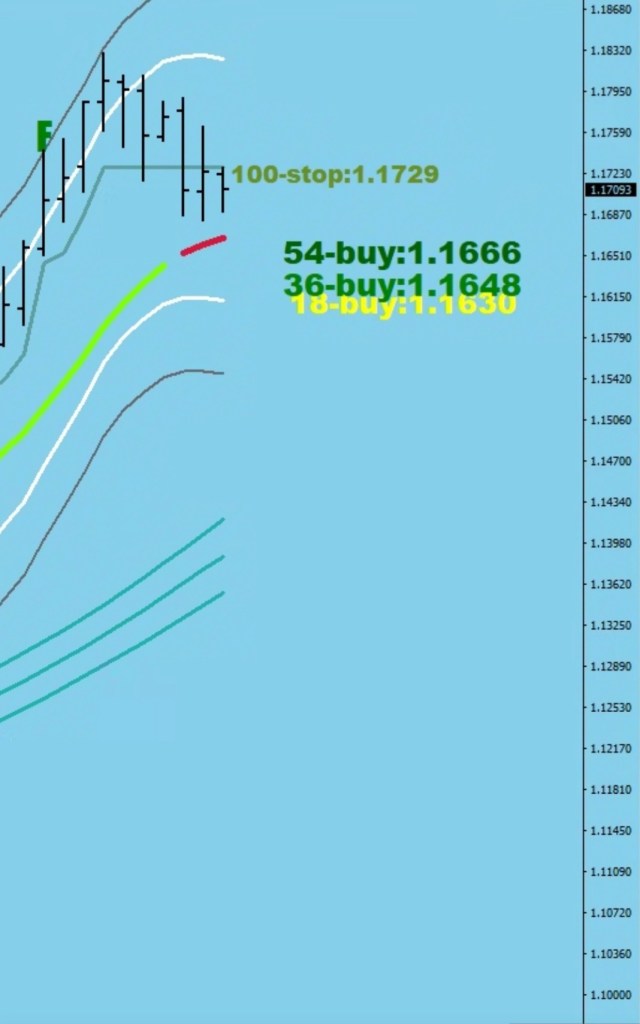
The default target is beyond the yellow, currently below 1.1631
There is a chance that the market would transition into mapping and do not come back (close back inside).
I believe that there should be a catch-up with that started trendline. The Duds are meaningless in a tracking/tide market, just like the Tide prints will only work in one direction during mapping.
The more time wasted, the deeper the target.
The only way I could picture a sustaining turn (without a serious drop) would be an hourly down fractal followed by another one, that exceeds it by 5+ pips, a lift, and a bow-back to the low, and a purchase within 4 pips of that.
How to make a “best of” selection from 1200 songs that I made in a wide range of styles?
I only have clicks info for about the last 10 albums, thanks to the Topic.
So I decided to call the playlist Milestones. Started enrolling the most listened to, the curious, and the achievements that may outlive other works. A well-known voice does not qualify alone.
Of course, finding the most listened to album (335 listens) does not take much.
The #2 might catch on (260 listens), as someone seems to be listening to it on a daily basis.
Once I get to 2000 songs, I will re-visit the question of renaming myself to The Weekdys.
You know, no one has ever named themselves after Week Days, and the drop of the vowel would be very original too. I guess I just can’t help being a parodist.
The dilemma is always there. Is this the start of something or the end?
Your answer is the weight of the evidence, but you need enough uncorrelated things to plot, look at and evaluate correctly.
Exceptions & fake outs.
There are things you can learn & build upon.
When the Money gets this overbought, a higher high has to correct back. The one exception is when the entire volume gets absorbed.
The stochastic not being overbought can mean both: there is room or it can’t seem to get overbought.
What do you know, pro volume print on that money flow peak.
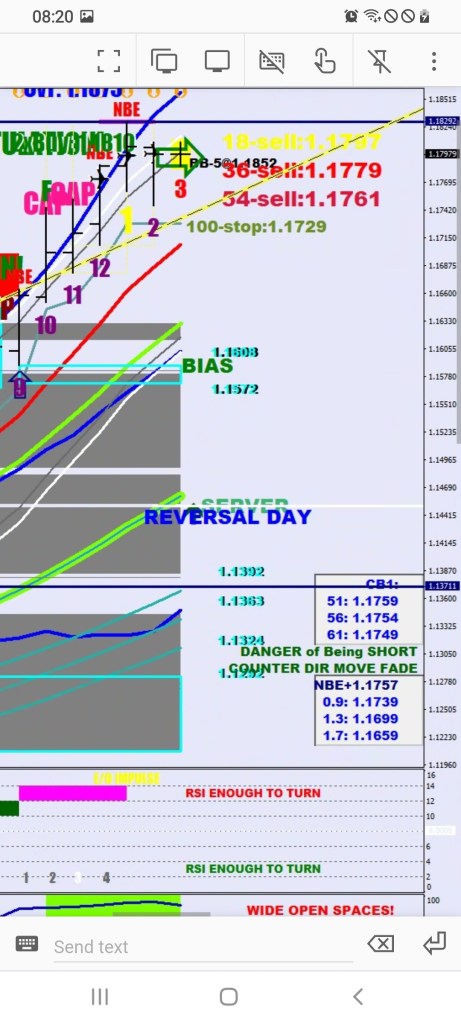
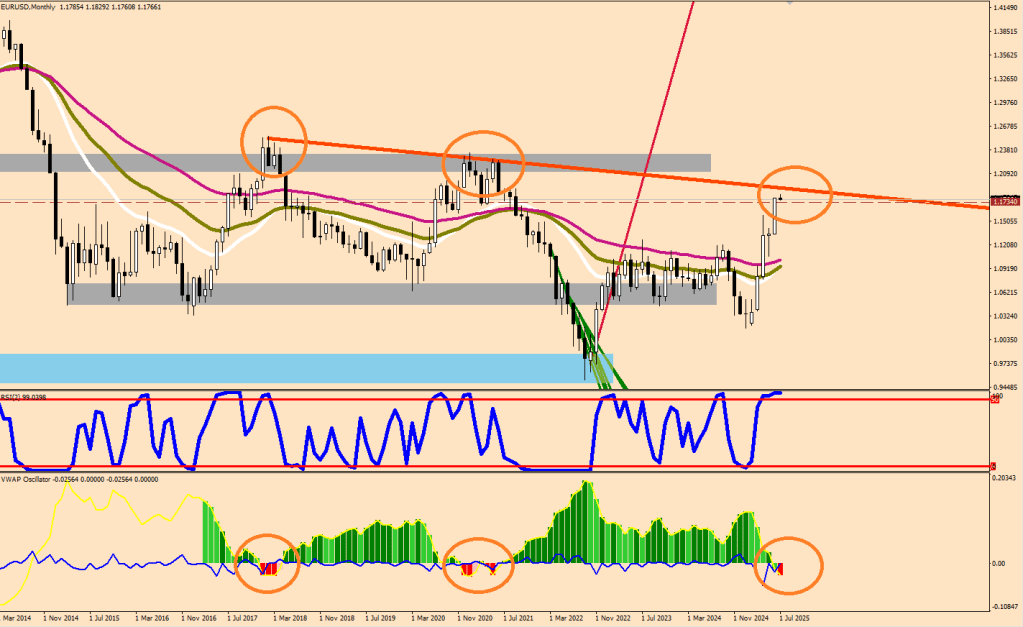
There were three thrusts (green) which meant a time out, but the bounce taking a day plus already has achieved nothing on the upside. The last leg’s first established level was bought at 1.1690, but there was an absolute stall out at the 100-pip stop.
This morning the level was cleared, but uou had 3 daily closes below it. Which is the fake out here?
There was a Tide turn warning, but the crash went on for 23 pips and we are still over the bump. Do you doubt a Tide Crash advisor?
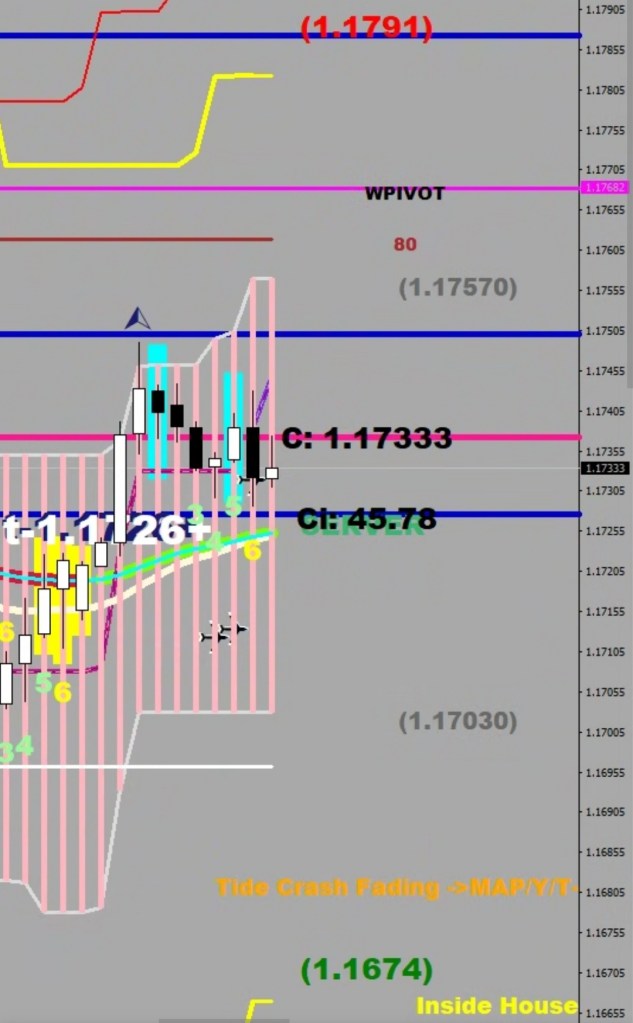
The house is too wide (grayed out numbers in the brackets) – meaning too high volatility to start a move.
The sell off did not result in momentum detection (stochastic bar prints) on the downside, but was flashing red with this measly move back up.
Does this mean the presence of momentum of fresh overbought toxicity?
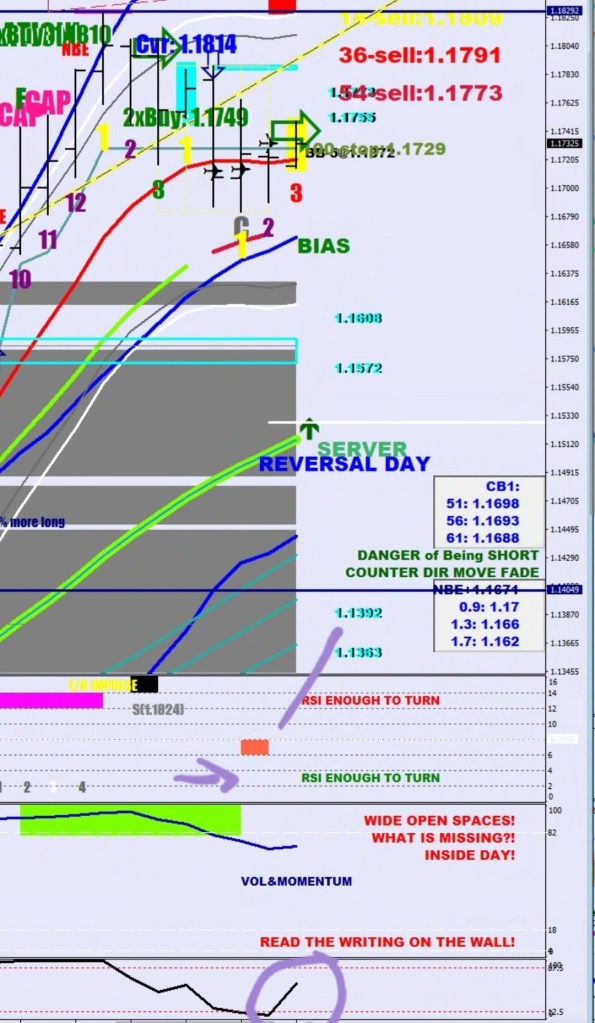
Lastly, the Daily RSI2 seems to be doing a crooked finger move, rising up for the next bite. The Nick Rhodes scale has 2 more degrees to give before a final turn back up becomes a good probability.
Due to the high energy reserves, the S20 might be taken out with ease. 3-5 days selling would bring the daily stochastic to neutral. 1.0608 and 1.1572 are two high volume call points on the way down.
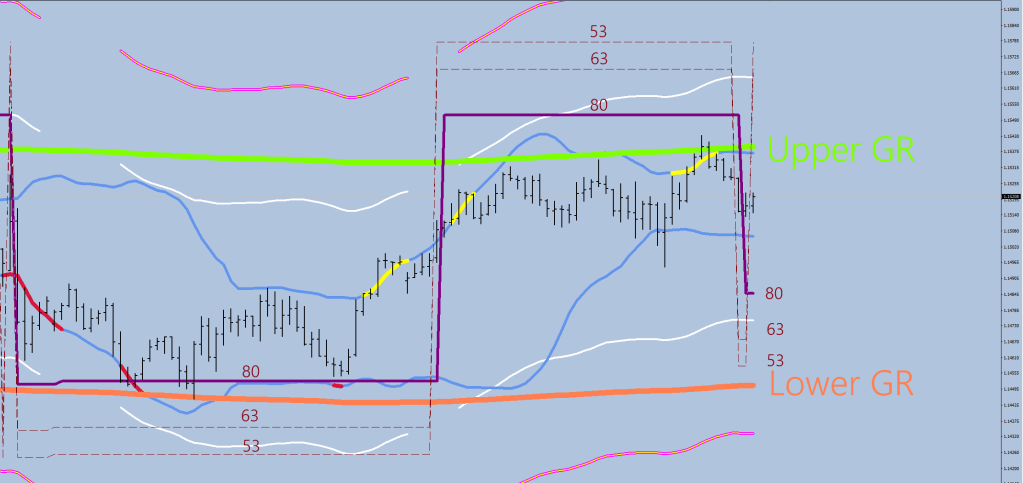
A bear config is the 80 to 53-pip lines stacked in a declining order. A thrust could come from the 53-63 area.
A theme has been an RSI2 extreme and 2 reversal divergences. The tagged on pips were anywhere from 5 to 40 pips.
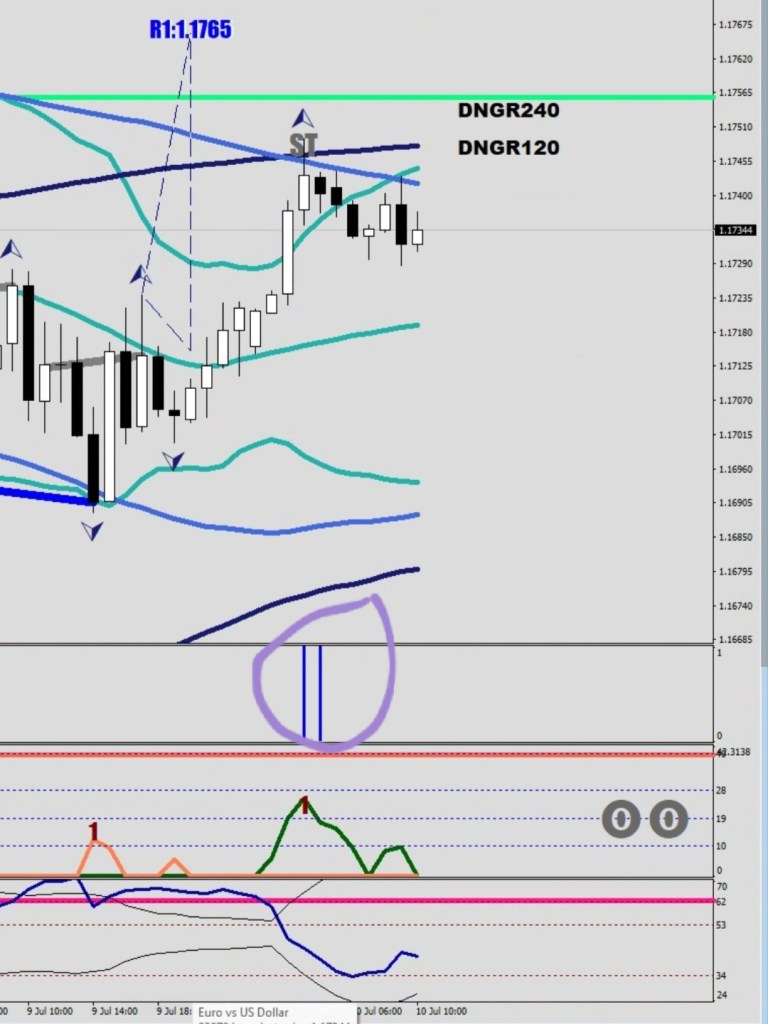
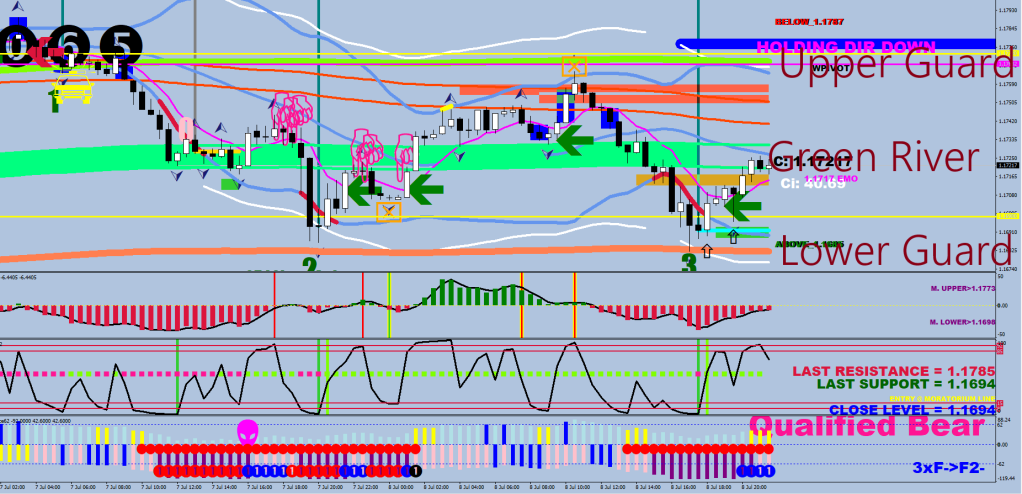
The Tide turns seem to take hold, making for a Tracking market. That is until you get a move outside a yellow line and consolidate it off instead of being rejected.
The big change is price getting on the other side of the 9-day EMA.
Once momentum kicks in, the Lower Guard rail’s vicinity would make for a perfect short area to revert the price and prevent from a mean reversion.
My plan is to stay short on balance and add on Tide turns and double divergences.
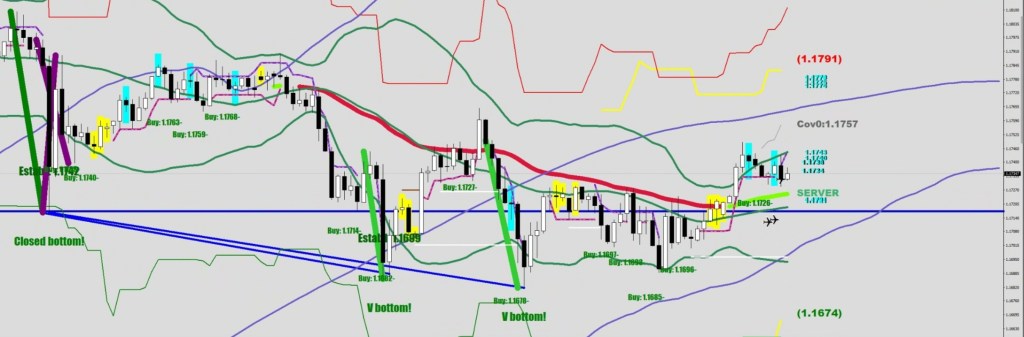
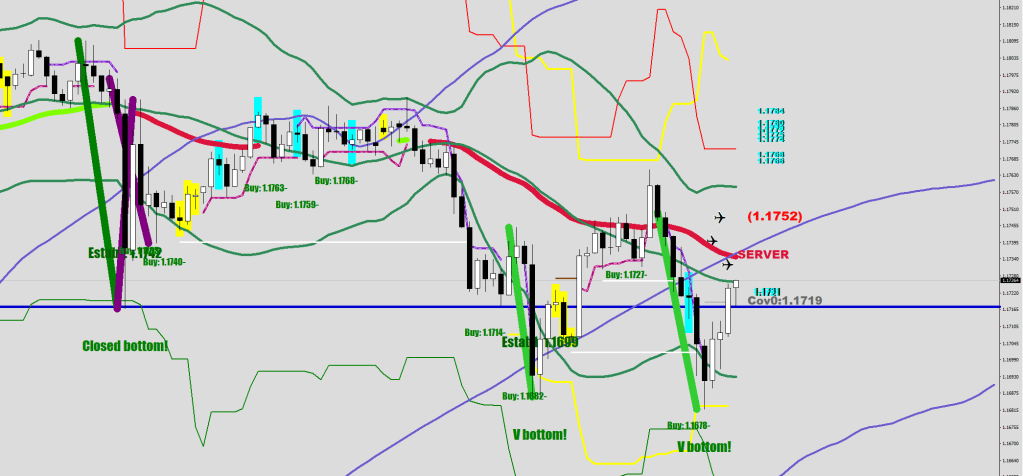
Stuck inside the Moat (E-414 band to S-712 30 Min). The daily is losing the stochastic embedding.
You don’t normally see a closed bottom or a V bottom violated, but that’s what’s been happening.
The last move down qualifies for a money flow Acceleration (Drive). A thrust to the downside may be pending.
Recently, I was reminded of a story; I was in New Orleans, and a black stripper in my lap was reading off my shirt, baffled: “Berkeley Dad?”
A year or so later, my daughter was born in Berkeley.
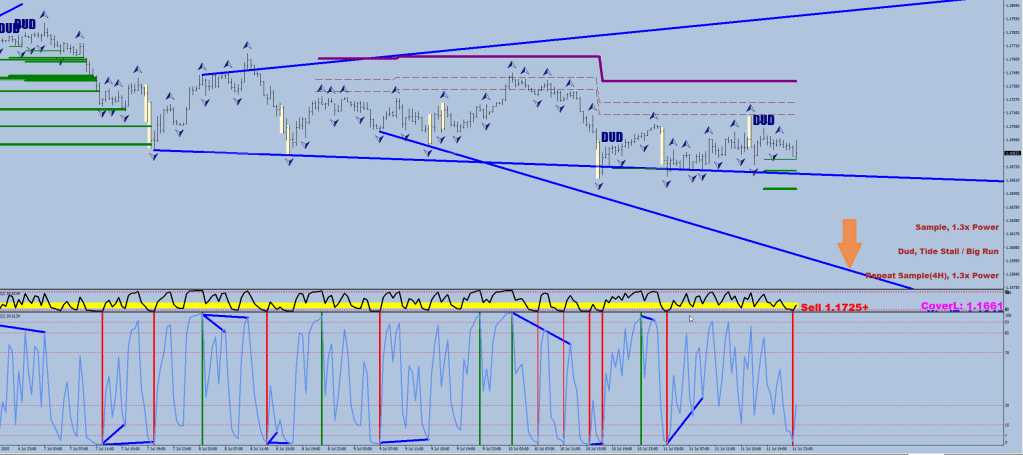
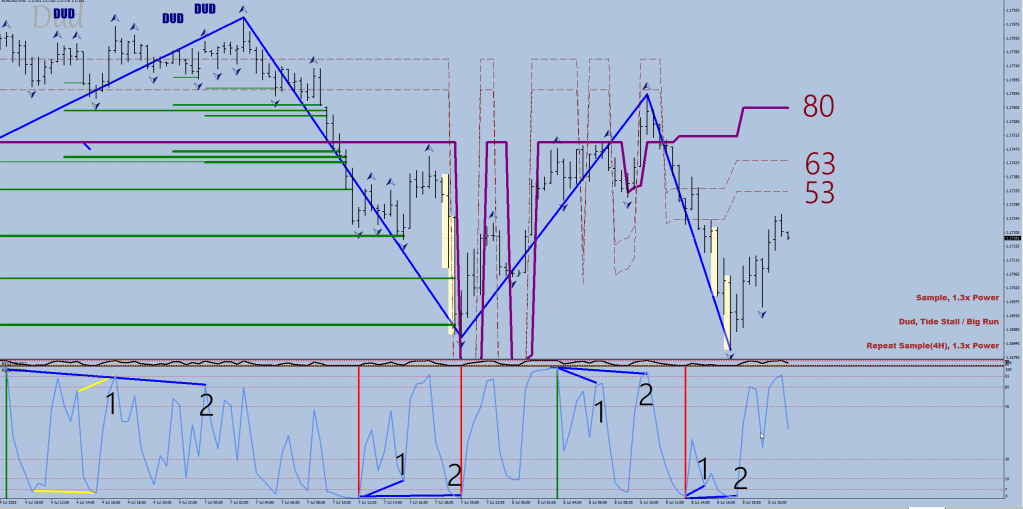
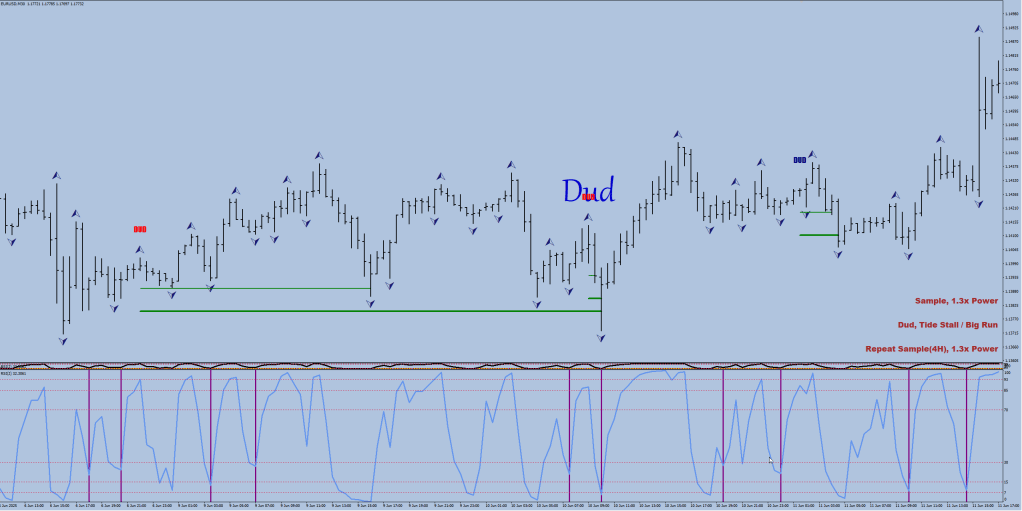
So, I have these ideas about concentrating efforts on second legs for a power play, and along the way I came into the “Dummy” or “Dud” fractals that seem to come with a promise of a bigger run (versus the second legs that are only good for 1.3x of the fist leg).
Step one, on the 30-minute chart, plot vertical lines on the RSI2 where it comes back below 28 and makes a V. The array minimum check is for finding the root to be not up in the air.
Step two, plot DUD 2 or 3 candles out if it has a greater than 65 RSI2 print and the next one is on the decline. Make it red if it went to 85+ -> it would likely be followed by a lower low first that would be in excess of the most recent low by 10+ pips.
Step 3 is the weighting. The displacement of the green lines is 3, 12, and 27 pips. Say you had 3 lots for maximum in mind, you could assign 0.5 at the first line, 1 at the second, and another 1.5 at the third.
Not sure what all of this would get us in the current bow-back up, as all of these lines are going to get run over after a new high is made. That’s my 25-hour limit (50 sample), buy the way.
My birthday present this year was receiving Annie Lennox (2nd time) and Peter Heppner for some abuse.
(Peter Heppner – ex-singerof Wolfsheim from Germany)
I'm waiting for the shoe to fall
I know that we'd need footwear and all
Plus something distilled
Single malt, twice filtered
Fragile intention
Vintage vantage
The centerfold folds in the middle
The tide is turning & it's disconcerning
Once I had  yellow toy soldier
Then I found out: it was gone
So now I just hone in on
The frequency of a big beast, frequently
Step by step, what's right, wha's left?
Doberdo and doberdamen
Nothing but a heart ache in the heartbreak
Hotel
(Don't look, don't care!)
[Chorus]
I'm waiting for the chance to brawl
For every living Wolfsheim to howl
I'm gonna pick up the phone
Dial some numbers and conduct a call
Osterreich
Spechen sie Deutsch?
The wolves are mine
The thyme is here
Take thy shot
An all-style
A brisk boost of whiskey
Petra's choopeta
Perkins Twerk-ins
Smooth chess;
Hold your nose
Hold the door
Go on
Grow into the foothold
This never gets old
But you are...
I'm waiting for the last shoe to drop
And my best perfotmance to flop
Angry, like a wolf
(Annie Lennox)
The EDM is doing great on the last album.
Sometimes I toy around in my mind with locking up the members of Duran Duran somewhere, without any control of what is coming out of the loudspeakers and playing them the 10 songs that I made with their flavour, on loop. It is not that I don’t like them, au contraire, but I guess I love a bit of parody just as much. If they ever make it to the White Noise, they would certainly start destroying the speakers at that point.
(My Duran Duran / Simon Le Bon playlist)
Lyrics of "Smooth Blend"

We sell coffee only
The sexual fantasies
Are only the figment of
Your own, home grown
Imagination
[Chorus]
Smooth grind
A barista, seemingly aroused
A smooth blend
And a bagel with some spread
On your mind

We pay well trimmed attention
We are attentive to your needs
We are well shaved just in case
But we're suggesting here nothing

[Chorus] Smooth grind A barista, seemingly aroused A smooth blend And a bagel with some spread On your mind

Tight jeans, blossoming hips
Over the top colorful lips
A coffee parlor is all
It's just your imagination that
Went into overdraft
(Pay here...)
[Chorus] Smooth grind A barista, seemingly aroused A smooth blend And a bagel with some spread On your mind
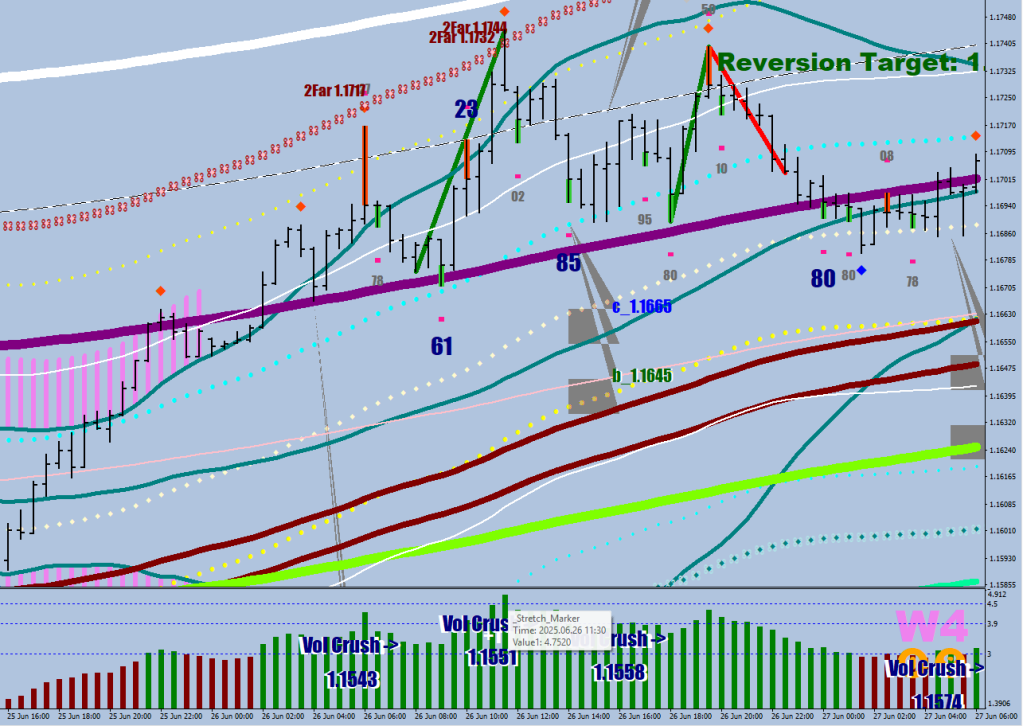
Early March peak. RSI2 floored, then a V top with a 6-pip beat before a 220-pip decline. 2 days down, 3 back up.
The impulse wave structure does not end in strength. A divergence is there to take away the edge (orange line connecting the magenta with the green box on Nick Rhodes).
At least 4 pips, but probably less than 16 for the beat. Wave 5 is still on for a day or two longer. A bow back that will eek out a higher high with the momentum lost on the way.
The mapping market starts with a steep change in futures contracts holdings, a sudden imbalance due to fair value concerns.
The blast-off move is going beyond the red line and consolidating there.
They hijacked the bombing weekend’s sudden found excess volatility with the gap down.
The red line is still a 10-sample low plus 90 pips
ninup[i-1]=iLow(symbol,0,iLowest(symbol,0,MODE_LOW,10,i-1))+900*Point;
My standard way of measuring how stretched the market becomes is by plotting the distance from the 9-day EMA band. This value can be utilized in the future when wanting to spot the challenge and shortfall from this first move.
The rotating out part is there to show that the core holdings have just become 5% less, which makes the turn of the tide possible.
Think of it like this: two checkpoints, the price is a lot higher, but there are significantly less long holders -> the price should reverse.
This Wave 5 came with a 4.75 stretch on the first move up.
Today’s maximum stretch was at 4.57 which would make for a 4% loss.
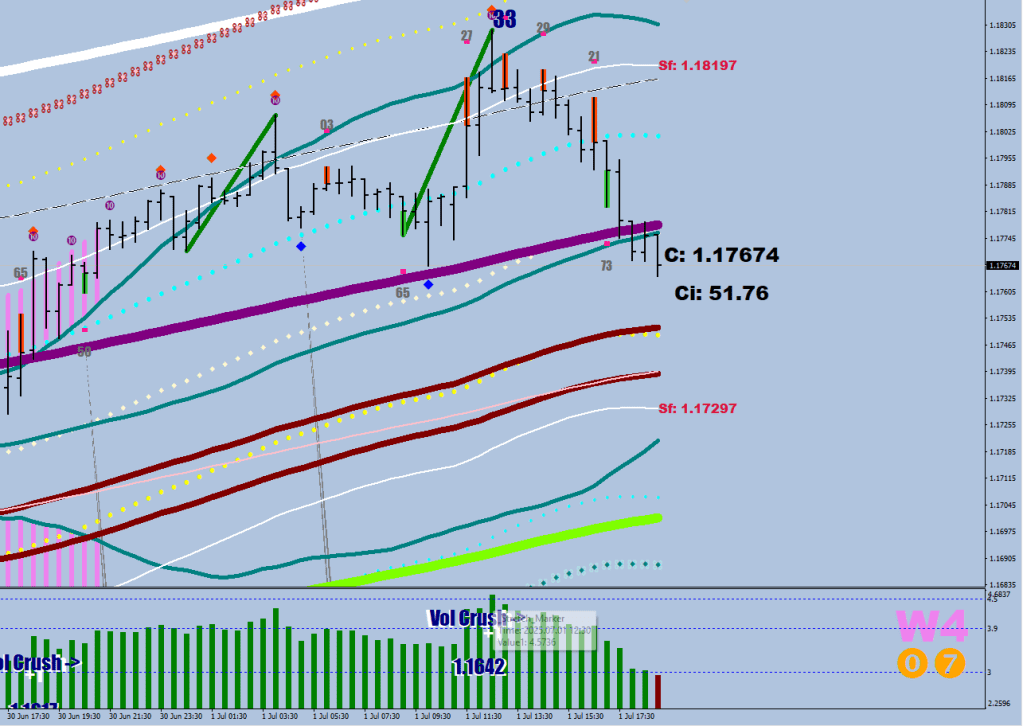
The Wave up seems to be up.
Now, notice that every time the price tested outside the house on the upside, then failed back inside, it has ultimately made it to home: beyond the E-32, and another leg perhaps below the E-44.
The same movie over and over again.
The reason why it could be different this time, is the divergence between the measuring points.
I want to release these notes, so I won’t start on the horizontal arrows and the upside break 16-pip trade this time.
Things are in motion. There still haven’t been any closes below the Server (E-44 HL2), but that may occur next. A right shoulder up to the last established level is still a possibility for a kiss goodbye around 1.1813, but this is no longer a safe buy.
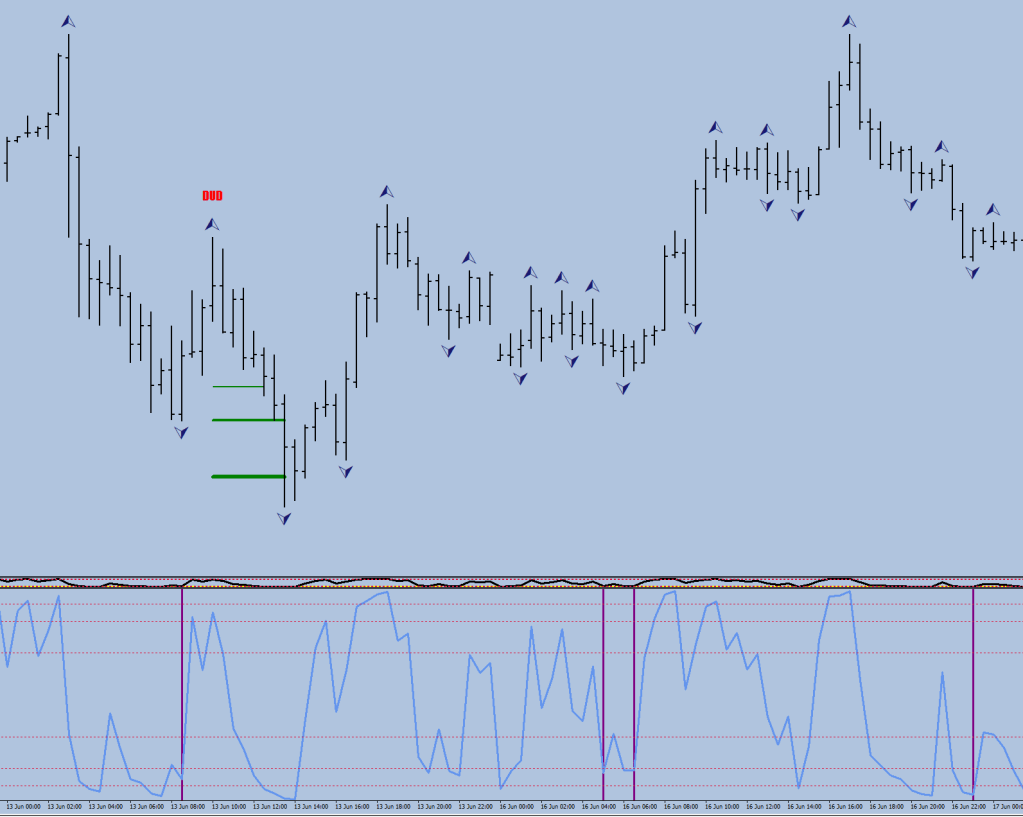
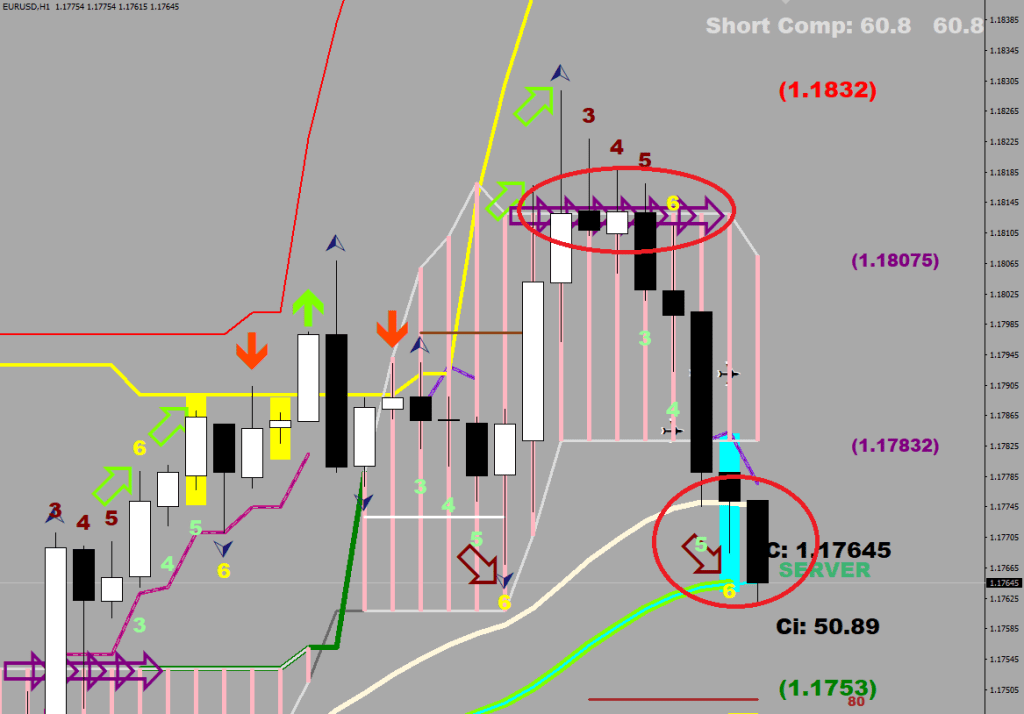
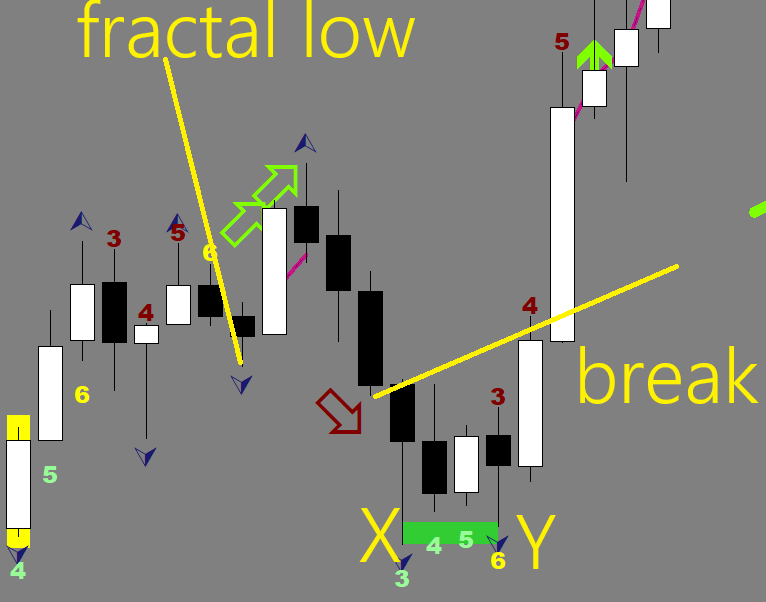
So you should get excited if you see a Maroon, downwards tilted arrow after a green one.
However, you would need to legs to stand on. X and Y were in this case 3 hours apart, the maximum time allowed is 8 hours. Y does not have to make a beat, it has to come within 4 pips from the X.
 //downside
   if (
      i>0 && Low[i+1]==iLow(symbol,0,iLowest(symbol,0,MODE_LOW,6,i+1)) &&
      iFractals(symbol,0,MODE_LOWER,i+1)
      ) {counterd=1;
        if (i>0) {
               j=i-1;
               while (j>0){
               if (MathAbs(Low[j]-Low[i+1])<40*Point && iFractals(symbol,0,MODE_LOWER,j)) break;
               j--;
              }
              if (i>0 && j>0 && j>i-8){
              ObjectCreate("KAROLYII"+DoubleToStr(i), OBJ_RECTANGLE, 0, Time[i+1], Low[i+1]+40*Point , Time[j], Low[i+1]);
              ObjectSetInteger(0,"KAROLYII"+DoubleToStr(i),OBJPROP_COLOR,clrLimeGreen);}
             }
     }
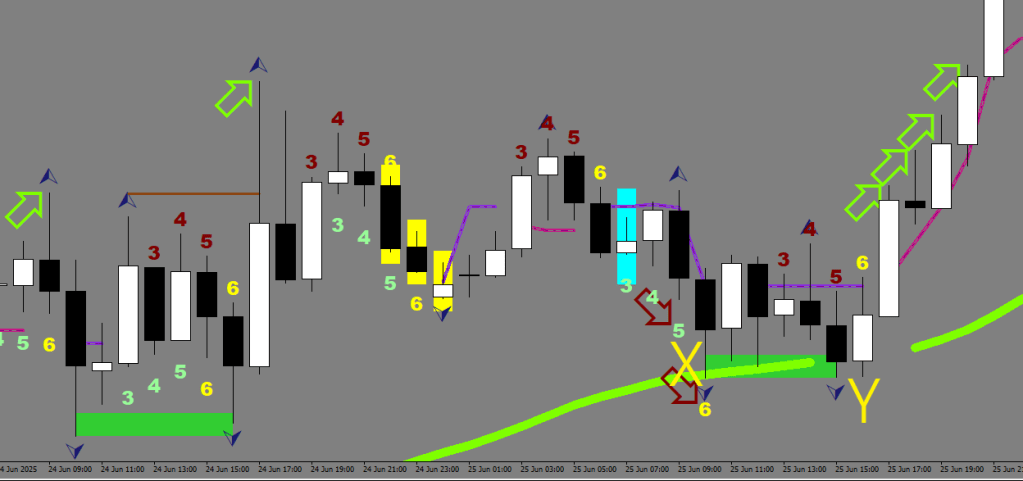
So the one example was the same thing 5 hours apart (green rectangle on the right with brown arrows in front).
This little dip lower is the volatility boost necessary for a good start.
In the next one, the first green rectangle did not produce a new high. I’m telling you, the extra volatility is necessary.
There were 8 hours between the X and the Y before the last run up.
Now you have the volatility boost, but the Y leg has not yet printed. Does this mean inability to make a higher high? In my opinion, yes. The trick would be if the price would go below the fractal low by more than 5 pips. That would mean canceled.
There was a powerful punch line in my head for this post, saying, dude, where is the imbalance at, what fair value crap?
But the way I churned things out wasn’t snappy enough to make it funny.
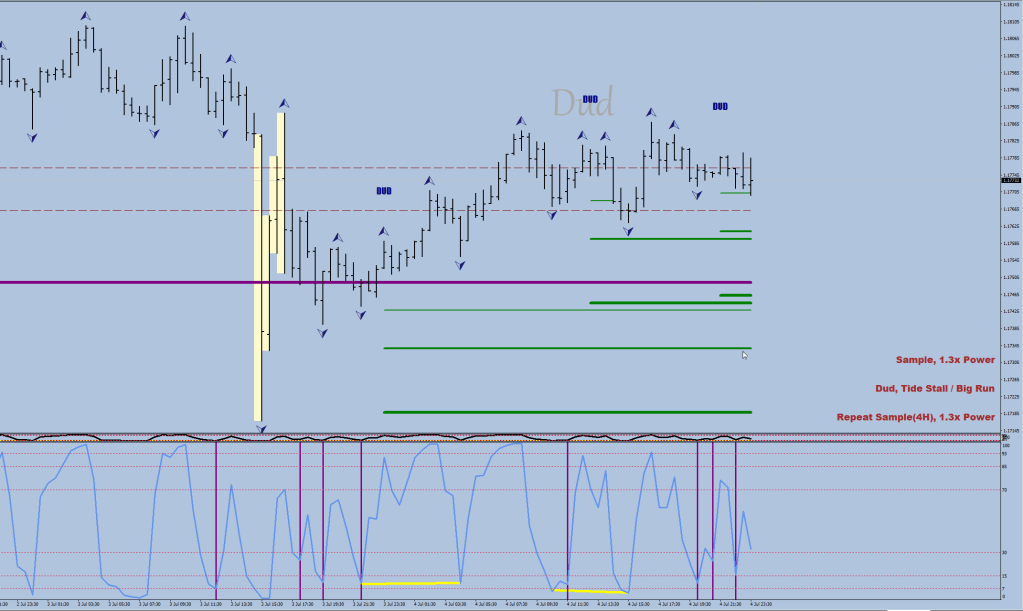
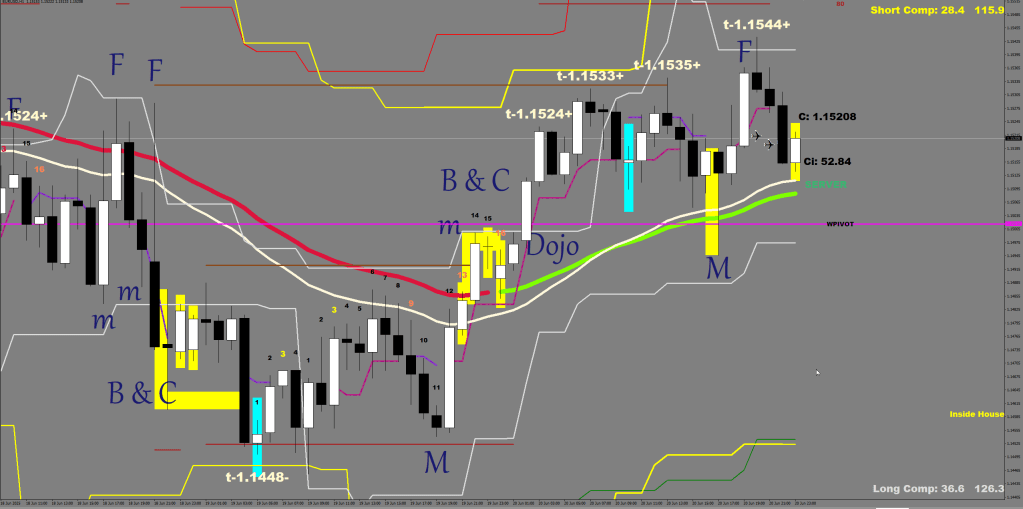
There are two kinds of markets based on volatility. Tracking and mapping.
The tracking market fails to make a break at the yellow line, the mapping market manages to sustain it. You can see on the image a agents Map! print, which was a Tide (“t-“), but the draft would overwhelm the tide crash and keep on going 25+ pips later.
See the yellow line? The thrust did not make it beyond (thus I colored it purple – the downside version is trickier). The direction’s color changed, but there is an incubation period where a couple more higher highs could be printed.
Historical example:
There were 3 more legs up, two higher highs made, and the total distance put beyond the initial high was 18 pips. The total duration was 14 hours.
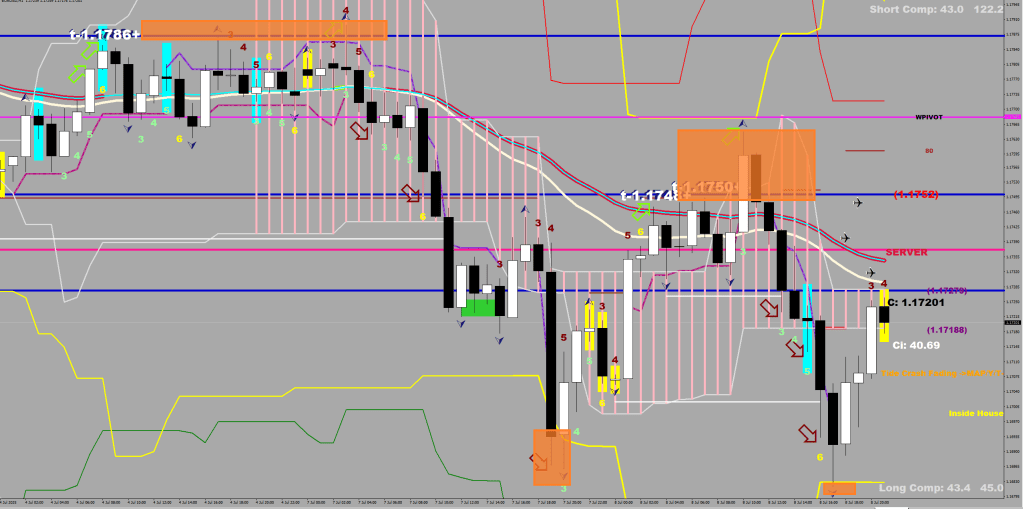
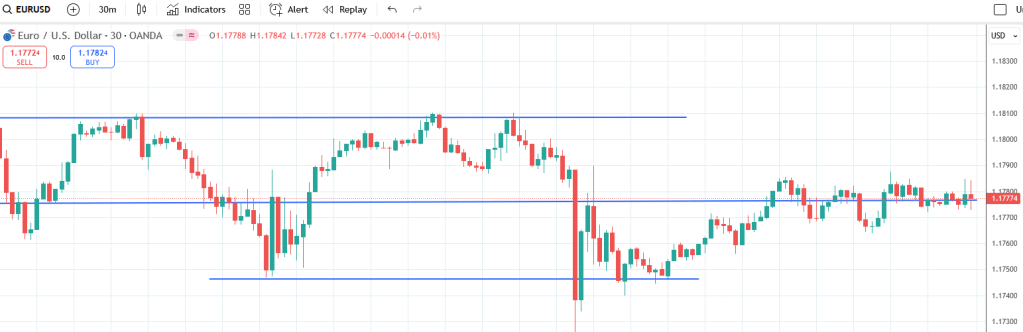
This market is in between configurations (outside from the 200-hour low and from the 200-hour high by more than 80 pips both), currently girating between the upper and the lower guard rails (within 1 fluctuation maximum from the 9-day EMA band).
A swing high is in the making.
This requires the week to close down by 91 pips after a new high was made during the prior week.
Wherever the new week opens, typically you would get a move back up before proceeding lower.
The move can be anywhere from 25 to 54 pips, but 51 seems to be a frequent answer. How do you short that? You go neutral if you are long at 25 pips from the low, and start adding shorts as it moves higher. Every 4, 5, 10 pips. You decide on a maximum size and divide it by 5. Or securing the bulk first.
I could picture a small gap down, mostly because of the spread expansion, but still missing or barely touching the back of the house (Gainsboro). Next move would be another failure at the front of the house (higher Gainsboro), but this time it could scrape/pierce the 80-pip brown line above. Just like on the downside (see cyan candle down) , that would make for an excellent point to fail at.
What do you know, that’s 50 pips up from last week’s pivot.
If there would be another “M”, miss at the back of the house, at the next visit on the way down, that would make for a good point to add to a short.
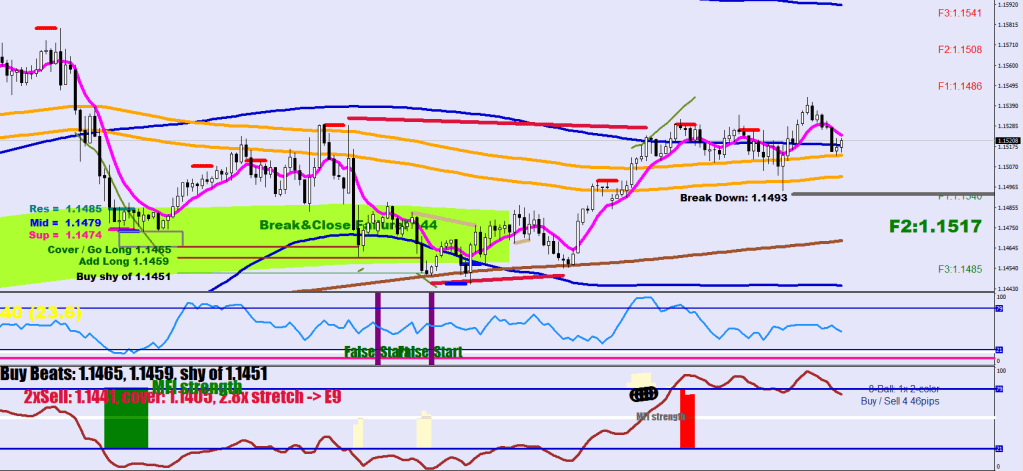
The move back up came from a deeply oversold condition, after a couple of false starts to the downside (the stochastic wasn’t ready to give much).
The holding up / peg was most likely an opex-optimized robbery.
Lastly, for all the Euro (&GBP) news, the bar is raised (making it easier to miss) and the Dollar news has discounted targets on Monday, nurturing a Dollar rally environment.