
1. Open the chart of the instrument you want to be gauging for.
2. Switch to 30 Minutes
3. Plot a Kijun-sen by adding Ichimoku indicator to the chart
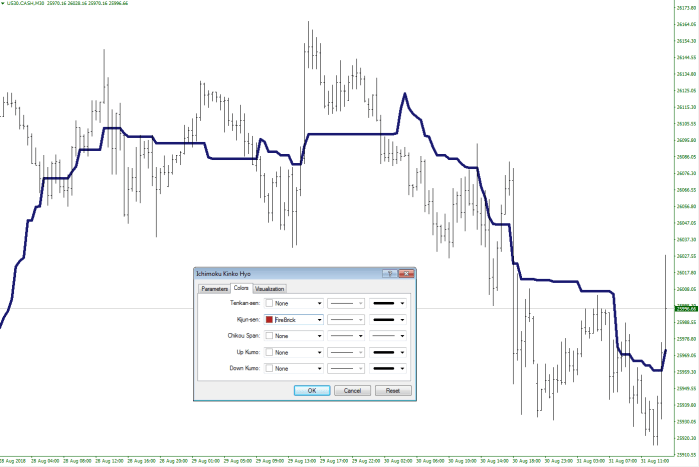
(you can flag None for all the other items, so they don’t get displayed)
4. Find periods where the Kijun-sen runs flat
5. Click on the target marker (crosshair) icon
6. Start measuring where the Kijun-sen has been flat for 3+ periods and price seems to be finding resistance.
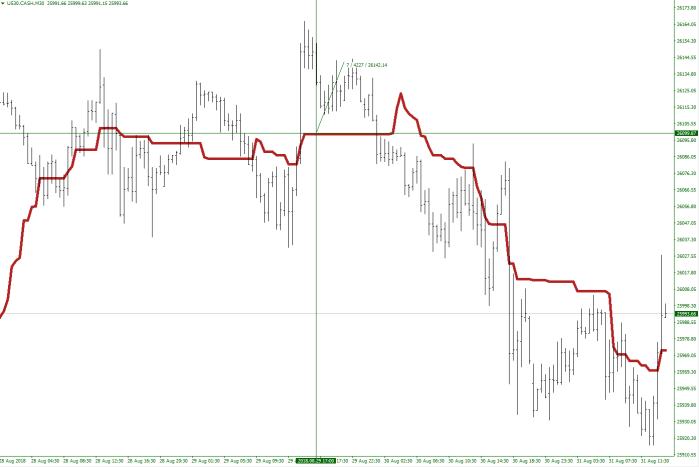
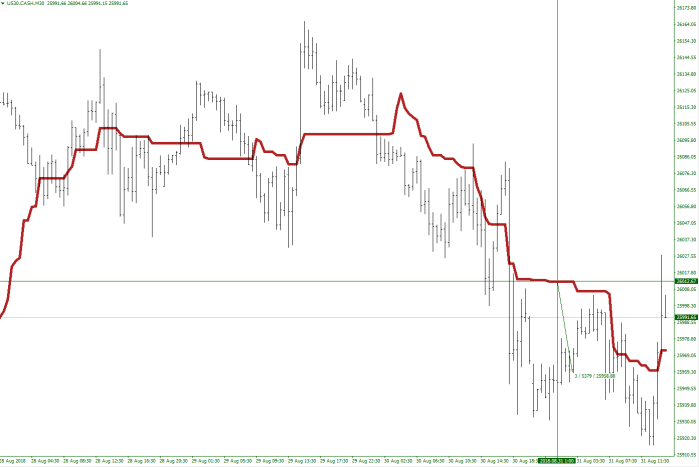
Based on the above readings, 1/2 of the fluctuation zone is somewhere between 42.00 and 53.00. With a few more measurements, I would conclude the FSize (Fluctuation Zone Size) to be 51.00×2= 102
