
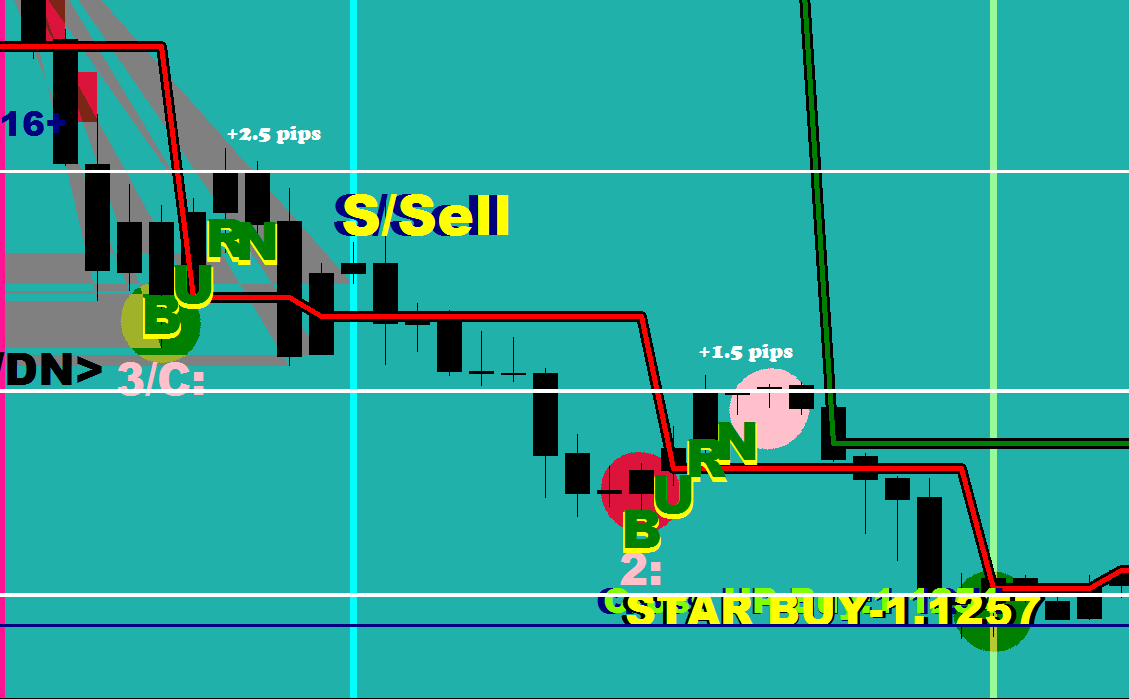
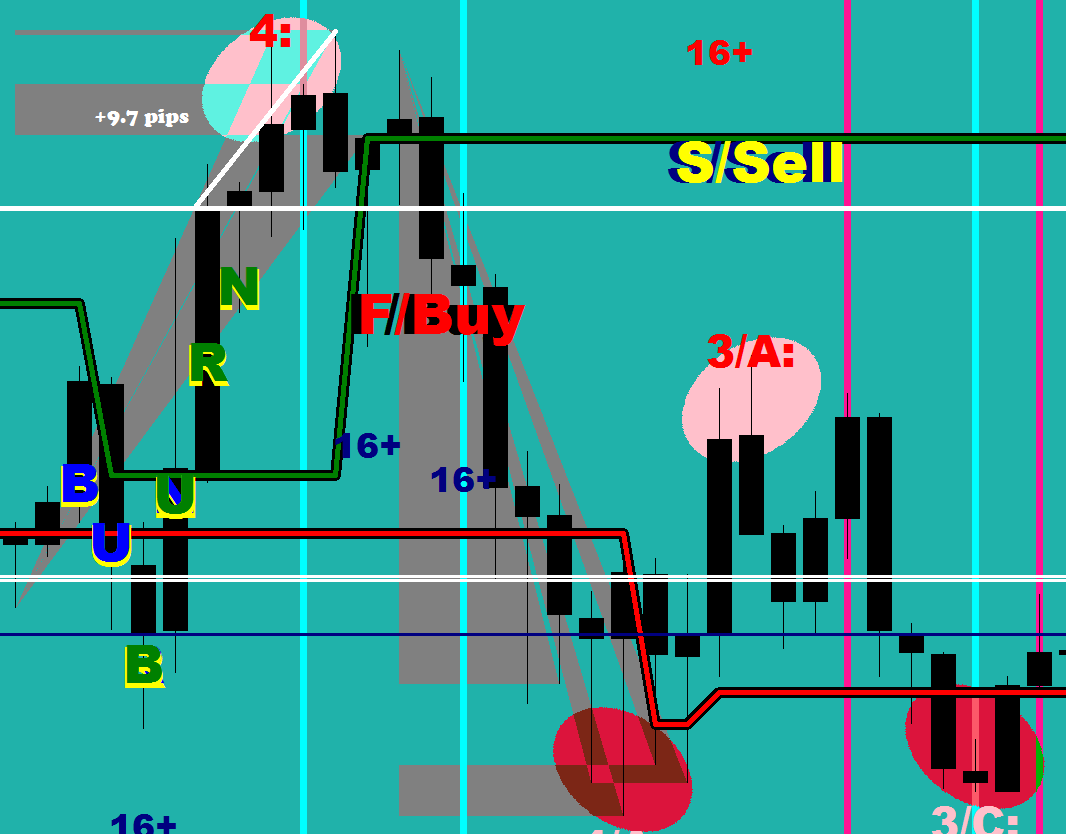
- Sell above a burn to the upside
above white line & target a lower low - Sell failure/ricochet at Mr. Maroon
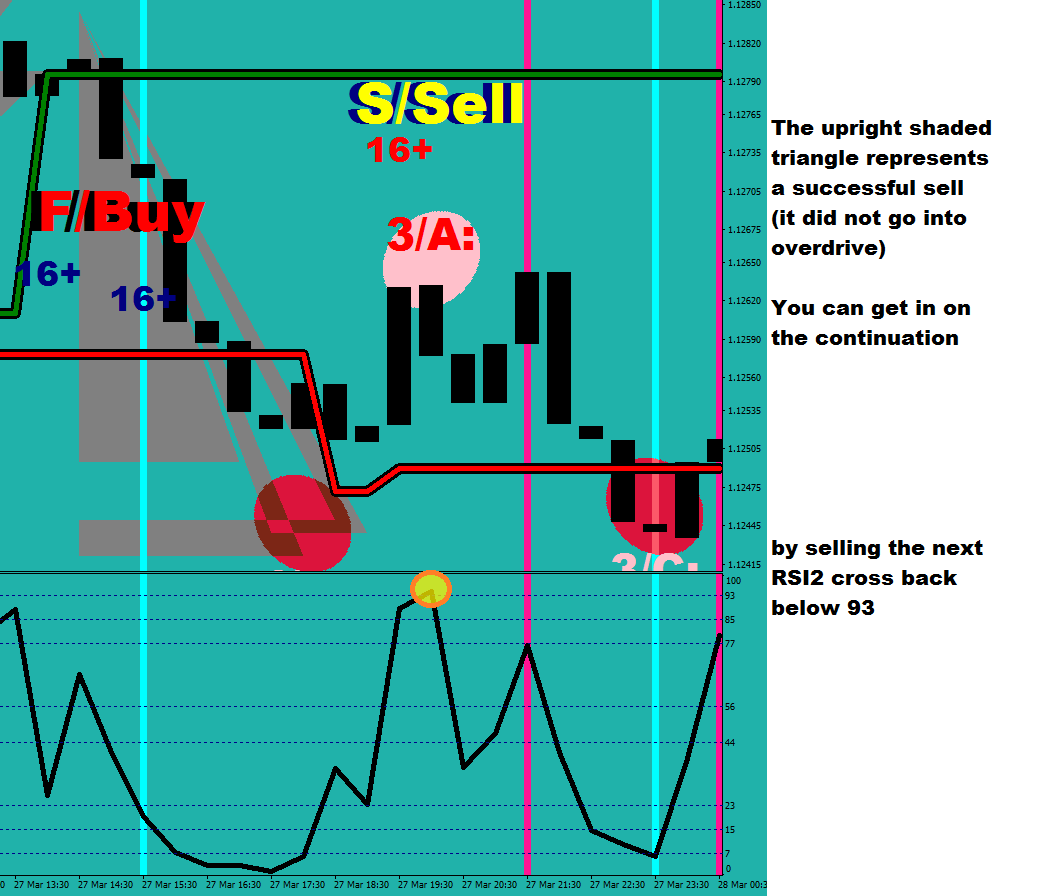
- Sell after a successful sell
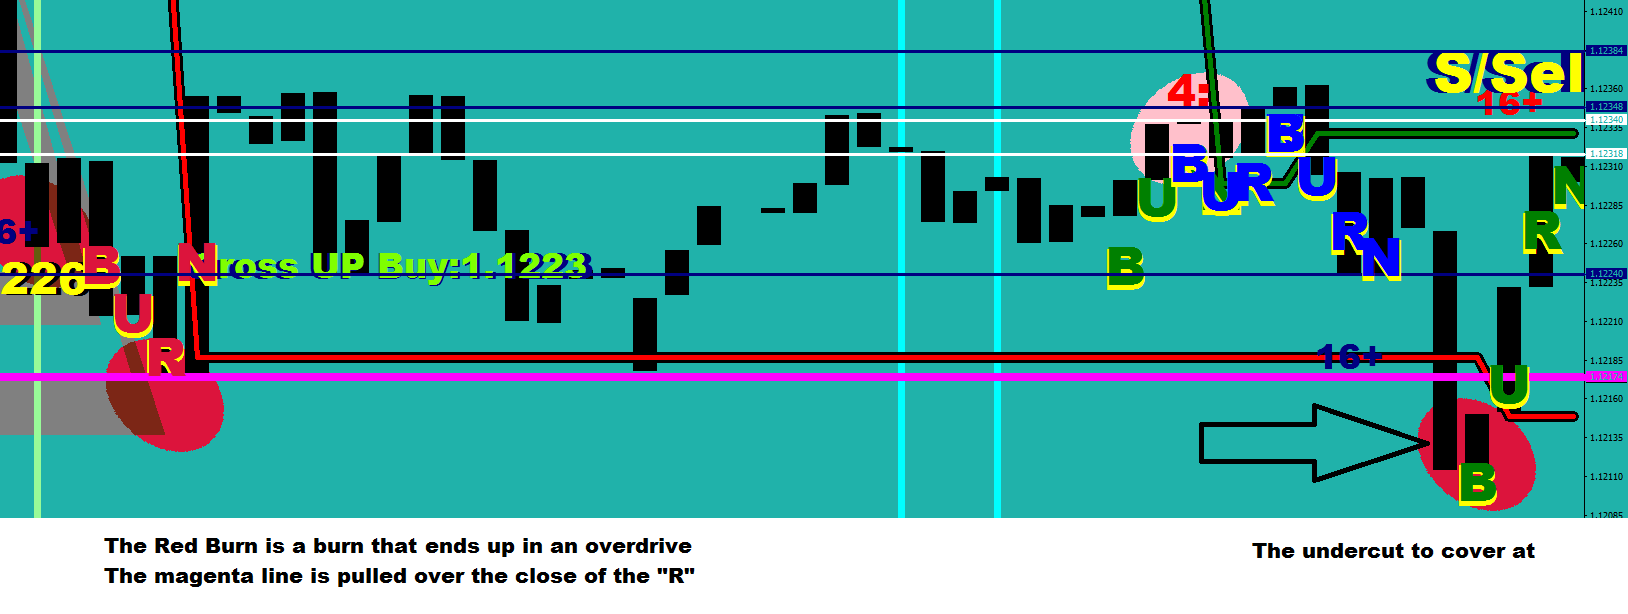
- Cover upon undercut of a Red Burn (overdrive)
- Cover upon successful buy, preferably in the oversold
1)

2)

3)
4)
5)
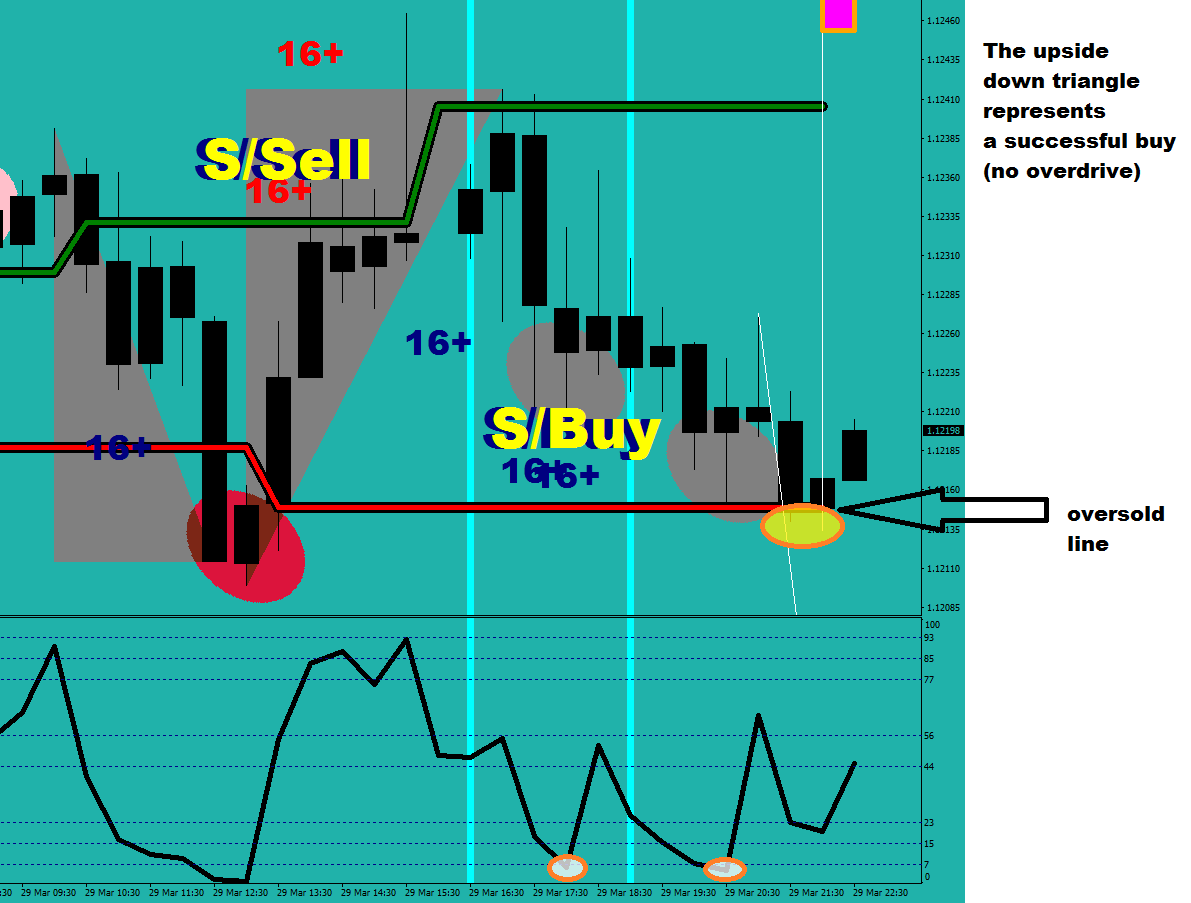
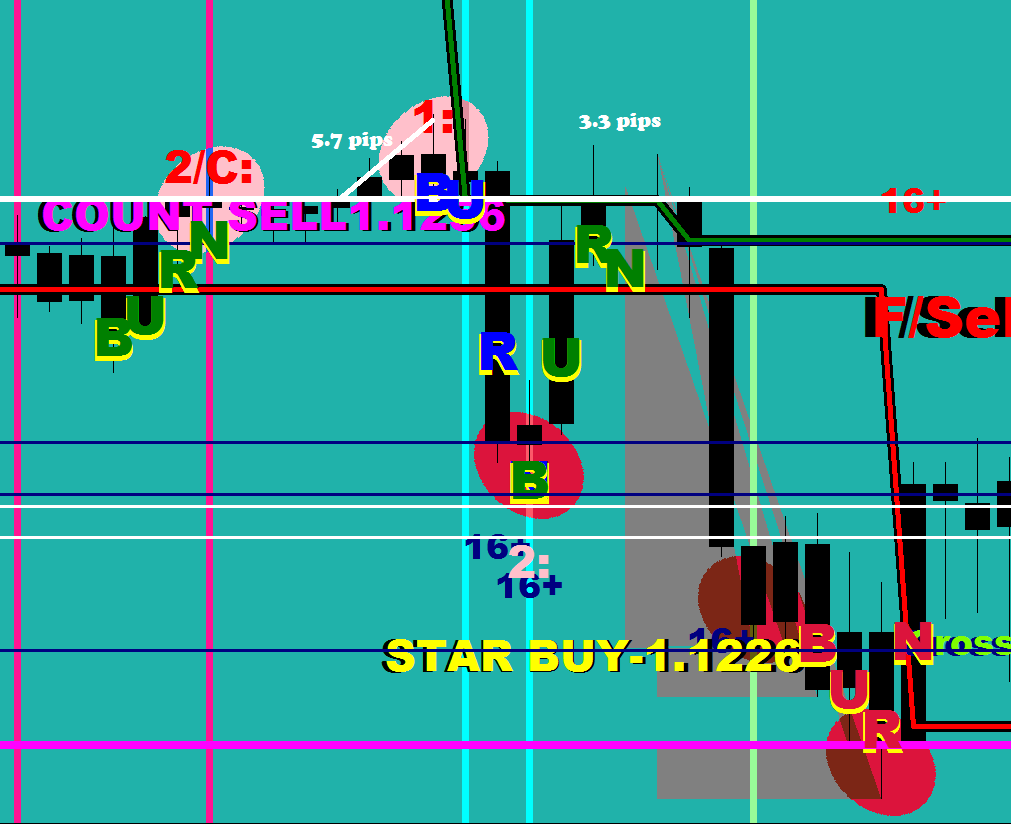
The Triangles and the corresponding labels, the overbought/oversold lines, the BURN plots (along with the R lines) are all part of Wishing On a Star V1.2 (the indicator) which is available for a price (haven’t figured it yet).
MR. Maroon is included in the LEMA30N – part of the package coming with the purchase of the E-book, “Computer Aided Trading” to be released in the following days.
As an insight, a burn plot goes something like this –
ExtUpFractalsBuffer[i+4]!=EMPTY_VALUE && High[i+4]>iHigh(Symbol(),0,iHighest(Symbol(),0,MODE_HIGH,8,i+5)) && High[i+4]-Low[i+1]>FSize/2*Point && Low[i]>Low[i+1] && Low[i+3]<Low[i+4] && Low[i+2]<Low[i+3]
– but it would not be worth as much if I did not figure a way to start plotting while the 3rd candle is being printed (real time) – and of course, I did.

The oversold/overbought levels are adjusted to my modified fractals idea.

Green Burns were exceeded by – stats
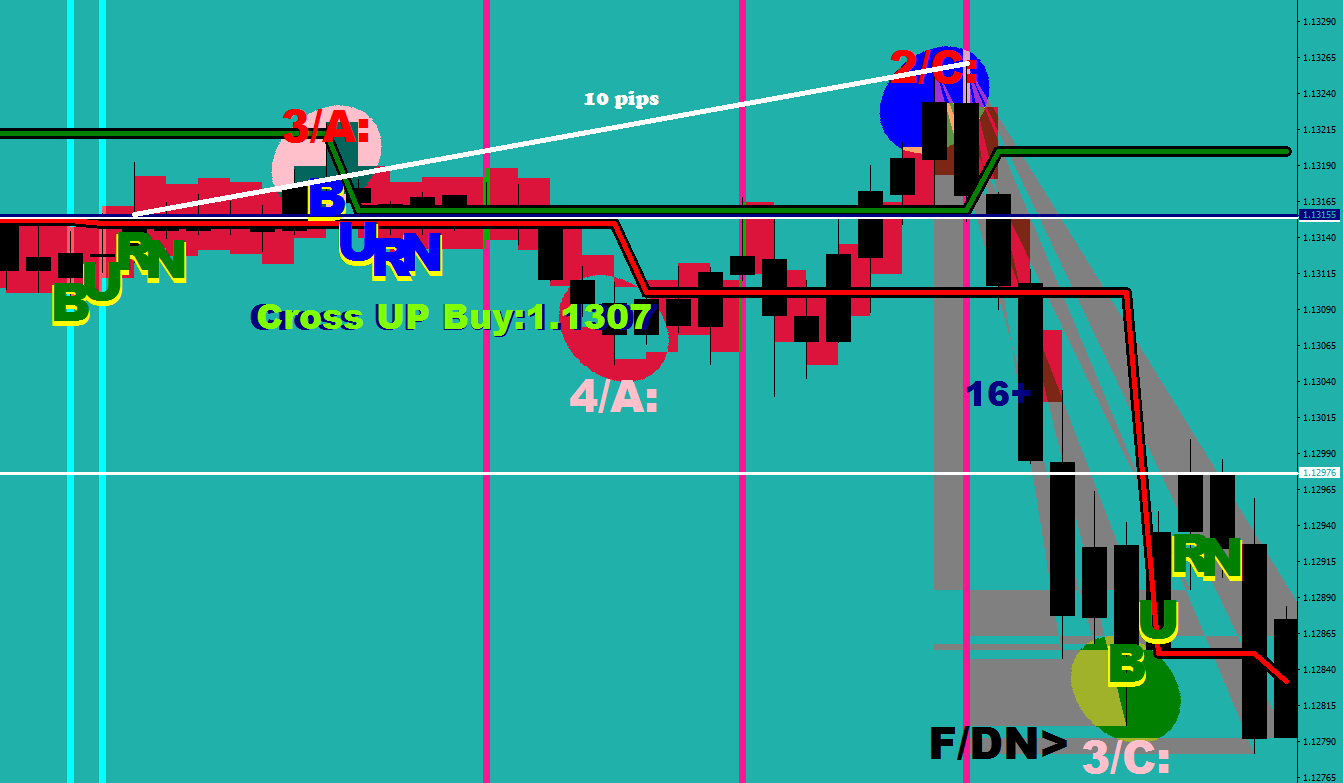
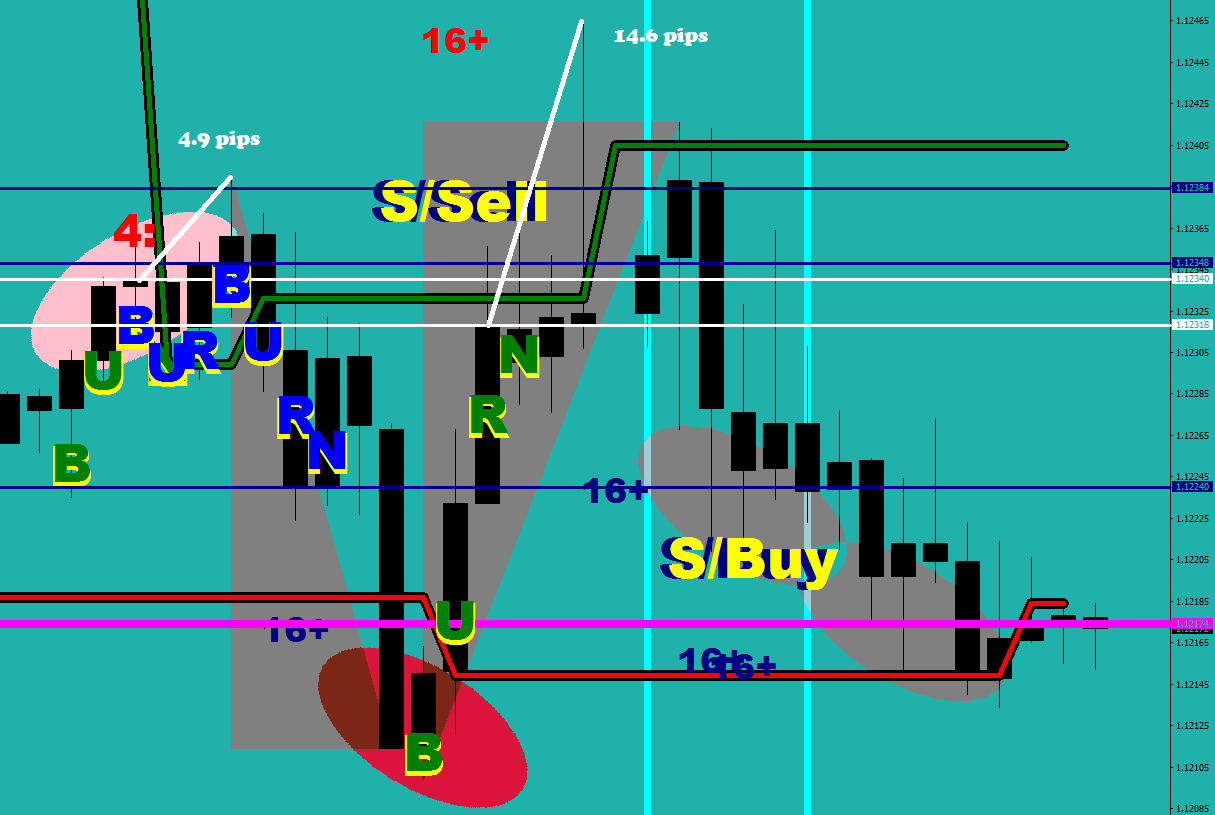
The minimum closest drop was 18.4 pips measured from the R’s entry line.
