Let’s talk about numbers first.
To participate in power trading, you would need high leverage.
1:500 would do.
Scaling in can help you witha good average price.
I would normally not trust more than 7.5 lots on an auto-trading routine (given a 5k account), but under exceptional circumstances, like for the sake of this maximum achievement – power play competition, I may open 11 lots and on rare occasions a little more.
With the above mentioned account leverage, after maxing out the account, you should be able to double the balance on a 40-pip move (on a 1:1000 account you would need even less travel). This would normally mean a wave 3, for your target exceeds the Fluctuation Maximum.
I do realize that at some point someone would set the record below 30 minutes; when the stars align right, this becomes possible.
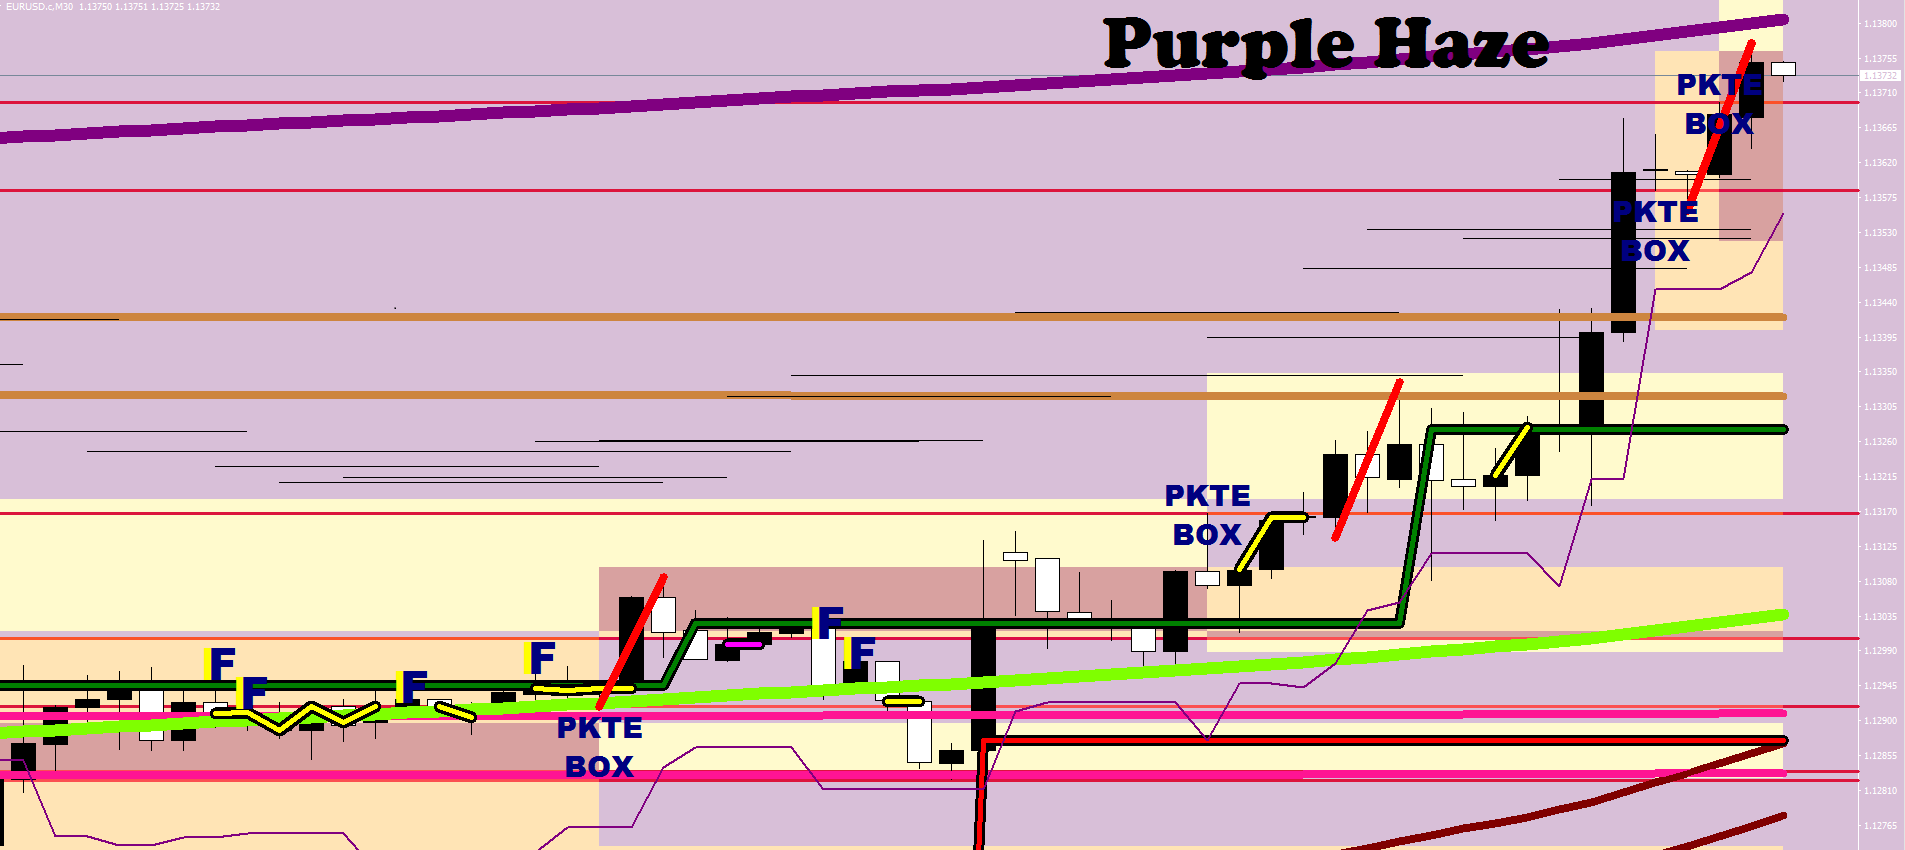
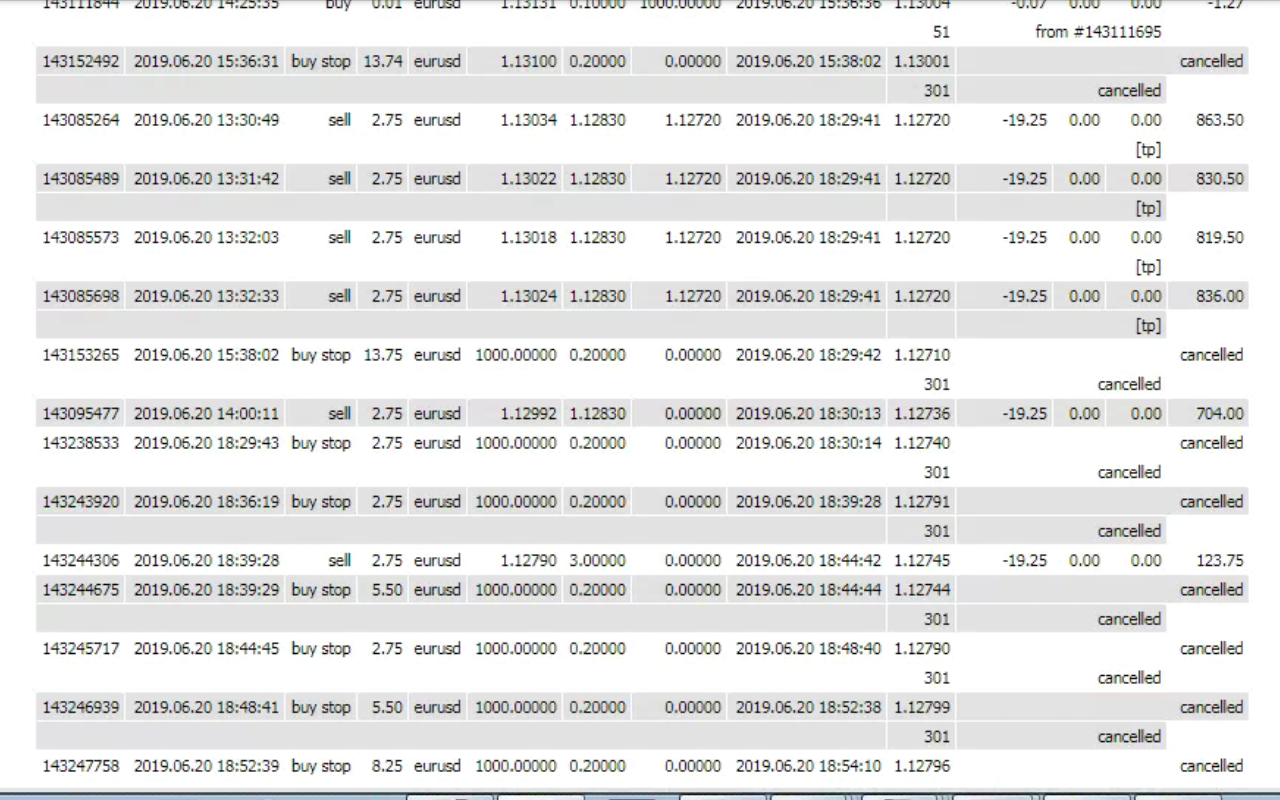
Here is a 31-pip travel in 5 hours generating 81% returns from yesterday.
What you would need for this sport first and foremost is the ability of interpreting what the market is doing currently with high accuracy.
The rest of this post would be the article I started typing under the title

To catch a mocking turn
In order not to bleed out on a turning progress and not to be hedged in the worst possible place, you need to be conscious of what and how can happen to have a trading blue print at hand.
1st step is learn where and under what circumpstances the market is prone to turn around.
Have a checklist and know it by heart.
Since wave 5 isn’t over till it’s over, it is possible to see multiple red tails showing up and additional higher highs / lower lows until the music is on.
The right thinking?
Know your total maximum size, and how many chunks you are willing to cut it up to.
Know the instrument’s fluctuation maximum. Placace a protective hedge stop order Fluctuation Maximum + a little away from the end of the last red tail.
EUR/USD: 38+4 = 42 pips out.
Divide the Fluctuation Maximum by your maximum position number to arrive at the pacing you would have to maintain between the opens.
38 / 6 = 6 pips distance
Your maximum size divided by the maximum position number = individual opening size.
5k account, 1:500 leverage, max overdirve 14 lots – open 2.25 lot sizes.
Open the first position 1 pip beyond the red tail, and put out the rest of the stack with your spacing size in between.
Ripe conditions for a price reversal
1. Sufficient stretch from the Mean
2. 4H is strong trending / exhaustion
3. Red tail event
4. 26-sample new low / 46-sample new high
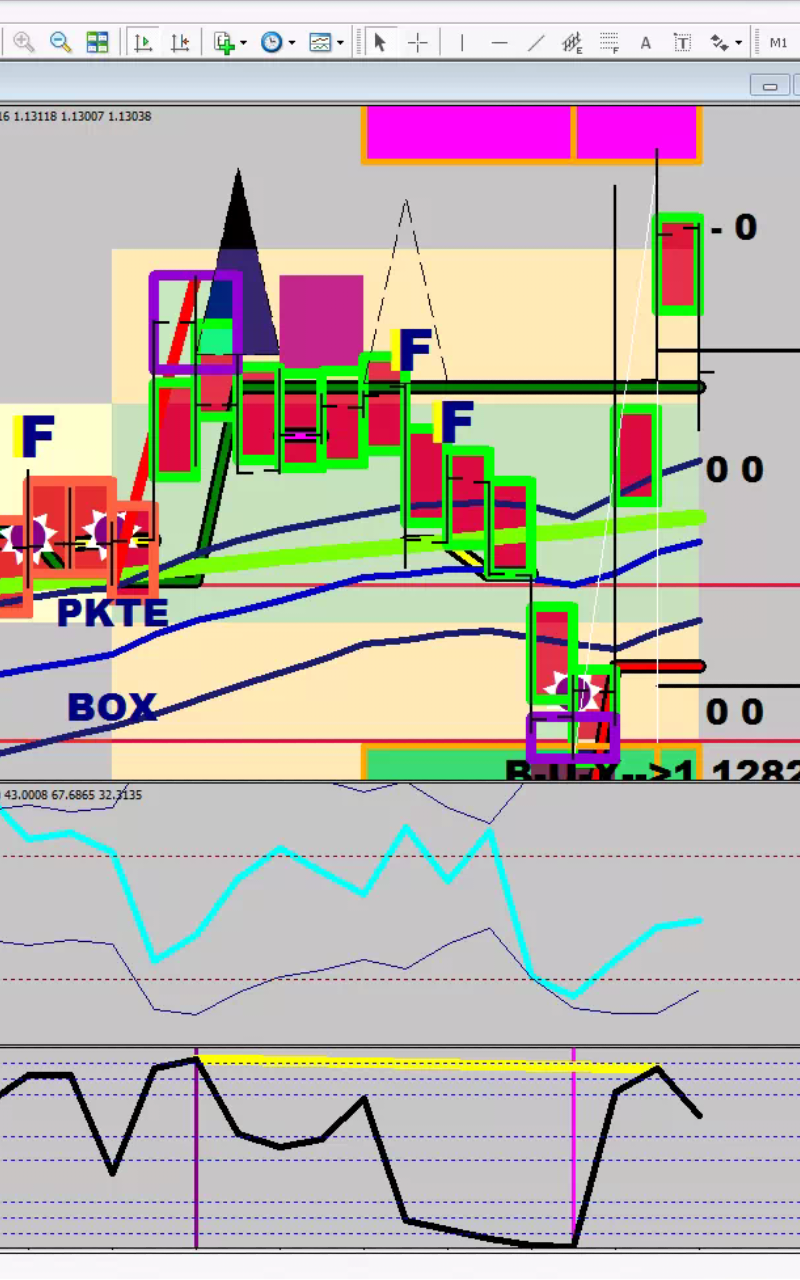
Squaring:
It could come in handy to plot exhaustion levels: closing out your positions in gains may turn out to be fruitful in obtaining a weight further out (and yield some extra cash). The squaring levels are the exhaustion highs / lows and the ends of the red tails. (Red horizontal lines on the image).
Footnotes:
There is no wave 1 until the price manages to cross to the other side of Mr. Maroon. Therefore after wave 5 of wave 5, you either get mere structureless
fluctuation or an ABC correction that would ultimately fall short of Mr. Maroon’s dark side.
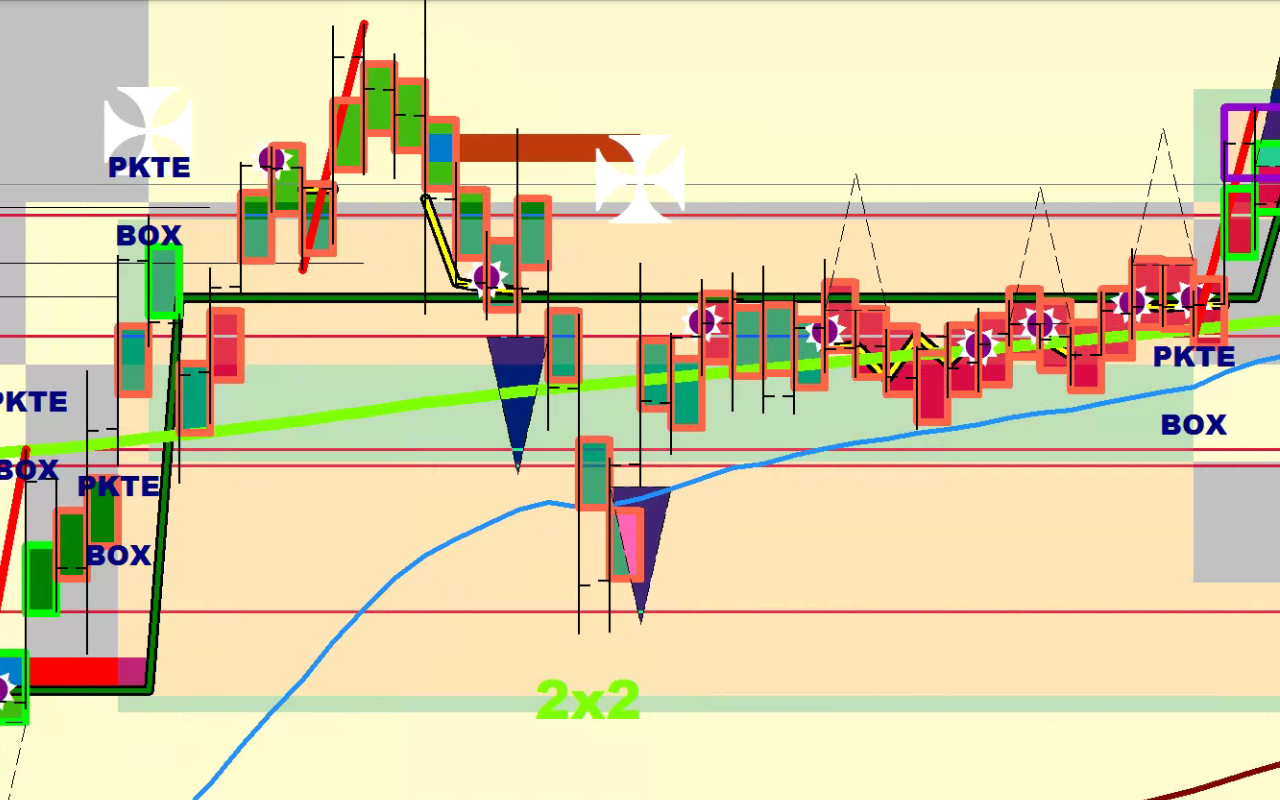
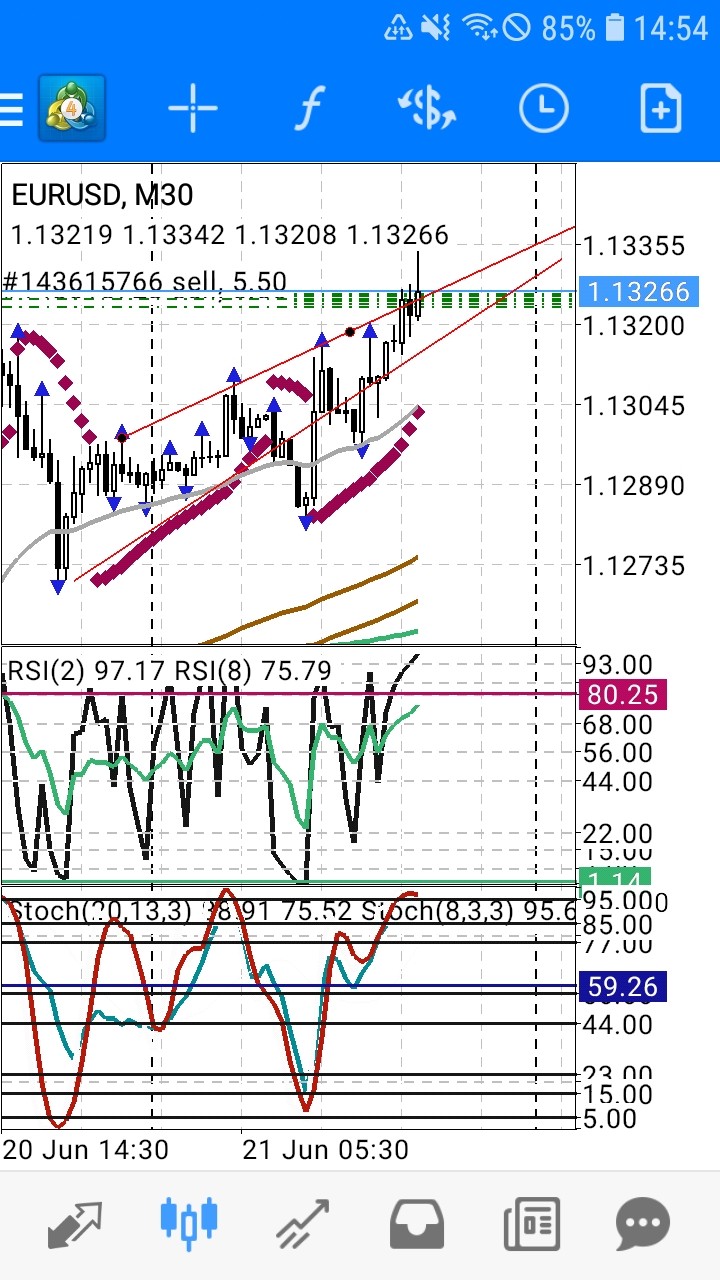
A wave B ends in an RSI2 divergence. On the image below the purple thin line shows the measuring leg that is connected to the divergent leg by the yellow line.
So what is happening in these B waves that makes them go on seemingly forever? More than anything this has to do with the price location: in Bull Zone 1 the bull is trading with the other bull, half of them are covering upon realizing that they won’t get paid here, the other half is going long even more. This is not the place to forge a rally from.
Other than getting the exit value perfect on the mentioned 80% run I sucked balls all along.
I happen to be my own worst student, and so I do need to read things out loud for myself. This blog is a selfish thing as such.
Now I need to figure an unrecognized server name issue on my phone.
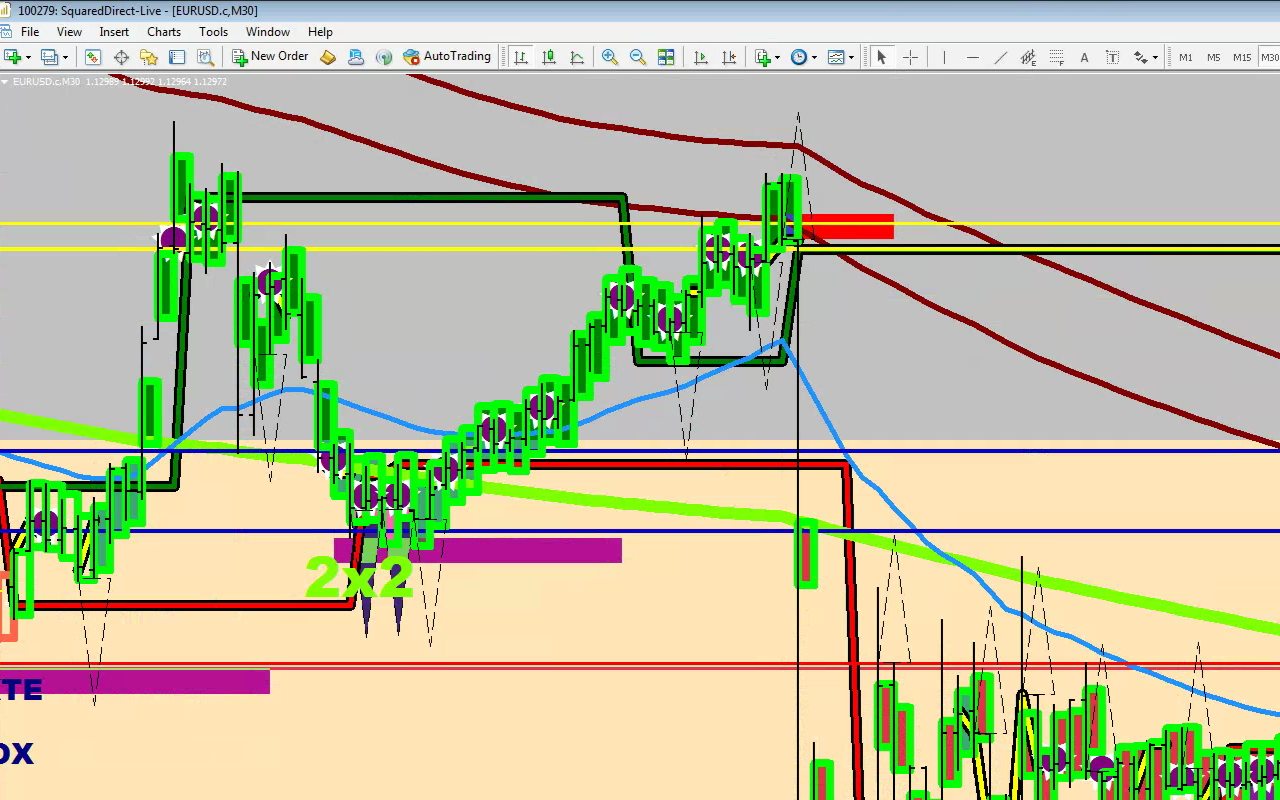
Picture: Wave B wedge breaking in the wrong direction first (hitting a liquidity void)
In addition to the above:
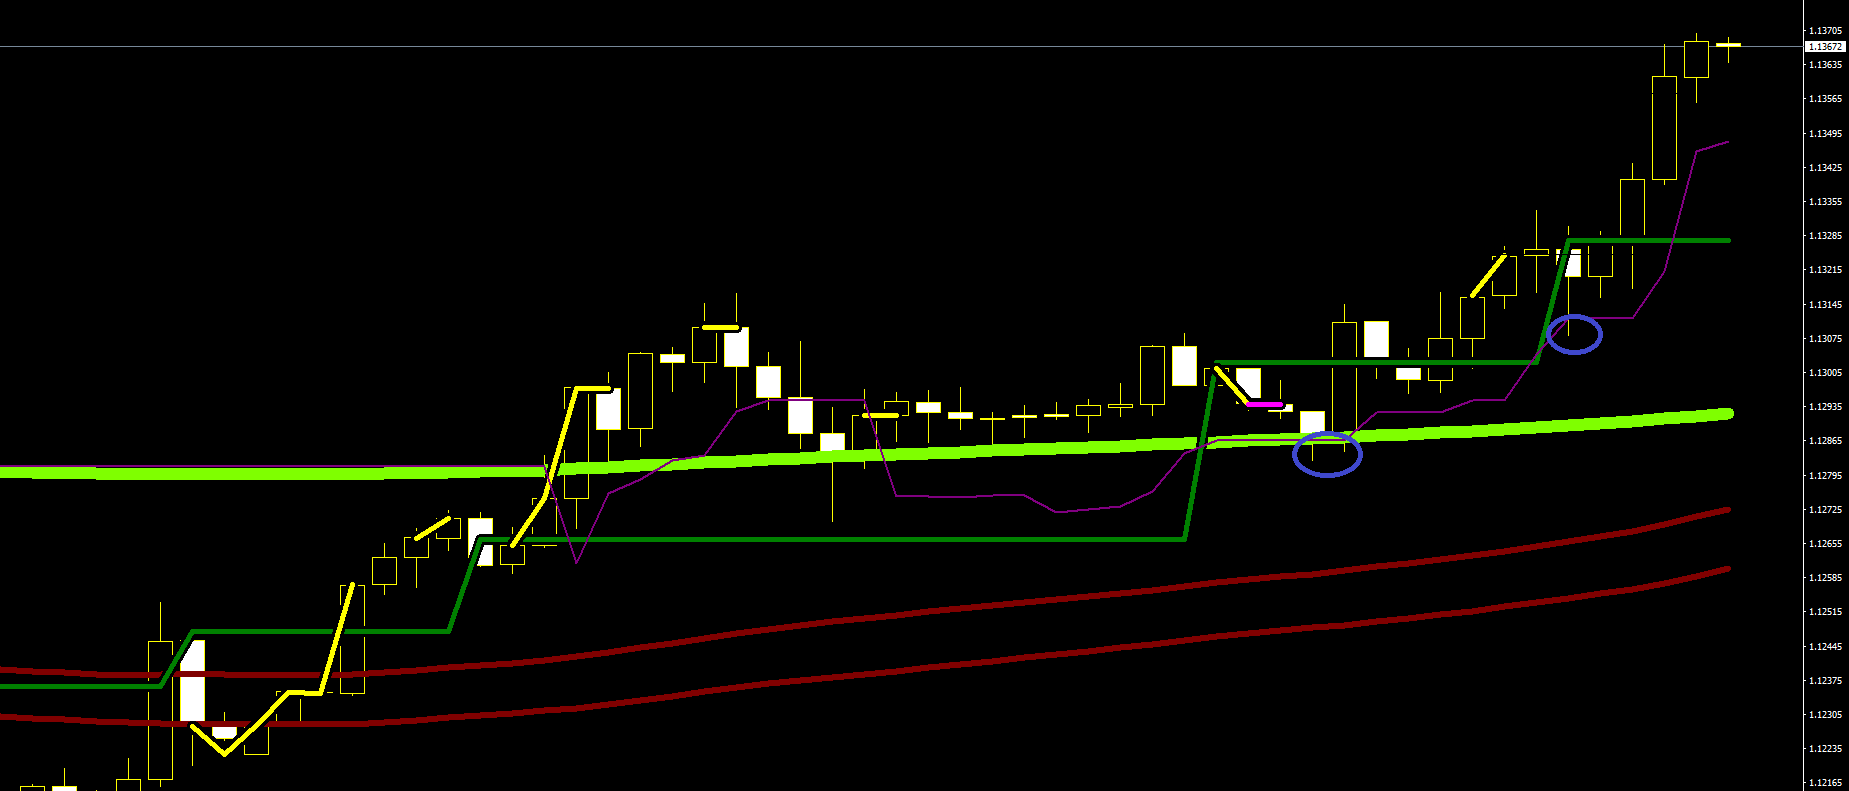
Looks like the break was merely a wave 4, not an A. There is always a possibility that you are looking at a wave 4 when the market pulls back to the Water Line.
When price has exceeded the upper guard rail, and is in the Bull Zone 1, there is a new game called Catch 22 that can goose the price to the next mile stone, the Purple Haze.
Every time the price dips 22 pips from the most recent high, there is an opportunity to make or break the market. Habet or non habet.
It is a relatively low cost way to inflicting additional pain, kind of like throwing a log on the embers.