
A daily practice
Pull up the daily chart, and tell me:
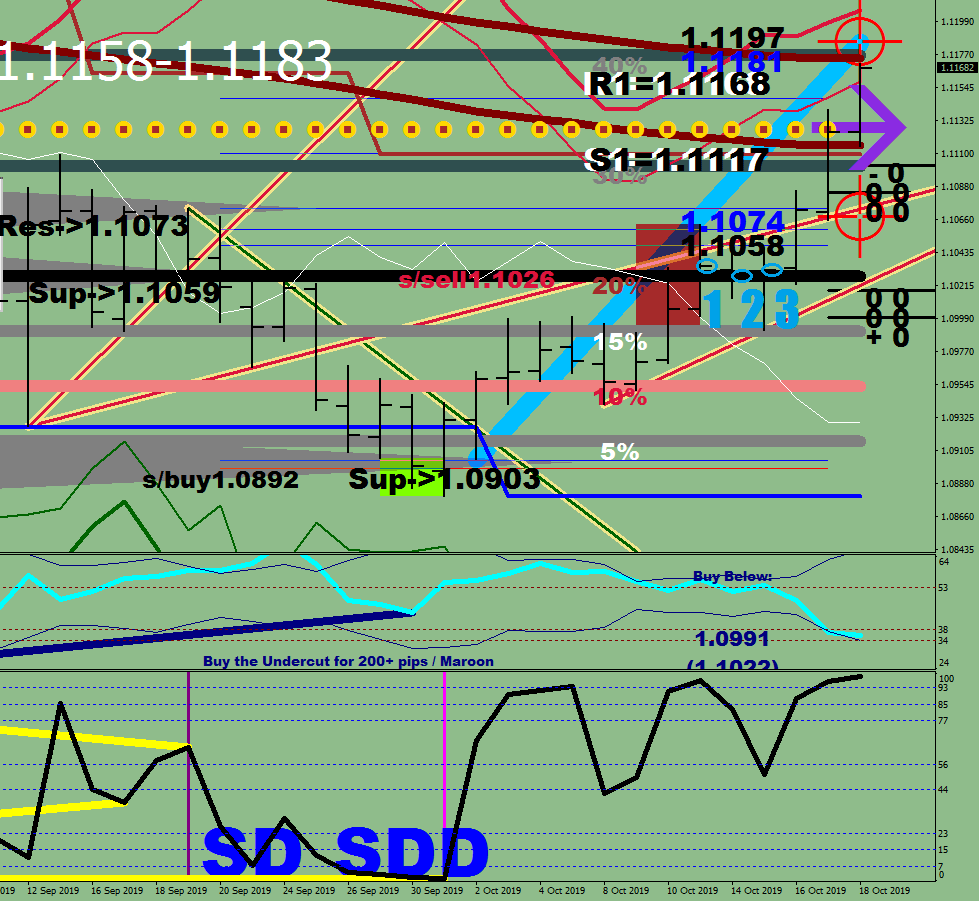
- Where was the last broken trend line? What does that mean for the current direction?
- How Far can you go in that direction? (Energy Bands)
- How Far would the daily fuel limit support the move without trending?
- What wave are you in? Whoop, Bam or Boogie?
- Talk about the interactions with the comfort levels
- How does the market behave around overbought / oversold? – does it stay embedded? = Trending
- Was there any volatility breach on the CI? Has the outside value it been beat for a reversal to take place?
Pull up the 30-minute chart and talk about it
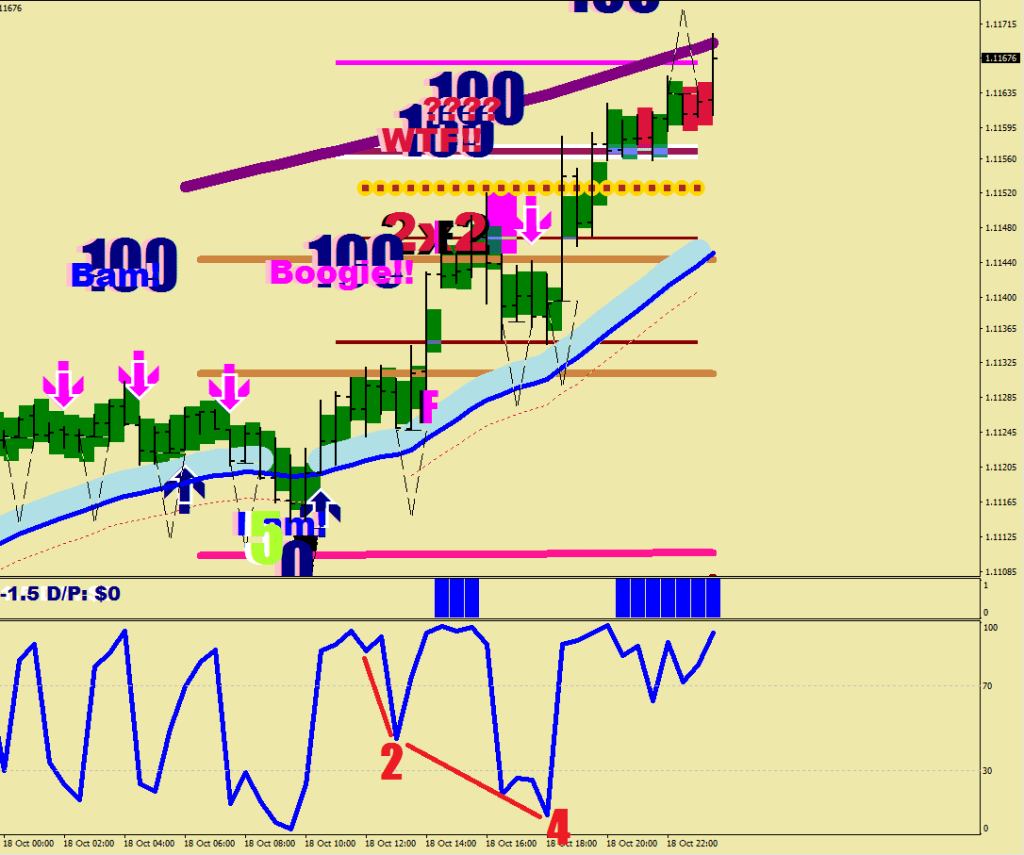
- What market segment are you in? (Neutral, Bear Zone 1, 2 or Bull Zone 1,2)
- If the market is trending or is in Bear / Bull Zone, you should fade the attacks on the E-16 if the Purple Haze hasn’t been attacked twice.
- What are the last Boogie Fail lines (4, 16, 26 and 36 pips out)?
- Stochastic bars… Do they show a head by not being present on the last run?
- Can you spot the last two continuation divergences on the RSI2? Wave 2 and Wave 4 end points?
- If you have holdings not aligned with the direction you must hedge / over compensate 2-pips above the high / 2-pips below the arrow of a counter-directional arrow and hold
Pull up the hourly chart, and talk about it
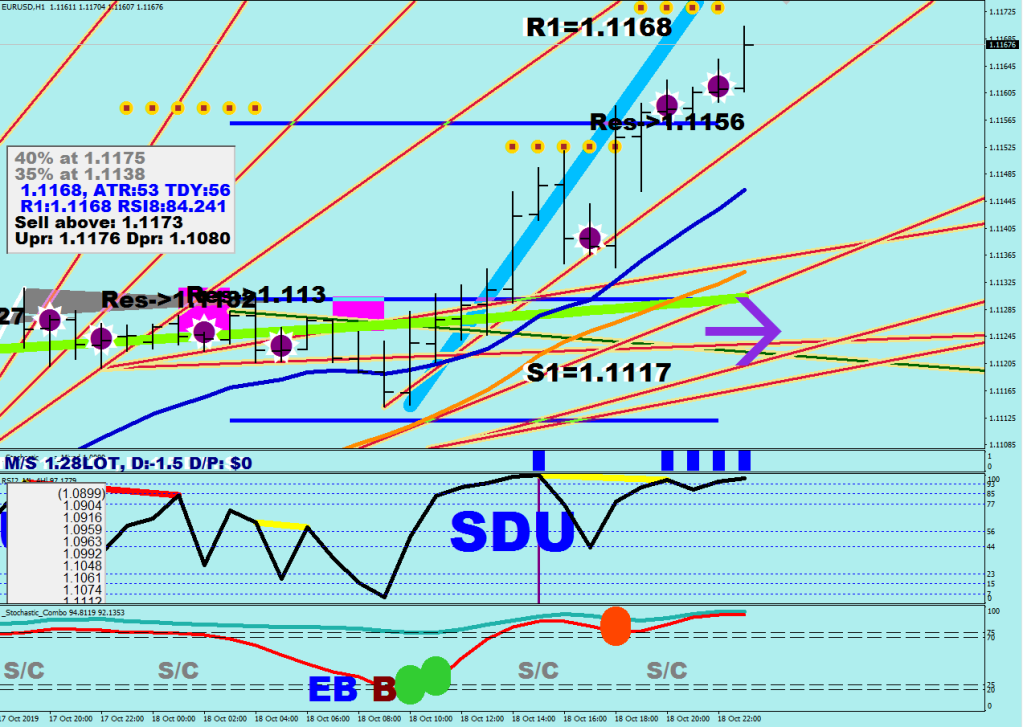
- What are the 4H support and resistance numbers (Comfort levels)?
- Are the mid-term memory support levels mostly above or below?
- What is your suggested maximum naked risk size?
- What is the current balance of your holdings?
- The stochastic combo is your timer for getting in on the direction (is the 30-sample D embedded?)
- The conditional buys / sells (s/c, b/c) need fine tuning by the use of a 30-minute chart
