
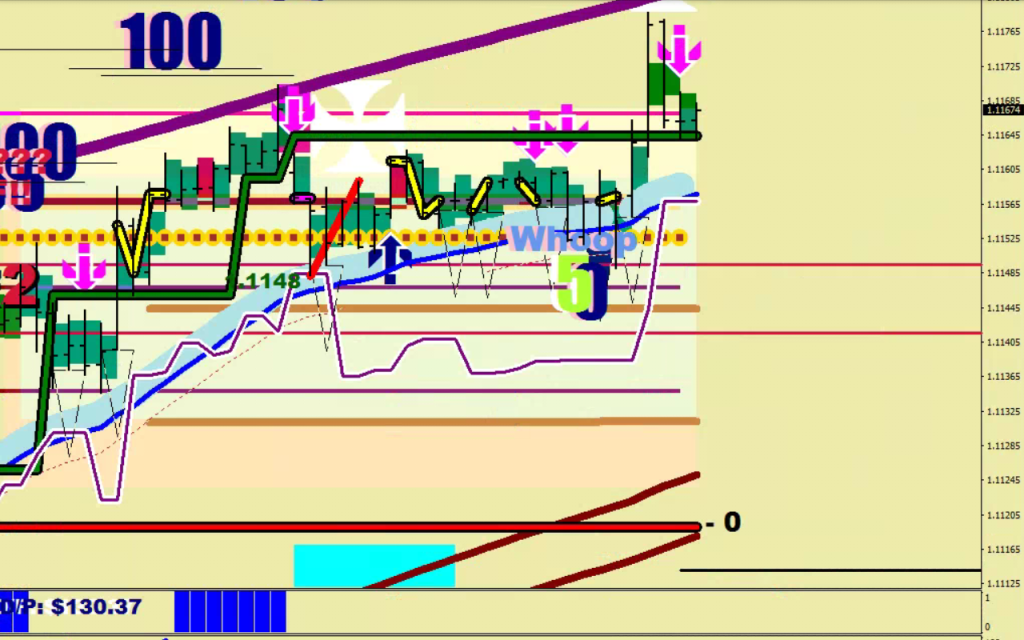
So, you just had seen a wave 5 of a Wave 5 transpired. Or did you?
Bear in mind, that your wave counting might be off, and what you thought was the end of Wave 5 was merely the end of wave 3 of Wave 5. Then, there was a continuation divergence printed by the bulls.
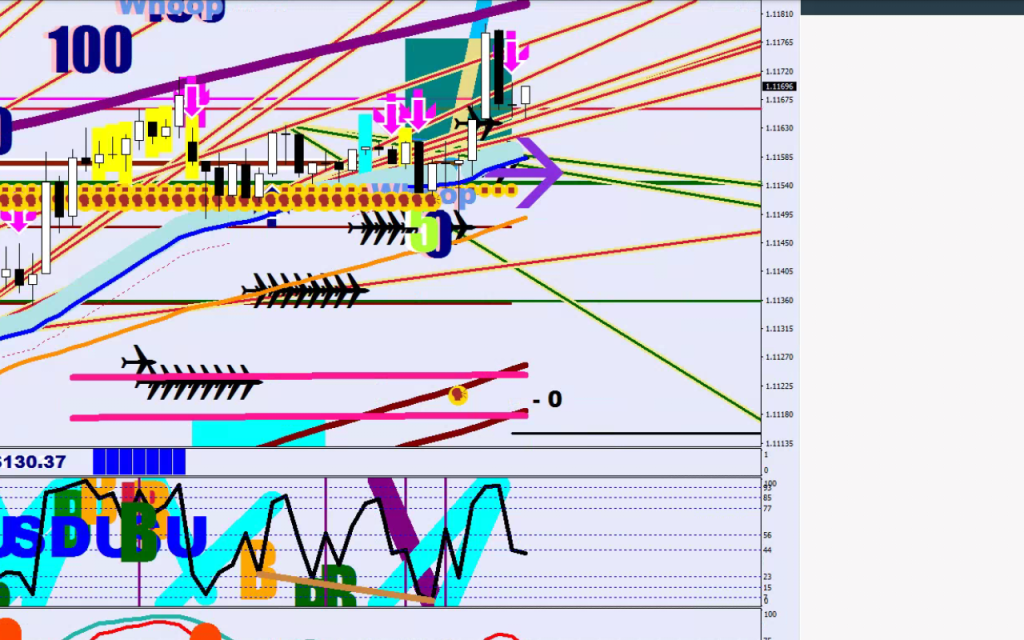
I was trying to suggest with my last article that the “head” you are looking for…
…would likely show up as a miss on your stochastic bars, and another clue to the final burn could be the length of it: it is likely going to be 1.5-2 hours altogether that would very likely arrive with a higher high / lower low depending on the direction (red/orange tail). A pullback to E-16 should always be a suspect of a wave 4.
Therefore, coming into today you could had said, that the head was missing, and so was the final burn.
This in itself is a viable trading plan.
- A market does not end on a high note – I’m pretty sure I have said this before somewhere.
Can you spot what you cannot see on the last un up resulting in a higher high?
My most downloaded indicator is the 36 Only. This upper plot puts butterfly marks on potential heads based on the miss – turned an admiral cross as of late.
