This would had been my advice a decade ago to myself when I started trading.
I will walk you through how I knew exactly (for the most part) what wave was the market in today.
Two days ago, when I was mad wrong, I was refusing to acknowledge this 5-wave structure down as valid, for the 5th Wave seemed to have fallen so shy of the low made during the 3rd.

Nonetheless, this was right. What was particularly hard to digest was the fact that the market made a turn back up without a qualified footing: it never even got close to the Bear Zone to have the chance to do so.
Yet, thanks to the news, someone went in shorts to some irrational extent that temporarily suspended the possibility of further progression downwards -> the top would be re-tested.
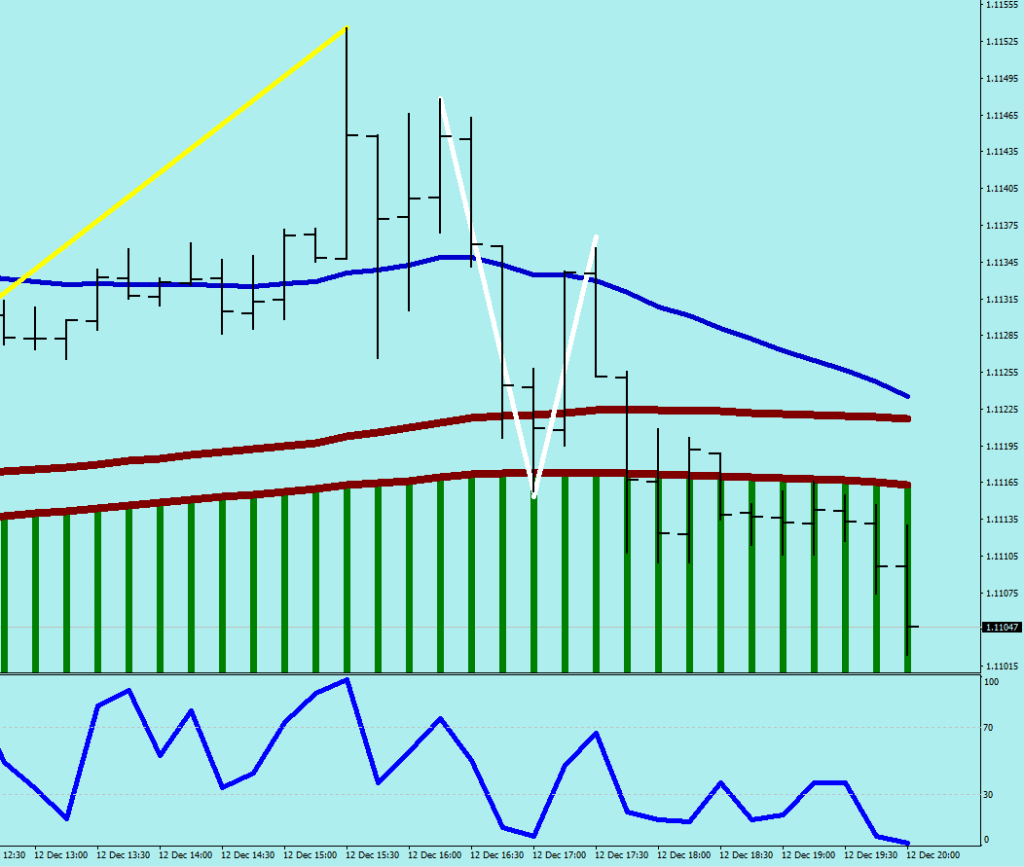
Now, once these 5 Waves were figured out, on the 1H you would be able to spot something no one ever talks about (other than me): the volatility whip. It is marked in white; they usually appear after a 5th wave, and although the price fluctuates a bit from the starting point to the end point, they do not become part of the wave structure, they are the free ball thrown up over the net waiting for the first team to jump on it.
There are tremendous implications to this (shout out to Mr. Elliott), and it is more than shocking that a Wave 2 up can go way beyond the starting point of Wave 1, but this is how things are.
To add some more shocking ripples down the spine, here are other facts nobody even considers.
There is no Wave 1 or Wave 2 without the approval of the Market Maker.
See, all they have to do is stop giving fills until they manage to dish out their surplus in one direction.
I’ve been saying that they are hiding behind Mr. Maroon, which is the 135 EMA HIGH and LOW on the 30 min – or for less smooth results turn to E17 on the 4H.
For a Wave 1 to be validated, two things has to happen:
- The Market Makers must let it cross the wall of their stronghold
- The Volatility Whip’s terminal must be broken decidedly
There are other simple rules to be found, such as, the wave structure would only make progress if Mr. Maroon gets violated by the first wave.
Now, you can probably start to appreciate why did I adjust my targets on my shorts to 1.1070 on the way down, in Wave 1: because the low point of the RSI divergence’s measuring leg had a low of 1.10788.

No, I did not wait for any one of these to go to target, but the lesson here is about the right thinking (that can make a world of difference). You can be right, have low self esteem and still make plenty of money.
Which brings me to my last point.
Before the FOMC, Wave 1 and Wave 2 were printed. How many directions could had gone the 3rd Wave?

If you really think that a news event like this can have a not already decided outcome, then wake up & smell the coffee.
How not to F up the bias?
I thought about this a bit after the FOMC.
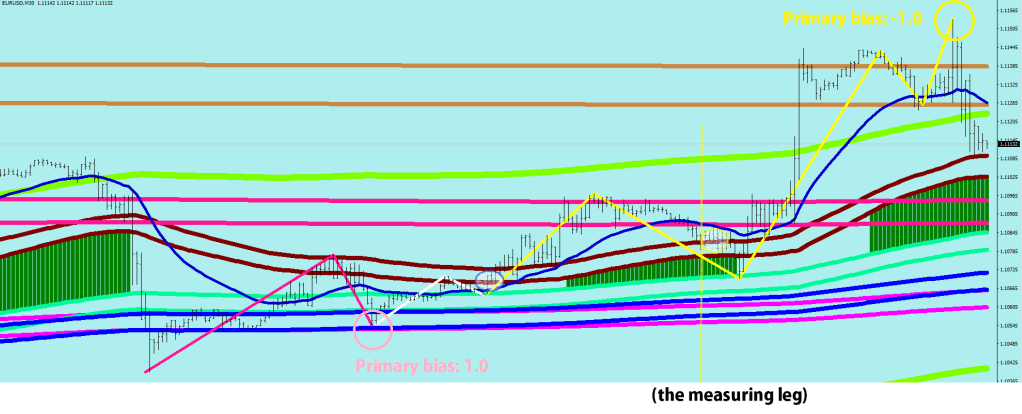
If you were to use two bias numbers, you could get a good picture of which way the market & accordingly the wave count would be unfolding.
Refer to the cyan chart-shot above.
When you had your 5th wave, the primary bias was set.
1.0 means – up & away, -1.0 means down, down and down some more.
The secondary bias would come from price being above the Green River or below (414 EMA per 30 min) cca 52 EMA per 4H.
The range of the secondary score would be 0.25 to – 0.25
And the change would occur if price just went over the Green River – turning it to 0, and the quarter bias would be supplied by after a cross over making a new 4-hour RSI2 oversold / overbought print. For instance, if price slips below the 52 EMA and stays there, becomes hourly overbought, then you just set the secondary bias to -0.25
From all written above it is clear to see that a mean reversion would always be happening with a + – 0.75 score – and there is one in progress right now.

To answer the question, where would you be wrong about…
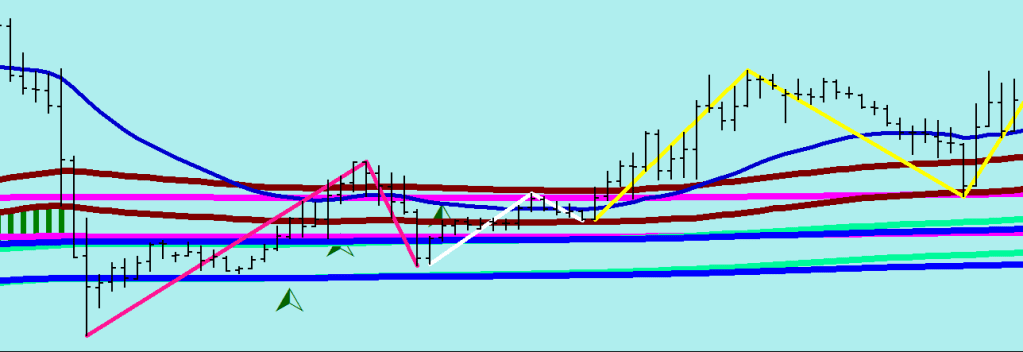
…being short in the bull zone – I now have the 31-pip displacement value in cyan printed with brackets (must go long above kind of thing).
…in case you are wondering where the Volatility Whip ended / Wave 1 started on the way down: