
The title is in reference to my previous entry, the Disappearing Volatility
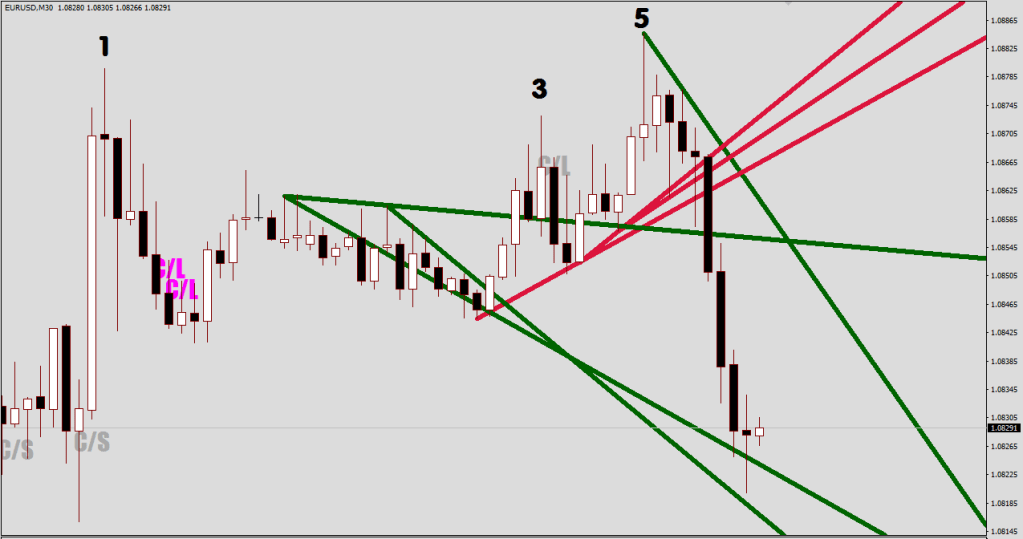
The picture below shows how my RSI2 Hedge routine can help figuring wave structure.

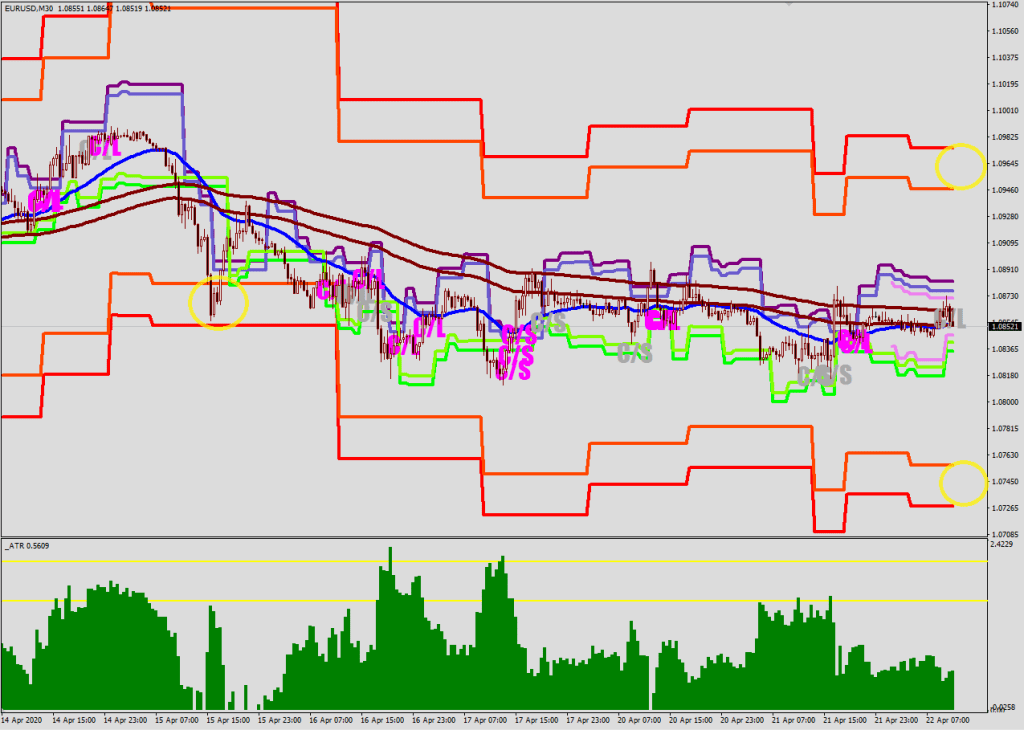
The slim purple 5 legs down were Wave 5 down followed by the Volatility Whip in yellow, and as you can see price is in Wave 3 to the upside (see the full lambda highlights in cyan), yet the price isn’t going anywhere. What is happening?
Is this a calm before a storm? Sure, but the magnitude of the next storm is a big question.
Please look at the following pictures to understand the severity of the volatility collapse.
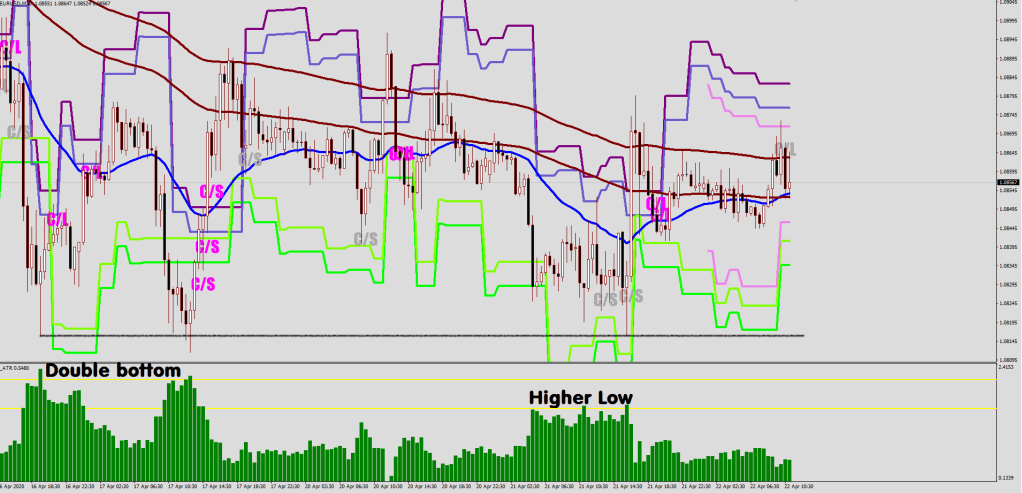
The straight line and the 3 touches on it is actually a double bottom and a closer low relative to the mean.
There hasn’t been a single day adding to the Average Daily True Range in weeks, and the last one that even came close to the rapidly dropping ATR was a week ago today, so it is no wonder that the ATR made its way back from 195 to 95, which is quite close to the all time average of about 85 pips, and would had been a normal read before Corona Time and even BrExit.
The bias based on these images is certainly up.
I am not a fundamental trader, but it is worth mentioning that the current break in volatility is due to the absence of unknown factors.
Yes, the ECB is printing money like crazy, but so does the FED, and if I had to guess, the FED would be outperforming in terms of weakening their currency.
Back to the charts. Recently every second downside exhaustion resulted in a reversion to the Mean.

This is again the opposite of what happens in a Bear Market when price seldom returns to the mean, and by then it would had made it to a 5-10x stretch from the mean. Currently price can’t seem to get away by more than 2x and bear zone 1 (from 1-3x stretch) is a buy for a mean reversion.
What would be the next event that would initiate the next volatility burst out? Who knows. It would have to be something that is unexpected, unknown, something that is not factored in. One more dip below the doji on the left, out of the blue, scoring in the energy band to kick start some volatility? Well, not before a Wave 5 is printed on the upside.

I know I’ll be buying. (To be able to milk volatility they would have to first get people on the wrong side, i.e. the first (big) move would be a fake out.)
Going out to be tested for Corona soon.
…
…
Slipping into oversold now & breaching support on a relative basis

…

