
Setting up the charts.
Gauge 1:
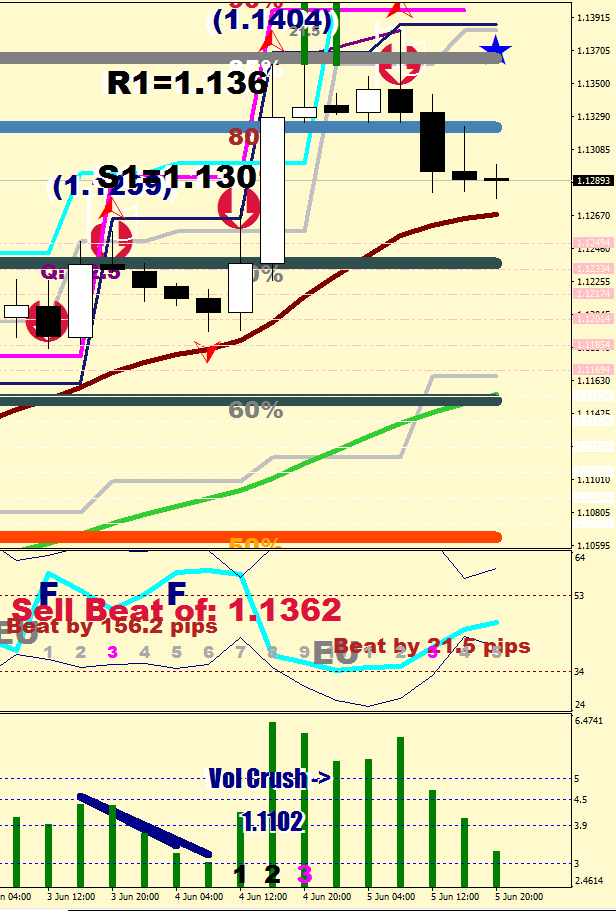
Weekly Comfort Levels
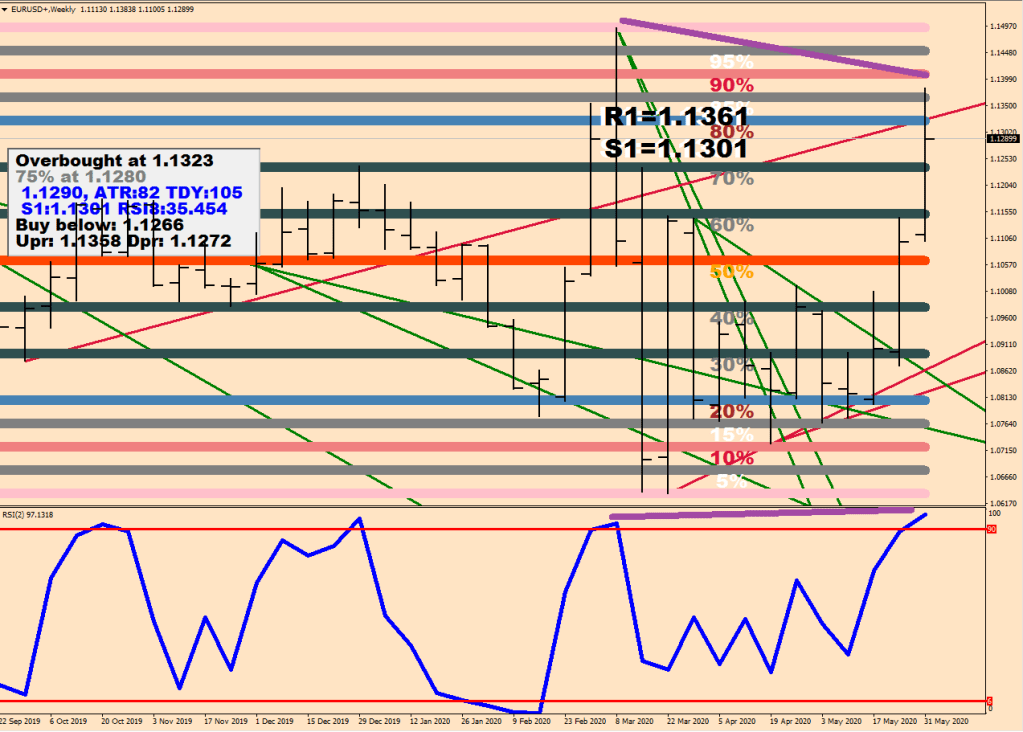
Lots of info here.
The last two weekly peaks show a continuation divergence down -> likely lower high. Does not mean that a slight beat of the recent high isn’t possible still. You can also see the reversal divergence between the last two lows made in the oversold area.
Support & resistance levels would be re-calibrated based on the last 15-min consolidation come Sunday night (with the new ATR), so ignore them for now.
Based on recent history, there would be another week making a try with the overbought zone, likely the one coming up just now.
The story is currently trying to sustain in the overbought zone, but that’s not a given at all.
Gauge 2:
4H
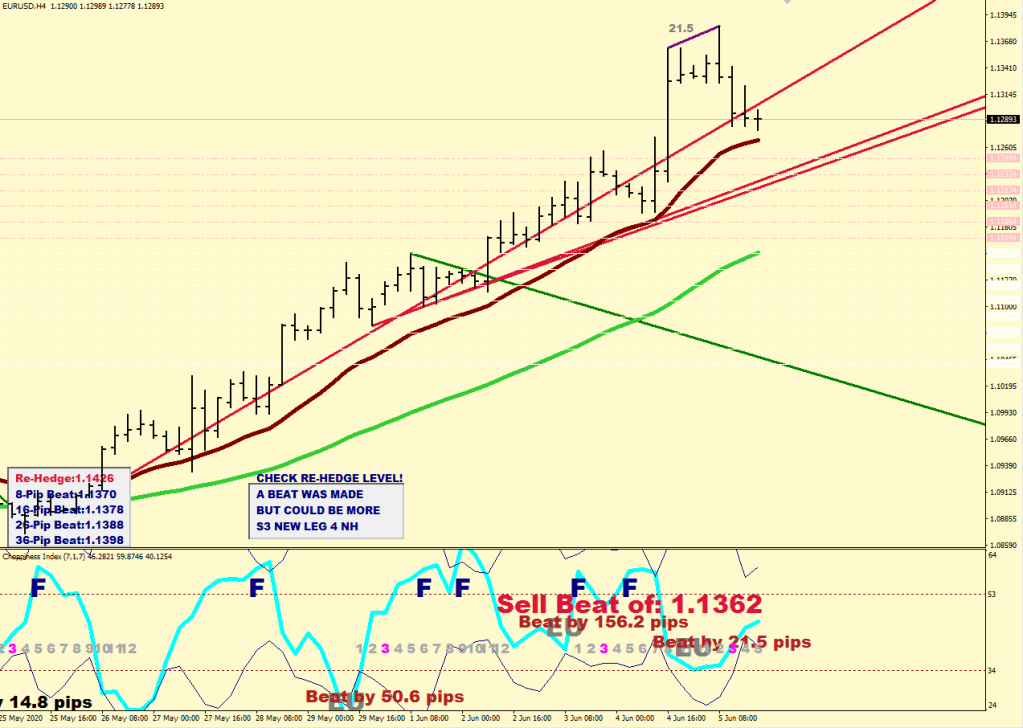
Price is above Mr. Maroon, so we are interested in the increment of the highs.
The last increment was less than 25 pips or more than 64, so it is printed in Gray – dip buys are not promoted here. A break out would be a buy even a couple of pips above, and the projected distance of this last move up is at 1.1445 – just keep it in mind, have a good trail stop and be ready to bail if price comes back by 9-10 pips below the high.
As long as price stays above Mr. Maroon, we do not have a Wave 1 down yet.
The Green one is the mean, where we would expect price to return to once Maroon gives its consent.
Gauge 3:
15 min
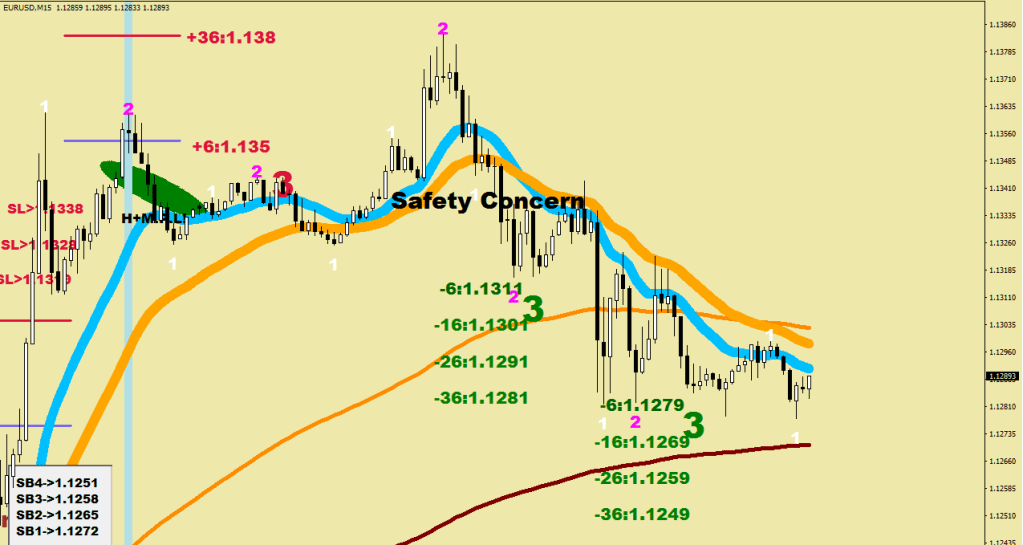
The 15 min shows the range that was expected to be failed. 1.1380 was a peak.
When the Safety concern was overrun, that made this move a qualified Shot Over the Bow – which is typical of a Wave 4 down. If price stops here, Wave 5 would have the opportunity to make a run for the projected high.
We are still in Strength Buy mode, as the bottom left ticker shows, but if price was to meander lower, this move would be a qualified Wave 1 down, and would expect the rally (Wave 2 up) to fizzle out.
Gauge 4:
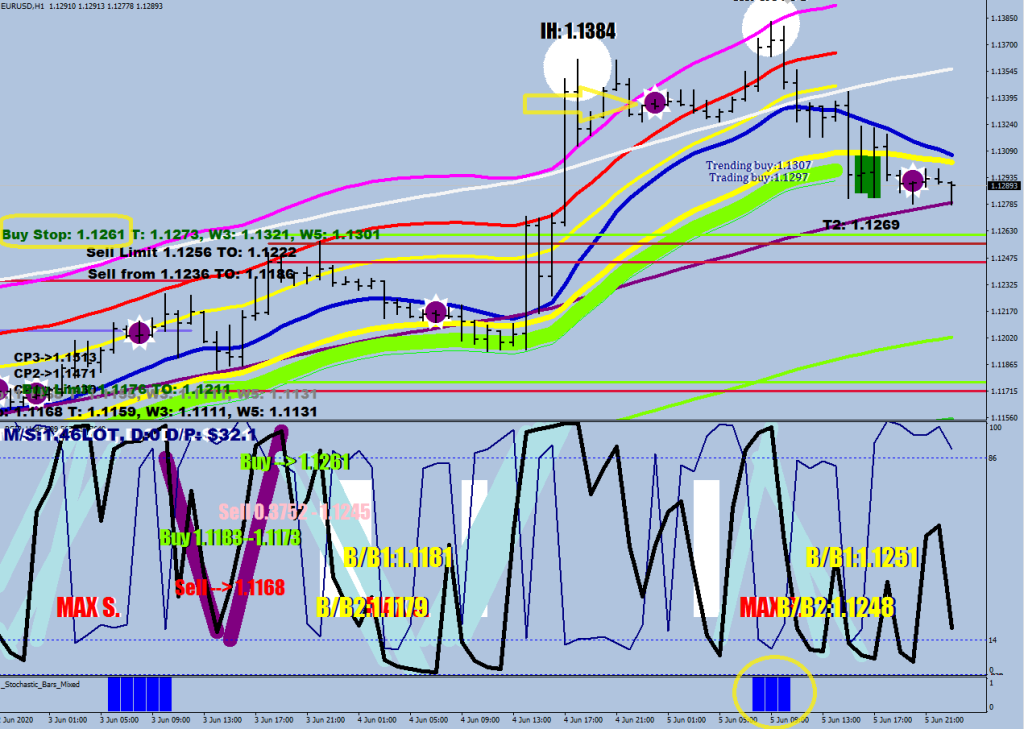
1H
The 1H shows a break out that occurred at 1.1261 – then a back test of that along with the 2nd doji up. The close of that doji + maximum 4 pips is where I would strongly consider getting out of the Wave 2 up – if that is what’s coming next.
I am a bit bothered by the stochastic bars making a print on the high, for the market rarely finishes on a high note.
Gauge 5:
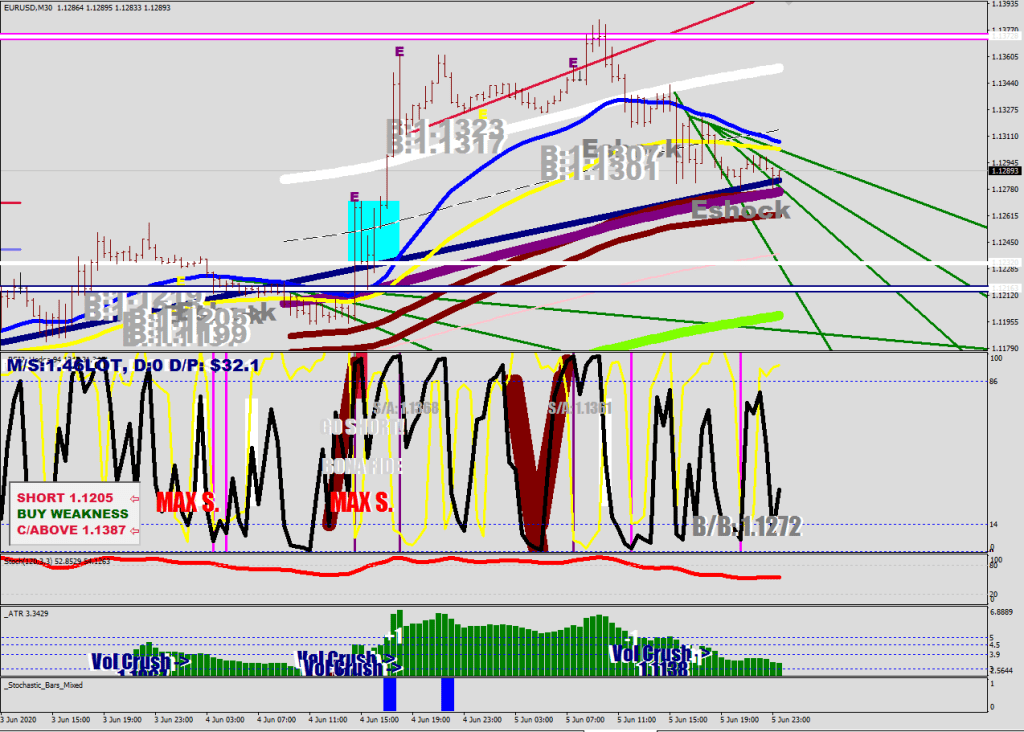
The 30-min doubles down on the importance of the break at 1.1261 with the highlight, and gives accurate distance readings from the mean putting the divergent highs to 6.7x and 6.4x stretch from the mean.
Most recently price made a move back down from 5x stretch to 3x (quite a bit of volatility crush).
The 4×4 hours of deflation increases the possibility of a rally ensuing next just as what happened the last time (2×4 hours up) – see blue line below.
Buy Weakness is still in effect and disregard the Short reading that is based on the location of the Energy bands that were unable to keep pace with this move up. The cover level just reinforces the notion that if there would be a break out, it would be a failed one. Refer to its maximum projection earlier.
Gauge 6:
5 min
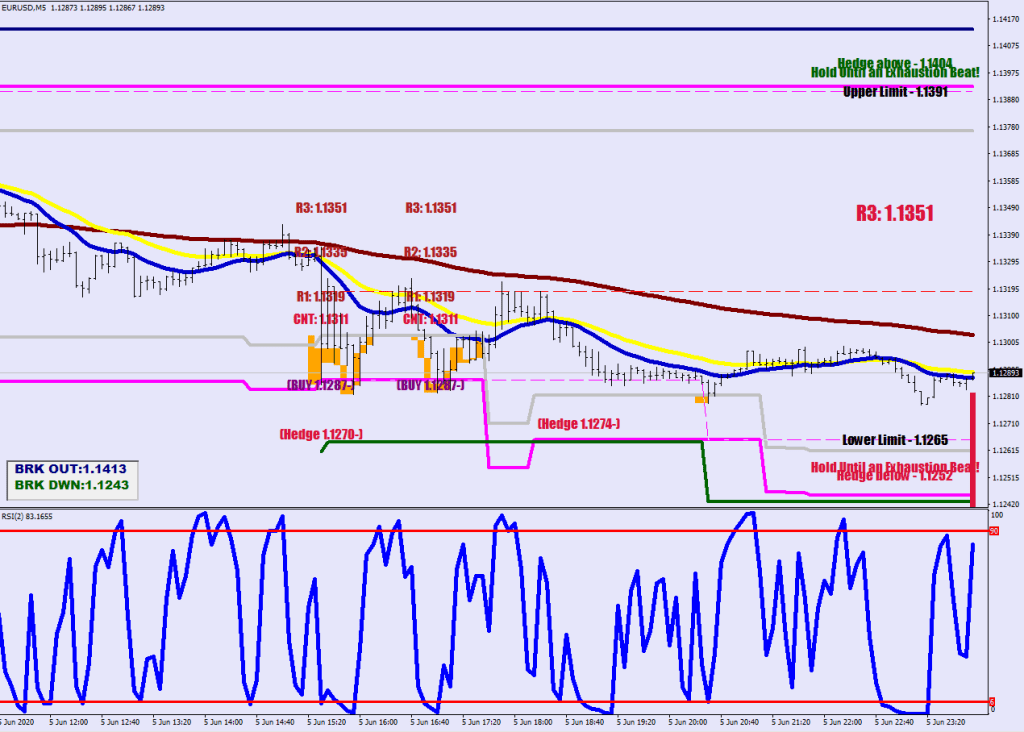
This chart shows the Buy level of below 1.1287-, and price has made 5-6 attempts trying to get lower – unsuccessfully.
The hedge level was not violated. The upper hedge level of 1.1404 brings attention to the possibility for a squirt above, and 1.1351 should serve as a resistance if this is going to remain the same wave structure to the downside i.e. we would get a wave 2 of Wave 1 down.
Current downside hedge / risk off level is at 1.1252
