
(…for the overbought side as it stands currently…)
It’s gonna be a long one, so grab a cup of tea!
Step 1. Identify the embedded overbought condition

I handed out the free tool for this one (instrument independent) in Aleš’s Lessons #10 under the name of Comfort Levels 4H Lucid and marked up the back test of the overbought neckline on the image above. The Blue, 80% line has not been seen back since – this is the realm of the overbought safety where higher highs are more or less guaranteed.
The first tail spin happened after a 585 pips relentless run up measured from the back test of the neck line and was 213 or so pips long (green).
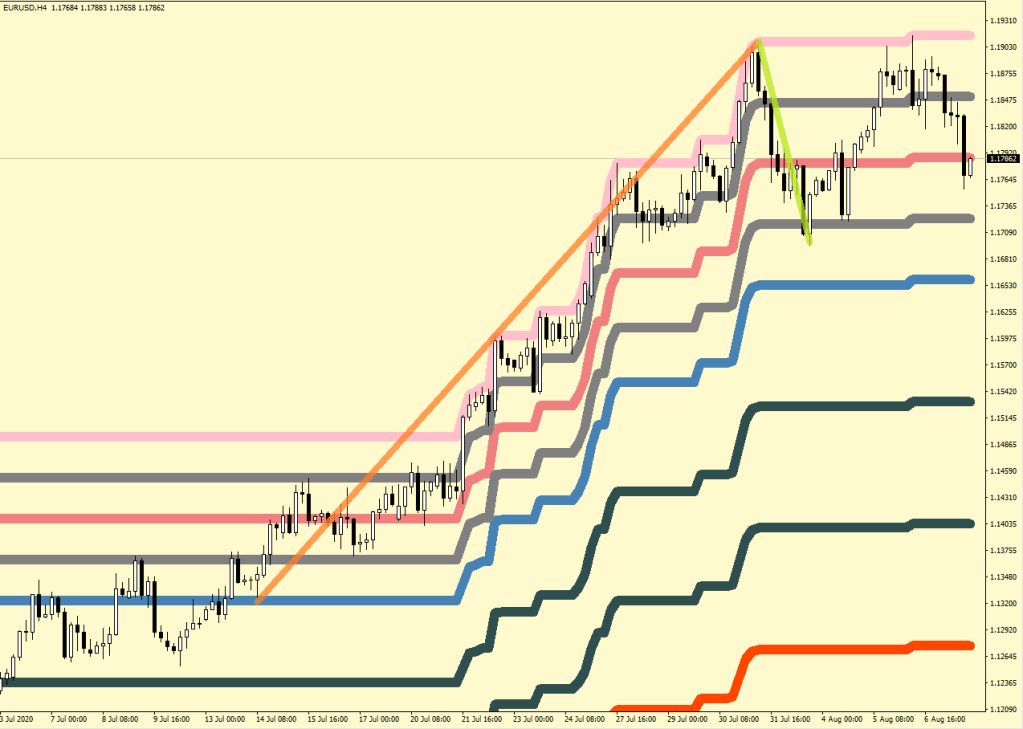
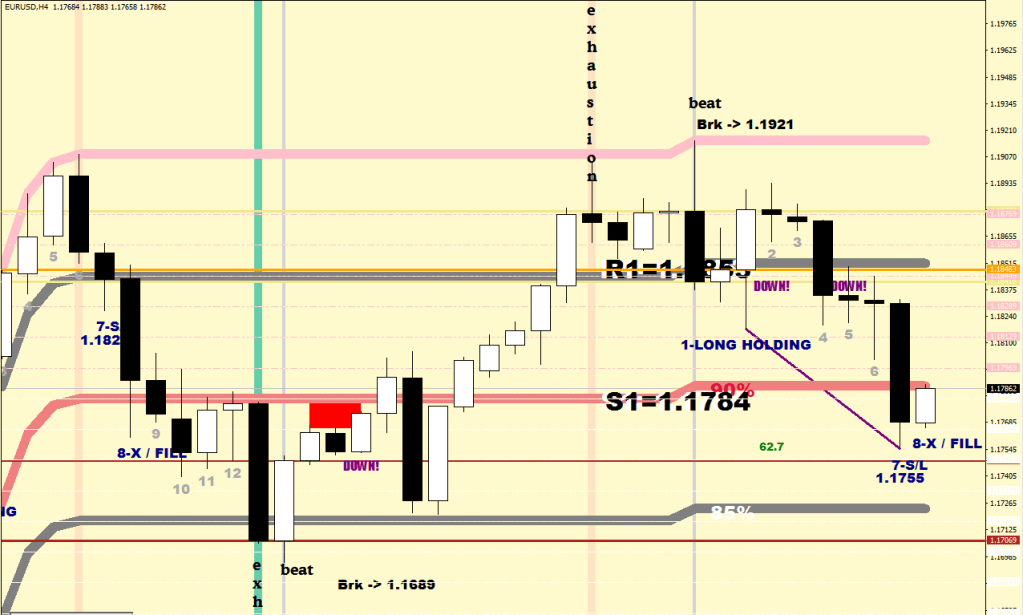
The run up had a total of four, 4H exhaustion beats or 3 break outs. Not gonna confuse you with break beats, don’t worry.
2. Exhaustions
Any energy sequence could come to a halt after a beat: no interest in continuation would result in not breaking the beat. Let’s see if we can define a maximum duration for a break to must happen.
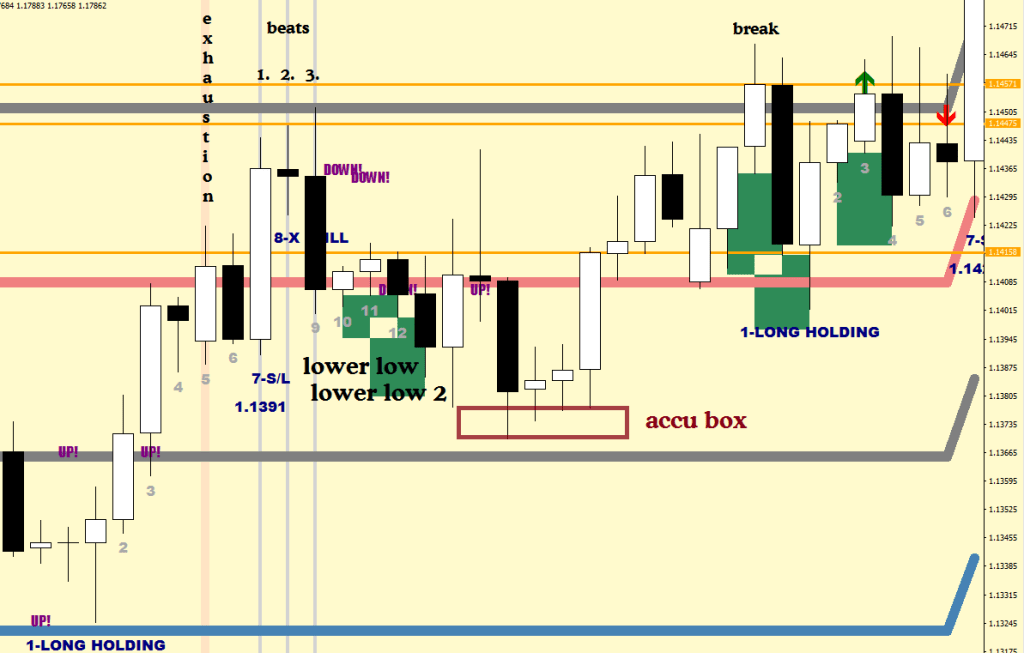
The first exhaustion – shown by the Choppiness_DV plots had 3 consecutive beats and the break of the beat happened 20×4 hours after the exhaustion and in a rather volatile manner.
Conclusions here: the break out is not very clean with multiple kick backs reaching up to 66 pips. The optimum way of playing is to have a holding and scale out on a beat. Reload below two 4-Hour lower lows – see brown box. Your optimal get out has to do with the count: you want to be active from count 8.
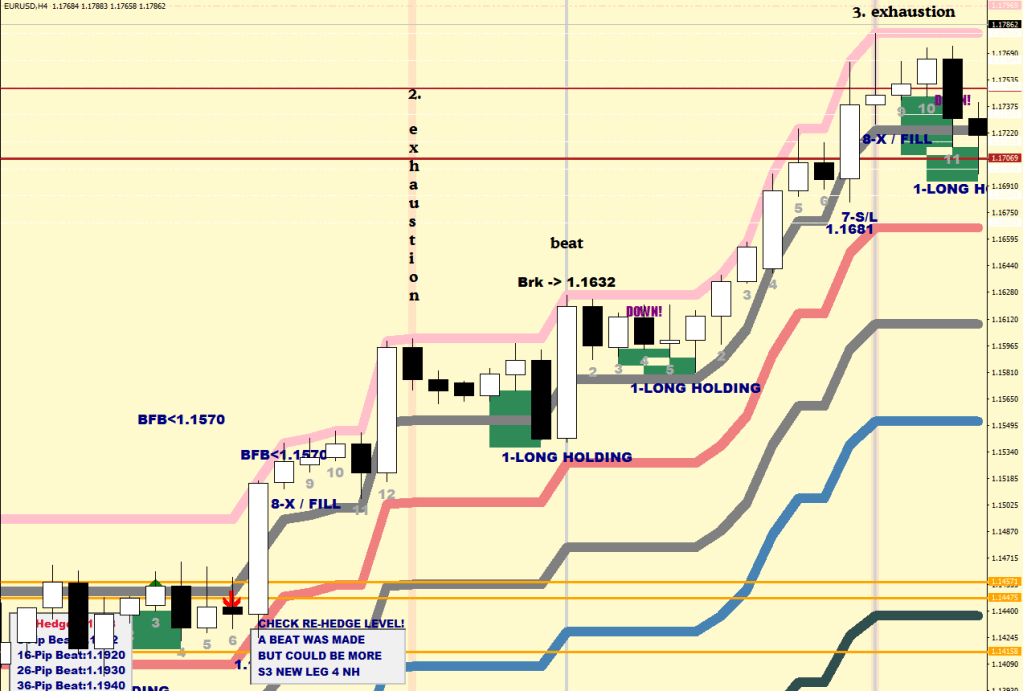
The second exhaustion had its beat 6 bars later and the break out was 12x 4 Hours down the road – with not much kick back this time. Interestingly the 8-count fell on the 3rd exhaustion print, which was also a beat. That’s two scores for the 8-count.
There were no 2x 4H lower low entries here, but the break itself was a safe adding point say 6-9 pips out.
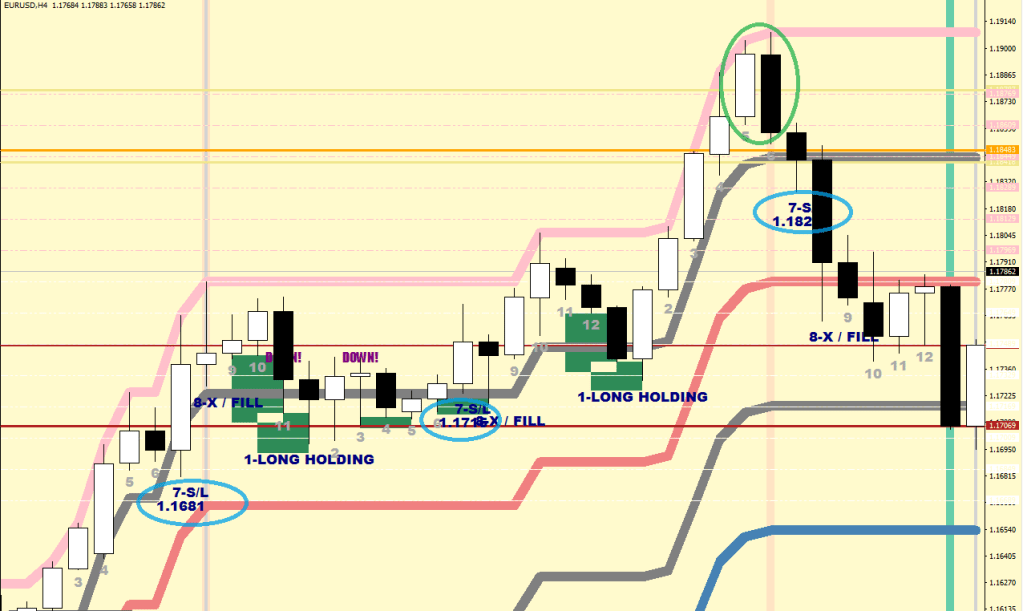
From the 3rd exhaustion the count does not seem to get the exit right with the number 8, but it does get something else right: the number 7 count provides you with the stop loss values for the parabolic ending (lowest low of 6/7 gives the actual number). So, 1.1828 would had been your trail stop stop out if you did not want to scale out upon seeing the green circle event – the engulfing candle that was brought on by the 4th exhaustion.
The #1 counts were great entries, but you would not have these printed real time for you need 2 more candles before a candle can be called a fractal. For quick trades, you have the 7-count real time, and you can sell off on the 8-12 counts.
The last exhaustion was also a beat, but I could not write one software for every possible occurrences: a higher high and a close back below is always a spark, and can always balloon into a rapid fire.
Before closing out the exhaustion/beat section, let’s acknowledge the fact that the tail spin ended in an exhaustion-beat which was not followed up by a break as well as the new run for the top resulted in another exhaustion beat.
Since the whole thing looks like a ranging / consolidation are it is safe to think that if this was to continue, the most likely thing to print here is a bull flag, which would give a lower sightly low as the next low risk entry somewhere between 1.1694 and 1.1651 (overbought neckline currently).
Of course, the 2nd tail spin can also turn into something more.
3. Projected distance
Since the neck line back test, the projected distance values brought on turbulence and and you were always able to sell for a profit if you were starting to short 7-pips out and added to your short every 10 pips further out. Even the worst location did come into money by 27 pips at the end, and the most abuse to endure would had been a total of 77 pips on the first position.

Currently there’s a projected distance value at 1.1707.
The 1.1648 has no extended line on the right and still registers (see short purple line on the right), because of the way I wrote the search. There was no low below and close below event. This may be a mistake or could be a benefit. It is interesting to note that the value itself at 1.1648 is awfully close to the previously mentioned 1.1651 overbought neckline.
4. The Overdrive
I have talked about the possibility that the overdrive lines on the 4H charts may end up looking rudimentary. The circled values sync up much better on a 15-min chart, see the previous posts.
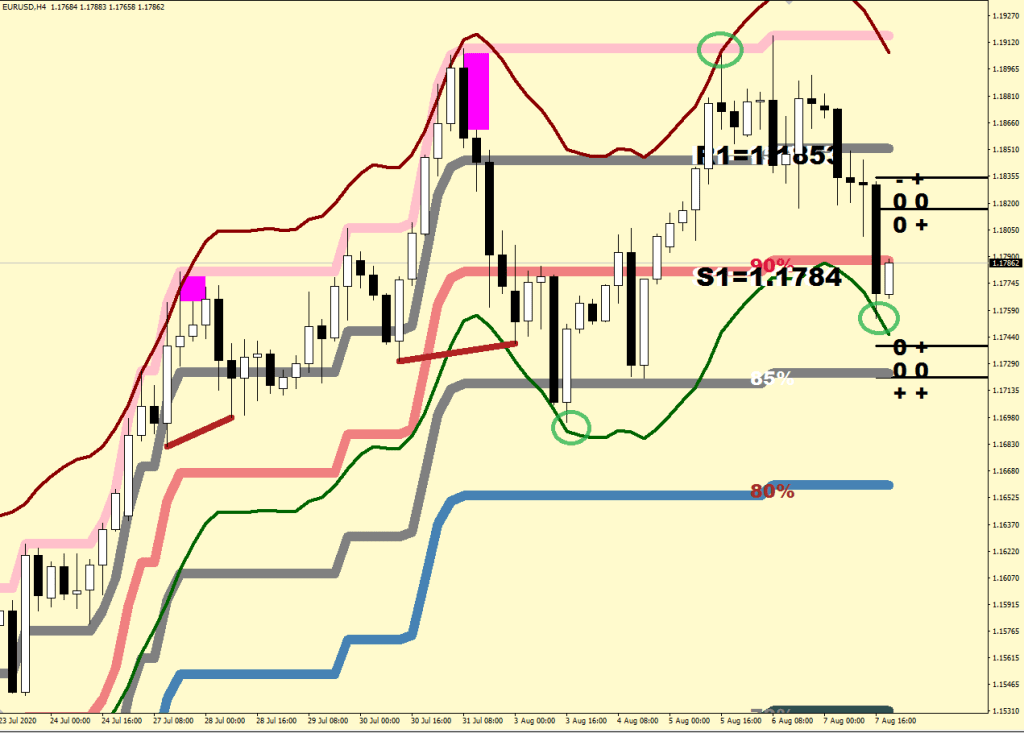
The point here is that if the price reacts on cue to these hourly E-32 displacements, they verify the presence of the E-32 channel.
ODU[i]=E32L[i]+FMax*22*Point;
ODD[i]=E32L[i]-FMax*22*Point;
If these points coincide with exhaustions, your narrative have more evidence to work with to vindicate a turn.
The current touch did not come on an exhaustion-beat, so I am expecting more downside.
5. “It’s all about the RSI”
The latest addition, the plot of below 16 RSI 2 readings can help figure the tail spins / deep corrections. See my last article, “How Did I Know” for this one.
Routine: RSI2 Basic
  if (RSI2[i]<16 && iClose(symbol,1440,1)> iHigh(NULL,240,iHighest(NULL, 240, MODE_HIGH, 1590))-(iHigh(NULL,240,iHighest(NULL, 240, MODE_HIGH, 1590))-iLow(NULL,240,iLowest(NULL, 240, MODE_LOW, 1590)))*.2
         && iClose(symbol,1440,2)> iHigh(NULL,240,iHighest(NULL, 240, MODE_HIGH, 1590))-(iHigh(NULL,240,iHighest(NULL, 240, MODE_HIGH, 1590))-iLow(NULL,240,iLowest(NULL, 240, MODE_LOW, 1590)))*.2
         && iClose(symbol,1440,3)> iHigh(NULL,240,iHighest(NULL, 240, MODE_HIGH, 1590))-(iHigh(NULL,240,iHighest(NULL, 240, MODE_HIGH, 1590))-iLow(NULL,240,iLowest(NULL, 240, MODE_LOW, 1590)))*.2
      ){
         ObjectCreate("TitusOverOne"+DoubleToStr(i), OBJ_TEXT, indicator_window, Time[i], RSI2[i]+16);
         if (RSI2[i+2]<16 && RSI2[i+1]<16 && RSI2[i]<16) ObjectSetText("TitusOverOne"+DoubleToStr(i), DoubleToStr(NormalizeDouble(RSI2[i],1),1), 13, "Arial", Magenta);
else ObjectSetText("TitusOverOne"+DoubleToStr(i), DoubleToStr(NormalizeDouble(RSI2[i],1),1), 13, "Arial", Crimson); 