Investigations into the channeling mode
- When and how does channeling occur?
- What are the common kick-off traits of a channeling move?
- How does channeling end?
The near past has downside examples, so that’s what I’m going to present you with.
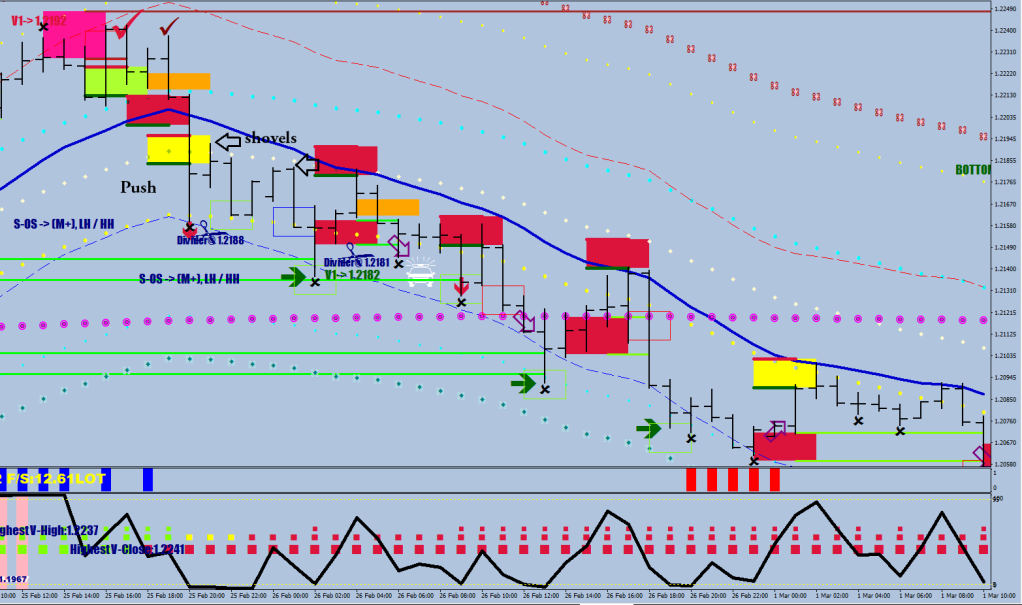
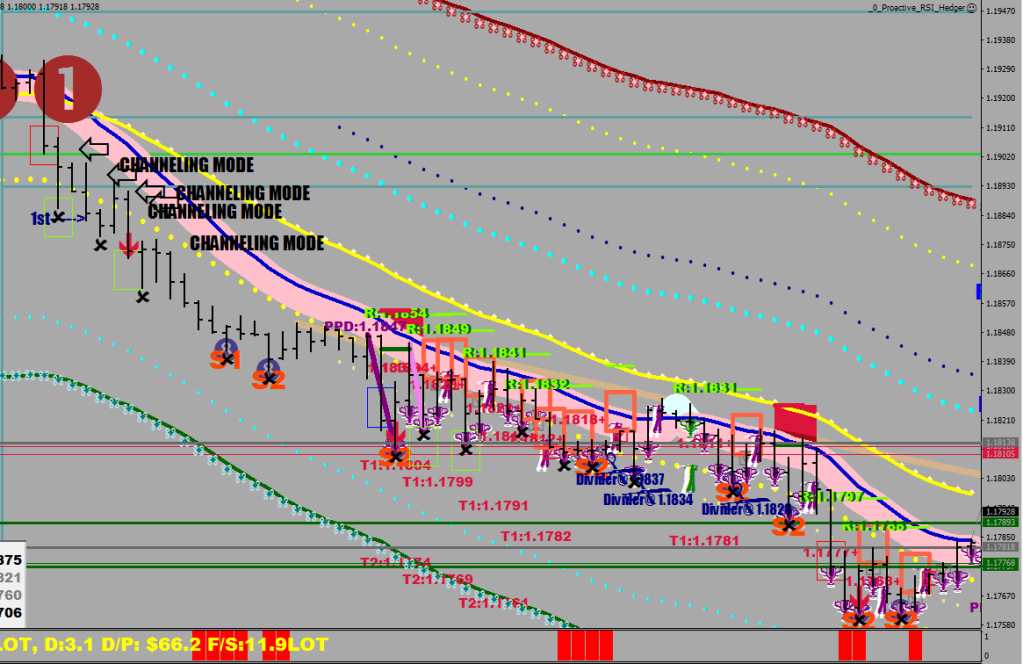
My definition of channeling goes like this: sustainable selling / buying brought on by not letting price come back to the E-16.
In practice this means that every time there is a scare on the E-16, someone steps up and shovels in just enough coal to keep the steam-roller going, never too much, for that could end the party.
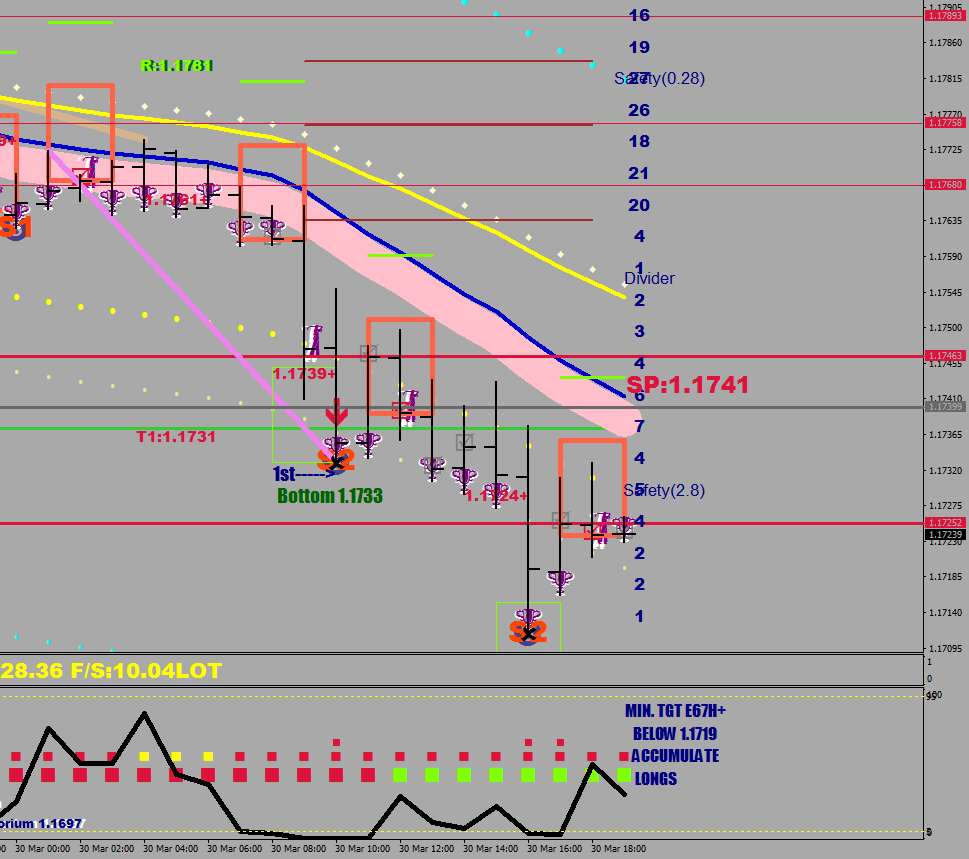
The following 3 down moves had one thing in common: at the start they all applied some pressure on the E-16 upper displacement, then printed a W which is a call for a higher high, then they attacked the lower displacement. Falling just shy of it is a good start. The channeling moves tend to have their upper line just shy of 10 pips from the E-16 HL2 and the other end somewhere from 39 to 58 pips away depending on the current volatility.

The following example from earlier shows the decisive push towards the displacement and the two shovels on cue to keep the trajectory.
(The two pink lines are the raining best trade in existence being dethroned by the current W to channel idea.)
So how does a channeling move end?

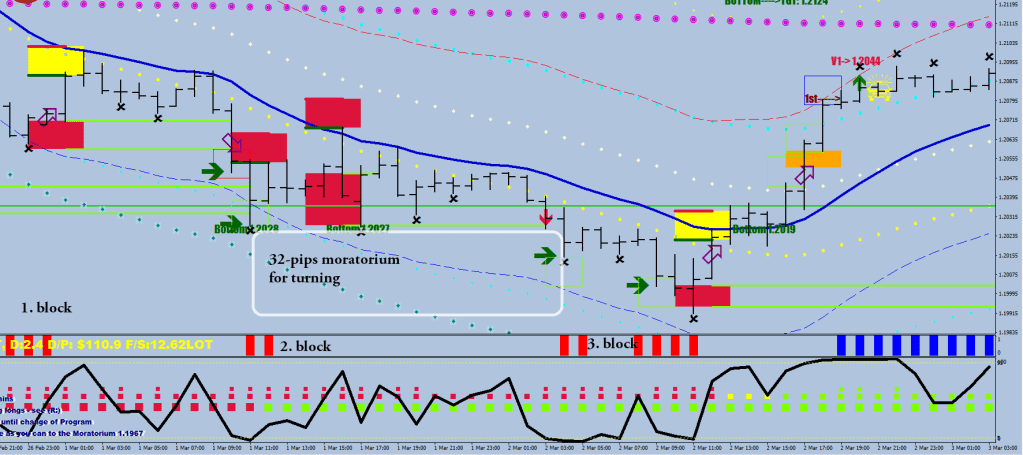
You get to fill in the blanks for this last, low volatility example.

…

…
This is how channeling looks like on WandaVision:

…
Channeling mode confirmation plots
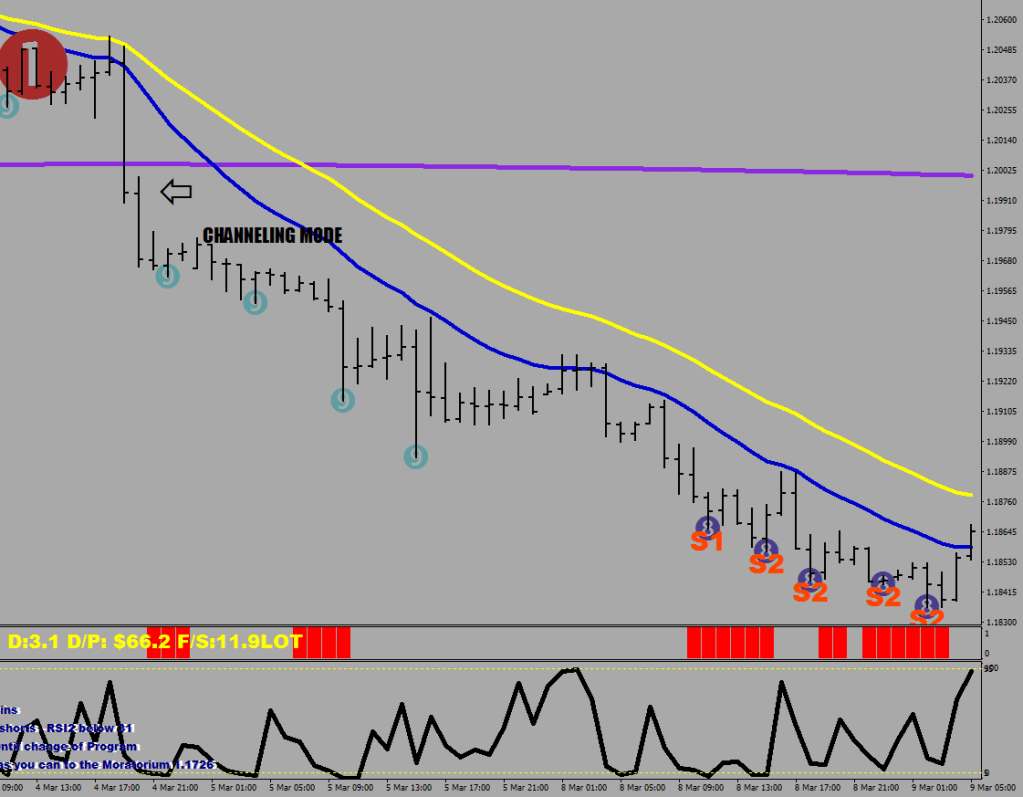


Busted! feature added on the upside. This is after 9 blue stochastic bars prints. The upside would be limited around 16 pips in excess of the swing just printed.

…
As it turns out, there is a 3rd way Channeling can end: price crashing into the forest without any stochastic bars to put the blame on when price is at more than 2.5x Fluctuation Maximum away from the mean.