
What is that you’re always looking at? – someone asked me today.
My response was: this is hell, you are keep on confusing knowledge with being lucky.
No, I am not a promoter of trading.
But if you are damaged goods and happen to be here, let’s make it memorable. It will feel like walking on Strepsils.
Daily chart, candlestücks, in the middle of the boring rain.

One by one.
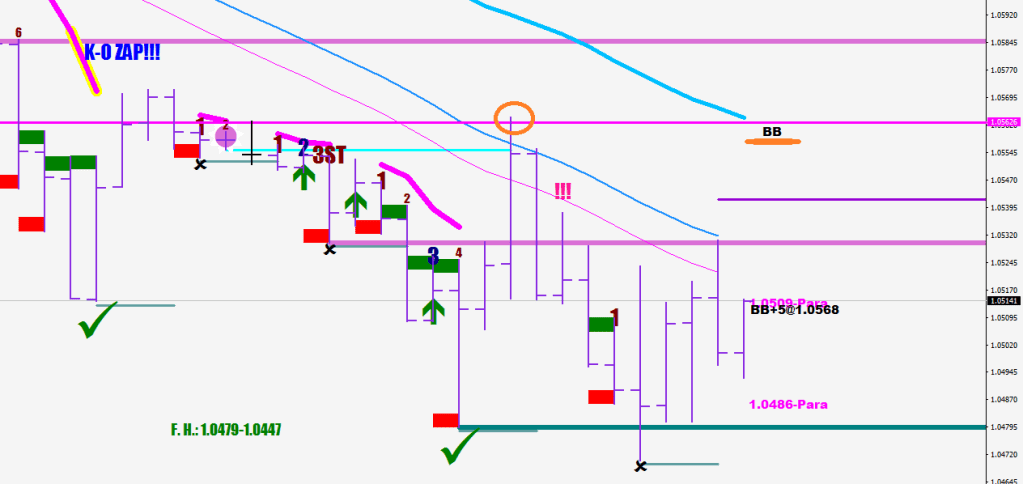
Candelloni #1: Rejection at the 20 SMA. Long wick on the top for strong selling pressure, much less buying pressure by the close, the body shows progress made by the bears. Suspect of a new leg down (the divergent leg that kicks off with a continuation divergence).
Candelloni #2: Follow through. More daily progress made by the bears, the wick on the bottom shows a bit of increased selling pressure, but less than 27 pips (not an official cover low). Volatility is on the rise.
Candelloni #3: Increasing selling pressure. Much more daily progress made by the bears, we are on our way to the Bollinger Band. Buying pressure wick is getting shorter.
Candelloni #4: Increasing selling pressure. More daily progress made by the bears, the wick on the top shows growing bear aggression (and they show for it too), the wick on the bottom is virtually non-existent at the Bollinger Band, foreshadowing the upcoming push against the Band on the outside.
Candelloni #5: Selling pressure, volatility maintains, even more ground gets covered. There is 27+ pips cover at the end of the day with the 4-sample lower low outside the Bollinger Band. Now the bears are pushing it (borrowed time), price can only stay outside the bands less than 5% of the time.
Candelloni #6: They are making a push yet again from the Bollinger Band, bears are fearless and possibly topless too at this point. Being drunk on success does not help. You better cover with this lower low.
You’ve been candlestruck.
A doji is like a small black hole. Somebody diverted every order into their pocket in that hour.

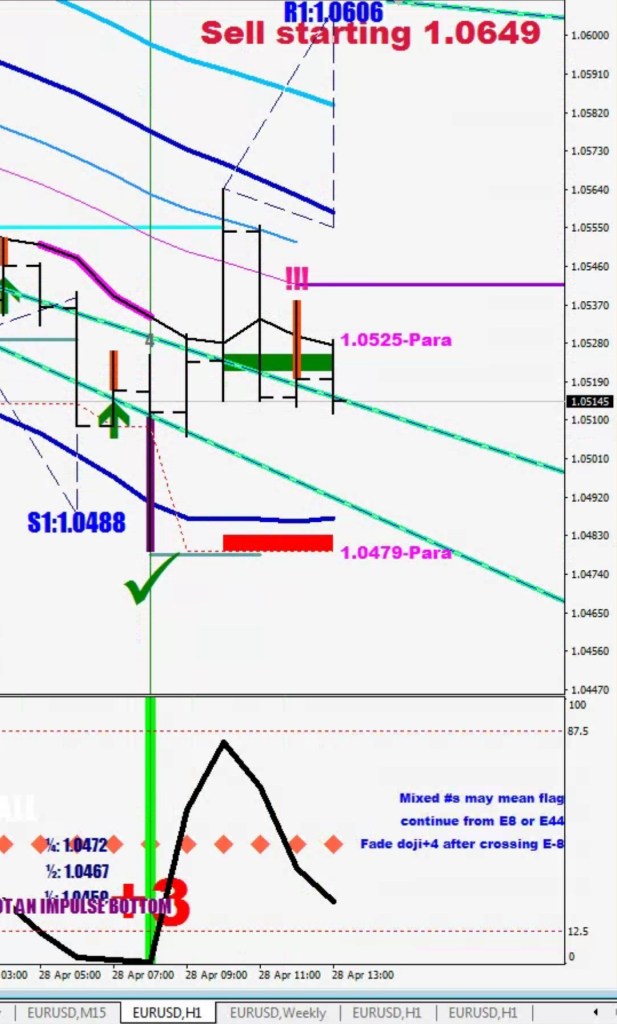
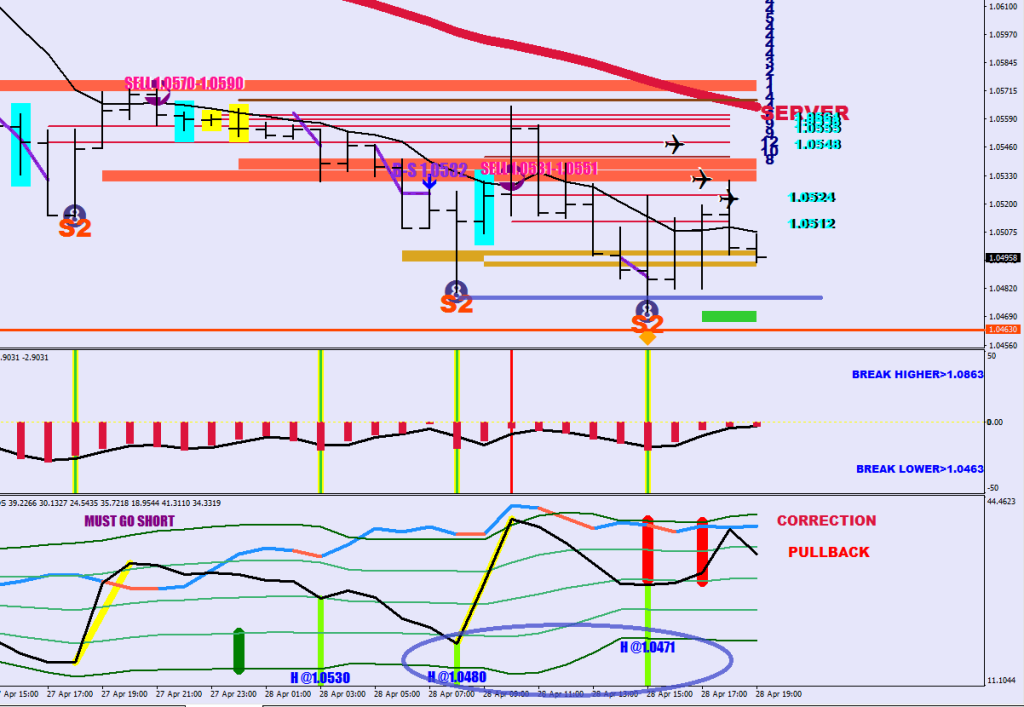
How does a “the low is in” show up on a chart? Perhaps in a form of a hedge-level break that the market does not manage to get too far from and cannot seem to be able to close below on the hourly.
Two examples:

You say you don’t believe in separation and counting? What is your religion? Do you feel lucky, cyberpunk?
All that’s left is for me to put on my velvet shoes and show you to the exit.
Some bonus Urban Cookie Digestive for you.
