The score.
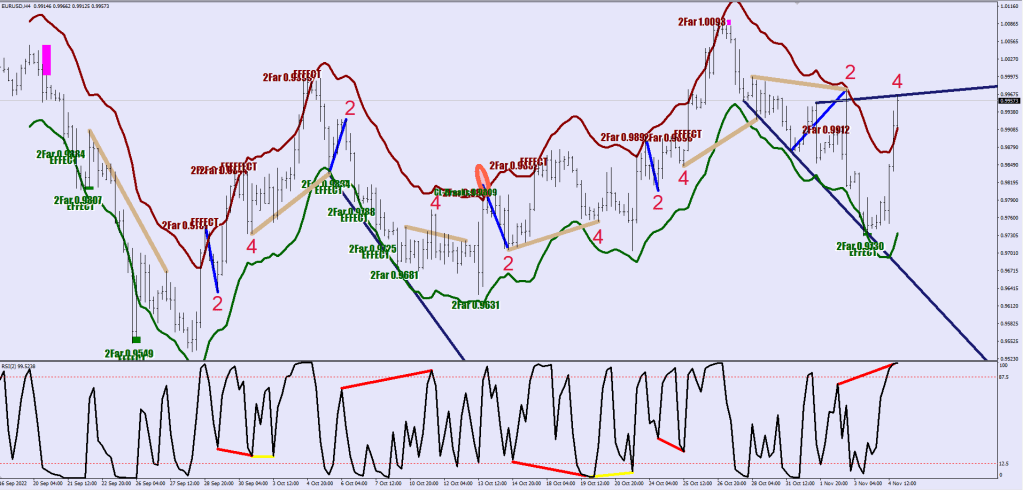
I started marking up decisive moves. 90 pips or more within 2 hours. Yes, 190 qualifies.
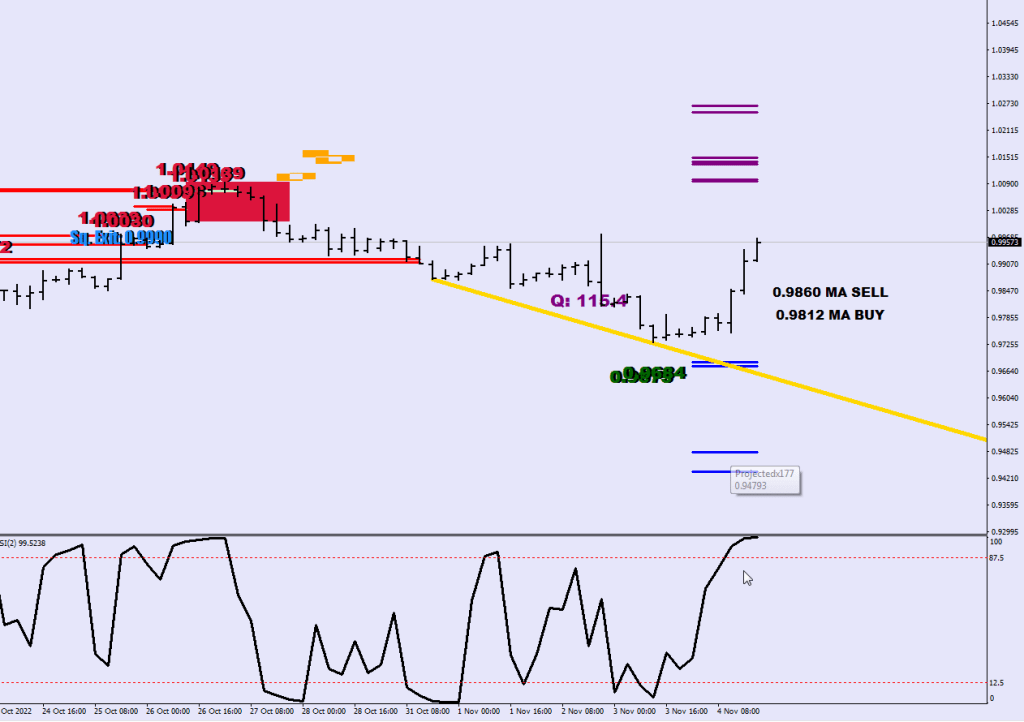
Normally it would be like, decisive move, market staying overbought / oversold and no bow back beyond 32 pips – see the fractal to fractal move right after the RedOrange shaded part.
 if (High[i]-Low[i+1]>900*Point && Close[i]> iBands(symbol,0,30,2,0,PRICE_MEDIAN,MODE_UPPER,i)){
       ObjectCreate("PERJES"+DoubleToStr(i), OBJ_RECTANGLE, 0, Time[i+1], Low[i+1], Time[i], High[i]);
         ObjectSetInteger(0,"PERJES"+DoubleToStr(i),OBJPROP_COLOR,clrLimeGreen);
   }
  if (High[i+1]-Low[i]>900*Point && Close[i]< iBands(symbol,0,30,2,0,PRICE_MEDIAN,MODE_LOWER,i)){
       ObjectCreate("PERJES"+DoubleToStr(i), OBJ_RECTANGLE, 0, Time[i], Low[i], Time[i+1], High[i+1]);
         ObjectSetInteger(0,"PERJES"+DoubleToStr(i),OBJPROP_COLOR,clrOrangeRed);
         ObjectSetInteger(0,"PERJES"+DoubleToStr(i),OBJPROP_BACK,1);
   }
Recap. I mentioned 0.9736 being the next stop and that would put price at 4x stretch from the mean.
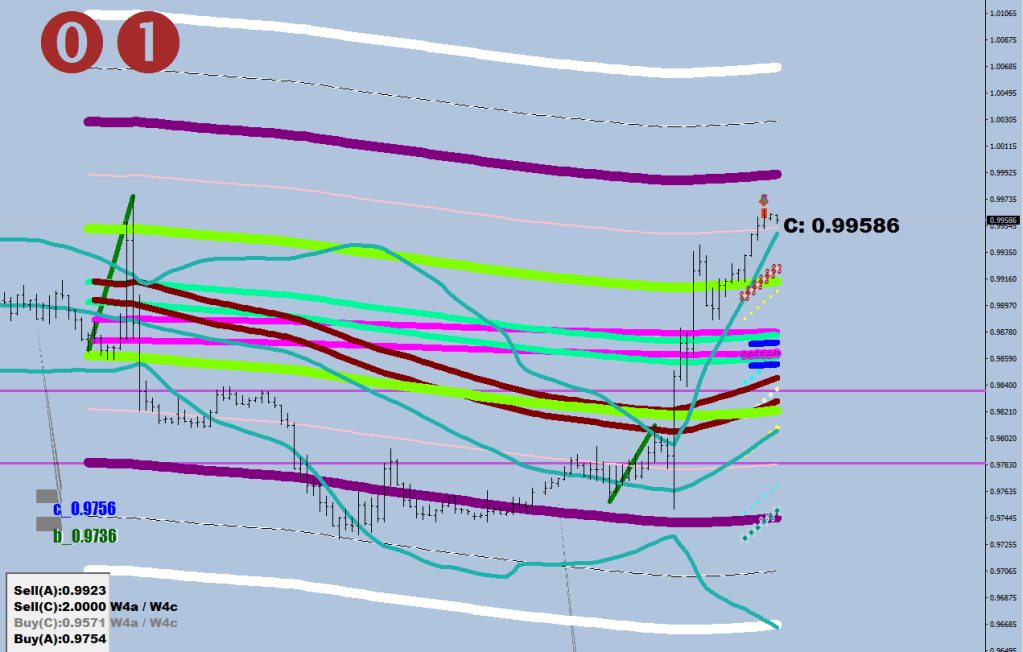
Check.
I was guessing to see 3x step out of the BB. There were only 2.
4x stretch is about what the market can do with “normal” levels of volatility – but this market is not at all normal.
Price already has swung to the other side all the way to a 2.375 stretch.
What’s going on? What is the wave structure here?
Nothing seems to work out. Must take things one day at a time.
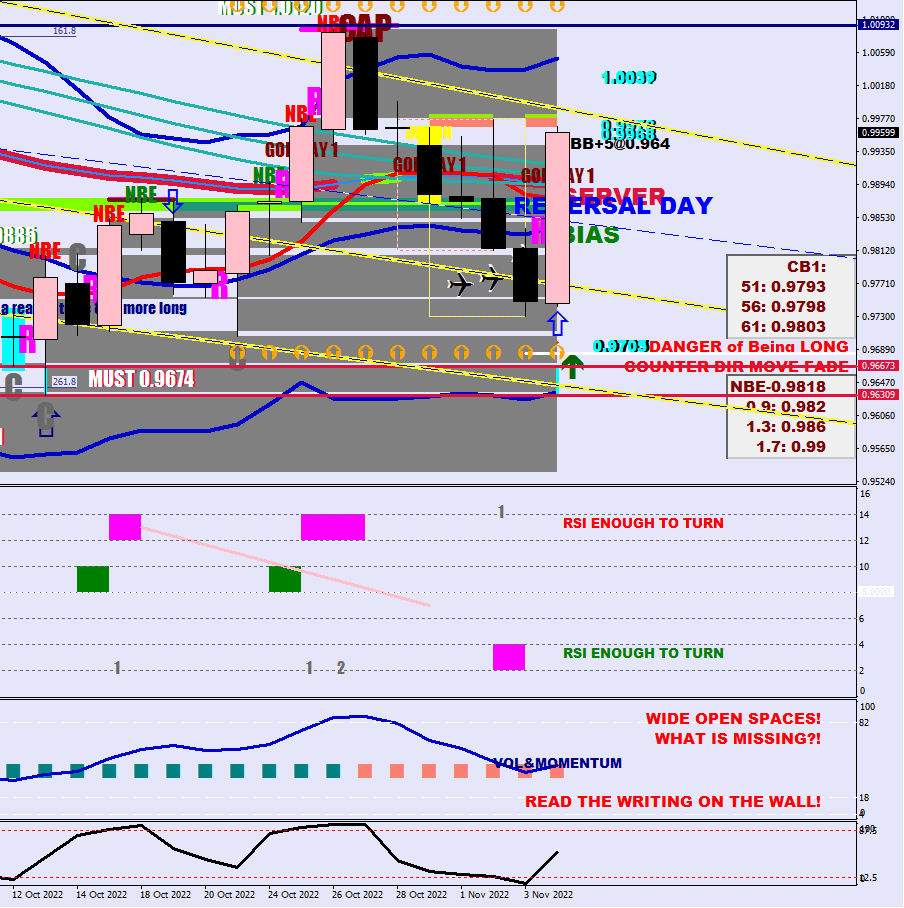
I called the run to the CAP a Wave 3. A 300 move is final. Does this mean that this Wave 5 up is a right shoulder?
The biggest changes are on the weekly chart.

Ever since the megaphone there has not been a sequence of more than 2 weeks closing above the lower 2std 14-sample Window Envelope (Magenta) until now. Price was also closing above last week’s pivot and the Oversold neckline. 224 pips range talks of rising volatility. Stochastic embedding is lost, the touch of the 21EMA (White) would be the next logical move. So the match of or a beat of the Wave 3’s high would be logical to see from a Wave 5.
There should be a serious re-balancing first, and I am looking at 0.9845-50 as suspect, but after a couple of closes above the 20DEMA, the momentum should flip back up.
As an alternate count would call this current move up a Wave 4. This run up did bot manage the last swing high and this may result in a gap down.
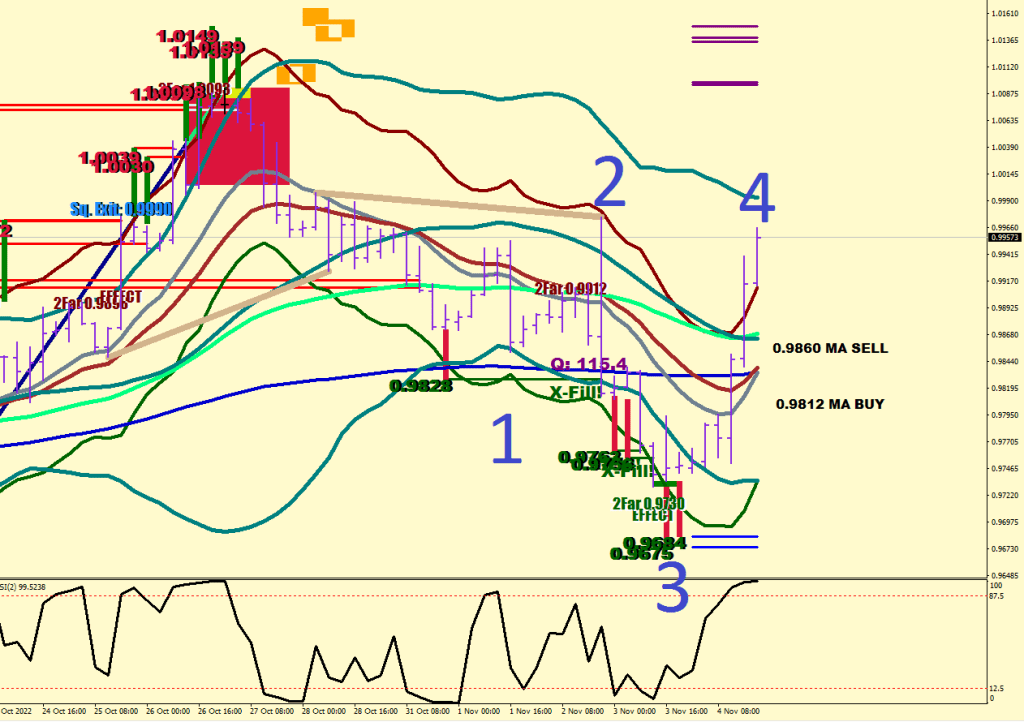
I have seen Wave 1s before falling short of the Overdrive band and also seen the first leg of a Wave 4 violating the Overdrive.
If you connect the low ow Wave 1 and the low of Wave 3, that vector would hit the next projection bunch down at 0.9479 in 18×4 hours = 3 days.
A 9x stretch from the mean would mean 0.95 or a bit lower. It would make sense to improve on the reversal divergence after a major acceleration made by Wave 1: an RSI2 at closing still below 12.5, but way higher than that 3.8 reading at the end of Wave 3. Not at all madness.