I’m so Swanscombe, I’m so Strood.
Today I could had made funds for an 85-inch Samsung + a Retro Console PC by buying at the open, instead I have been watching all day my draw down growing ever larger from 24% to 42% and only cashing in a chump change of $220.
Pitifully mishandled this Decisive move knowing that Friday was the largest daily candle going back several years.
I already know that the last swing would be a swing in excess of 100 pips.
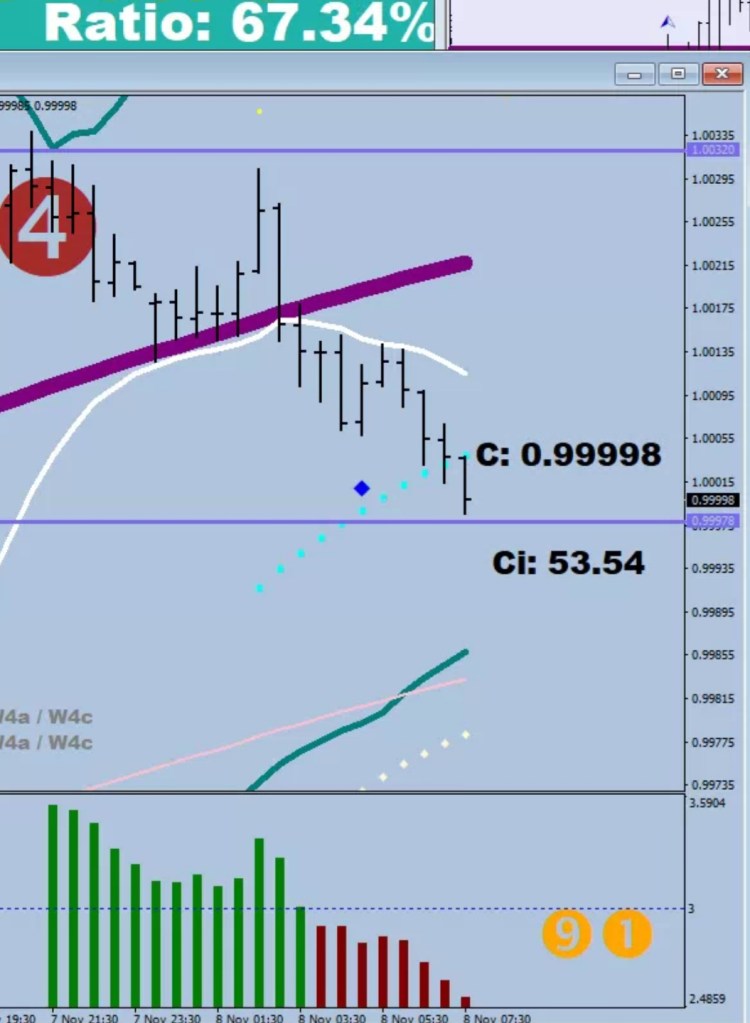
I have suspected that price would get outside the 30-sample BB.
But there’s just one thing.
Where’s the confirmation of the turn?
If we go back to the previous two examples, there’s something precious hidden in the charts.
After 2 consecutive closes on the other side of the 8-EMO, the buy level (short cover) presented itself as 10 pips lower than the second hourly close over.

We need to see something similar happen for the cover level to show itself as this second example. 2 closes below the 8-EMO and 10 pips above the second close is the get out of long / go short level.

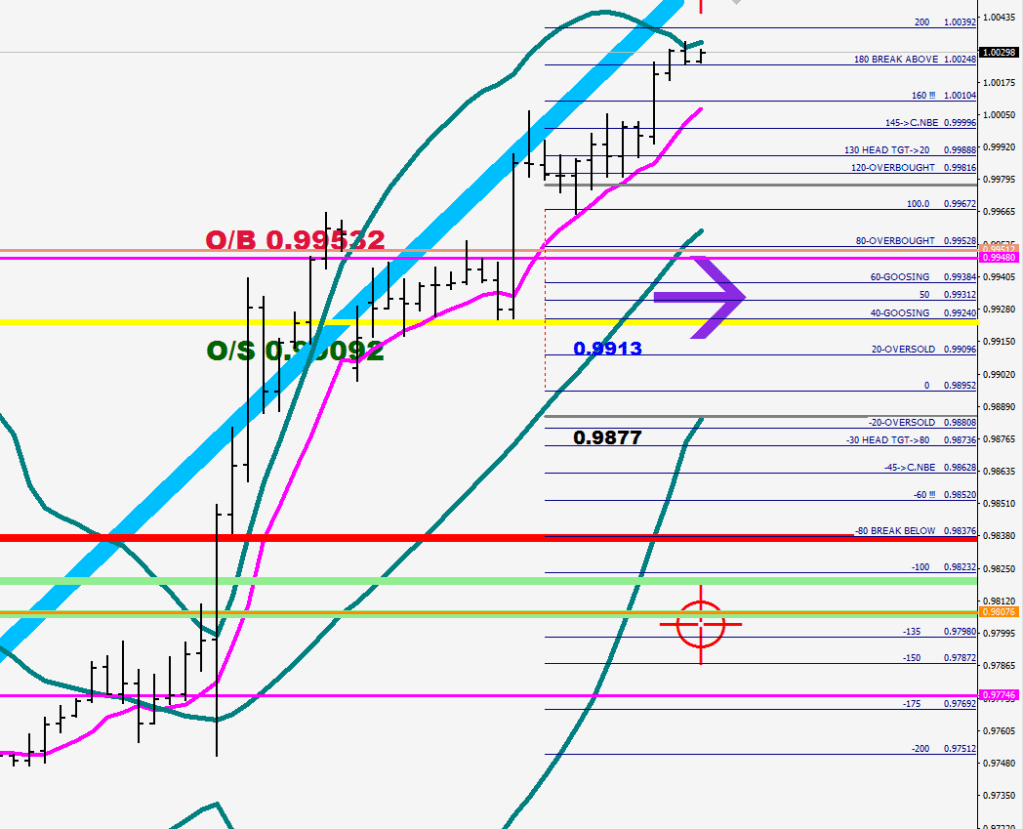
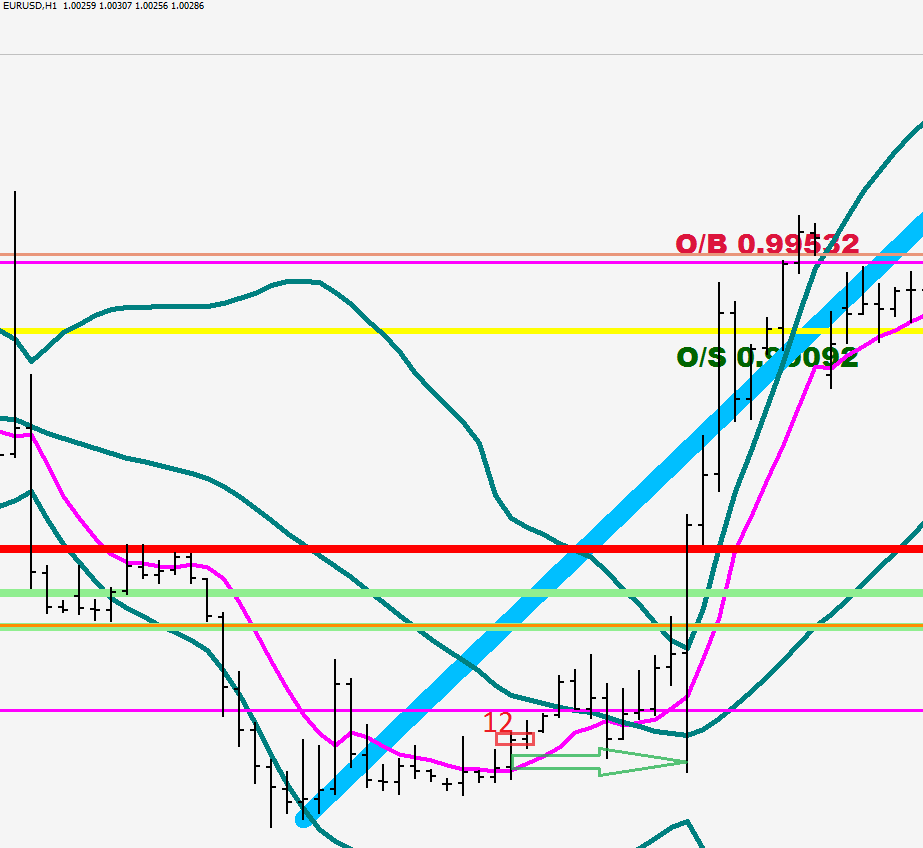
btw, after 4x stretch on the downside the market managed a 3.6x stretch on the upside