These are theses.
I don’t aim for multiple instruments or multiple time frames.
I’ve been talking about divergences, but market may turn without one.
Introducing the extremes. MFI is charted on a 0-100 scale.
If a median price extreme starts at 12.5, I would put the extreme of a typical price at 8.
The plot thus is an 8-ball.
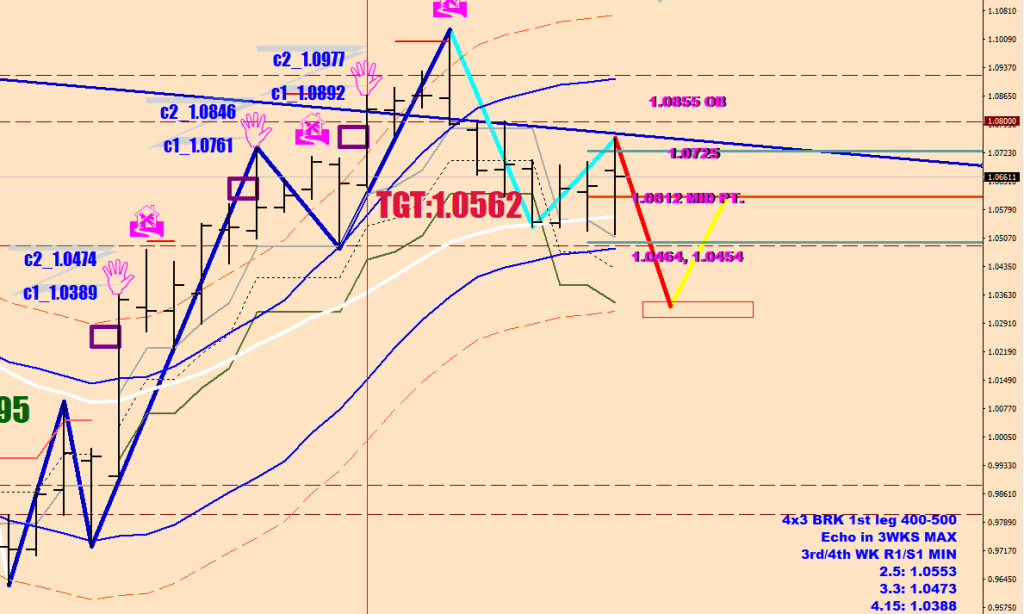
On the image below there is a reminder on the right hand side for a black eight ball -> crossing over the 8 EMO (hourly denomination) -> going to the 240 SMA.
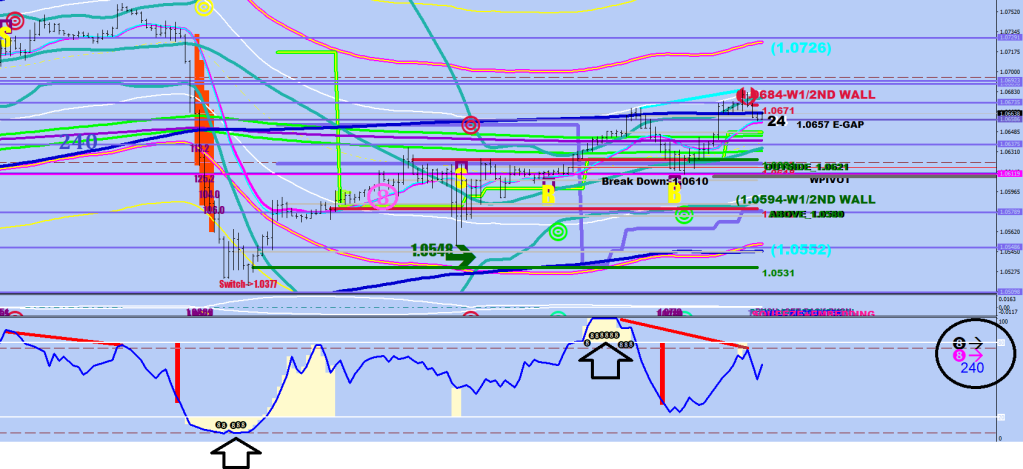
The 8 EMO is the 8-sample EMA of Opens. I usually have it in 2 different colors. Here the 240 is as the middle line of the 240-BB.
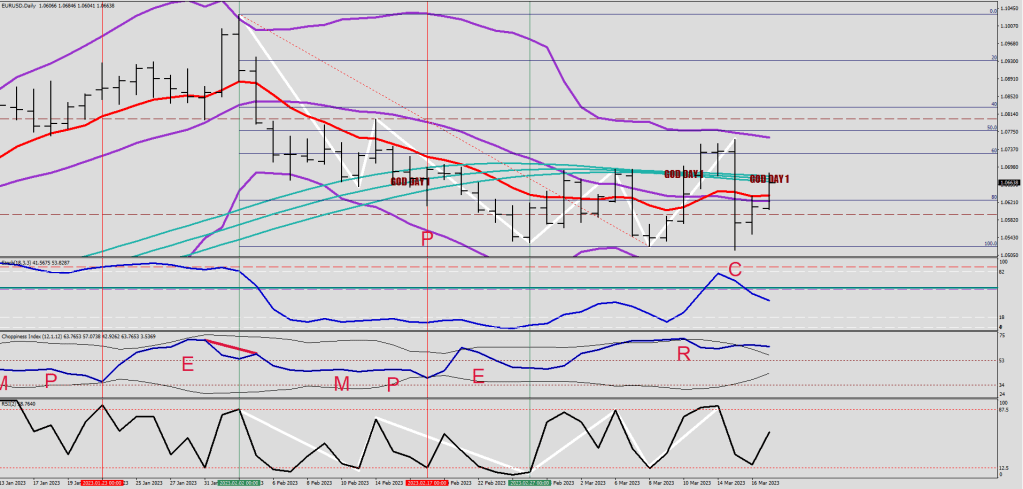
See, there is no certainty to these steps timely manner. A black 8-ball may be restrained from crossing over the magenta 8 EMO, like in this example:

And if you go back to the first image, the last RESET was not all in one direction: the 8-EMO was below whilst the 240 SMA was above (which is what made the divergence print).
  if (mfi[i]<8){
            ObjectCreate("Roe"+DoubleToStr(i), OBJ_TEXT, 2, Time[i], mfi[i]+10);
            ObjectSetText("Roe"+DoubleToStr(i), CharToStr(147), 12, "WingDings", Black);
    }

       if (mfi[i]>92){
            ObjectCreate("Roe"+DoubleToStr(i), OBJ_TEXT, 2, Time[i], mfi[i]-10);
            ObjectSetText("Roe"+DoubleToStr(i), CharToStr(147), 12, "WingDings", Black);
    }
But this is just one thing that contributes to a reading on a particular time frame.
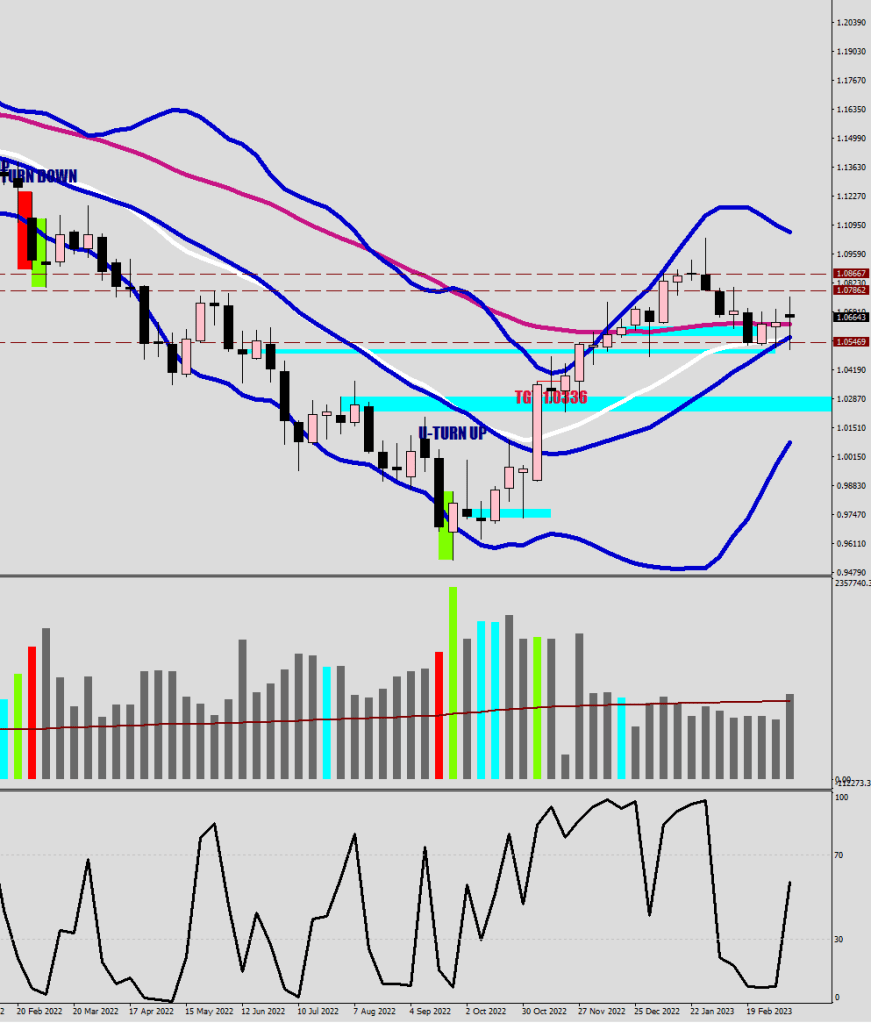
I also use a 5-sample smoothing over a 2std banded 14 sample HL2 RSI on the 1-hour timeframe.
MFI[i]=iMFI(symbol,0,14,i);
AVG[i]=((MFI[i]+MFI[i+1]+MFI[i+3]+MFI[i+4]+MFI[i+5])/5);
The main problem with these vertical plots is getting the displacement right. For instance, if I take away the 2-point allowance for the Salmon plots (meaning an RSI-print came within 2-points of the 2 STD band), the first plot would be taken away. Yet if I give too much allowance, I may get too many not-so good signals. The MFI average here is the filter for RSI making the low above the money flow average or not.
 if ( RSI[i+1]>AVG[i+1] && RSI[i+1]<lower2[i+1] && !(RSI[i]>AVG[i] && RSI[i]<lower2[i]) && Period()==60){
  ObjectCreate("LOTUS"+IntegerToString(i),OBJ_VLINE,0, Time[i+1], 0);
      ObjectSet("LOTUS"+IntegerToString(i),OBJPROP_COLOR,clrMediumSpringGreen);
      ObjectSet("LOTUS"+IntegerToString(i),OBJPROP_WIDTH,10);
      ObjectSet("LOTUS"+IntegerToString(i),OBJPROP_BACK,1);

 }

  if (RSI[i+1]>69 && RSI[i+1]<AVG[i+1] && RSI[i+1]+2>upper2[i+1] && !(RSI[i]<AVG[i] && RSI[i]+2>upper2[i])&& Period()==60){
  ObjectCreate("LOTUS"+IntegerToString(i),OBJ_VLINE,0, Time[i+1], 0);
      ObjectSet("LOTUS"+IntegerToString(i),OBJPROP_COLOR,clrSalmon);
      ObjectSet("LOTUS"+IntegerToString(i),OBJPROP_WIDTH,10);
      ObjectSet("LOTUS"+IntegerToString(i),OBJPROP_BACK,1);

 }
You may not get the exact low or high, but you should be really close to one.

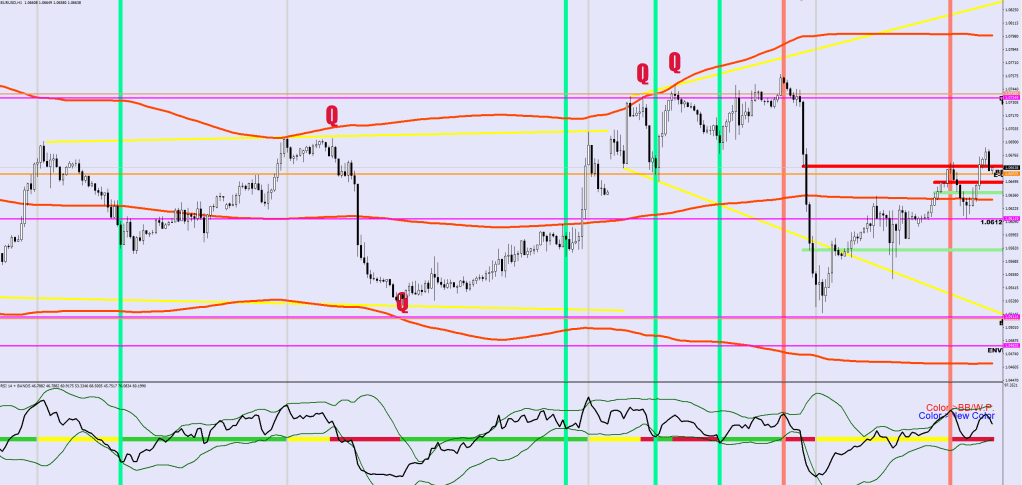
The Q’s were made for the 4 hour, yes, but seem to work here just fine.
        if (iFractals(symbol,0,MODE_UPPER,i) && High[i]<iBands(symbol,0,30,2,0,PRICE_MEDIAN,MODE_UPPER,i) && High[i]>iBands(symbol,0,216,2,0,PRICE_MEDIAN,MODE_UPPER,i) && High[i]==iHigh(symbol,0,iHighest(symbol,0,MODE_HIGH,200,i))){
        ObjectCreate("Telecom"+DoubleToStr(i), OBJ_TEXT, 0, Time[i], High[i]+380*Point);
         ObjectSetText("Telecom"+DoubleToStr(i), "Q", 44, "Impact",  Crimson);
         udir[i]=0;
      }

         if (iFractals(symbol,0,MODE_LOWER,i) && Low[i]>iBands(symbol,0,30,2,0,PRICE_MEDIAN,MODE_LOWER,i) && Low[i]<iBands(symbol,0,216,2,0,PRICE_MEDIAN,MODE_LOWER,i) && Low[i]==iLow(symbol,0,iLowest(symbol,0,MODE_LOW,200,i))){
        ObjectCreate("Telecom"+DoubleToStr(i), OBJ_TEXT, 0, Time[i], Low[i]+180*Point);
         ObjectSetText("Telecom"+DoubleToStr(i), "Q", 44, "Impact",  Crimson);
         udir[i]=1;
      }
There is no exact scienece here, there are not even right conclusions. There are pushes towards a decision that you can live with for it works off of a lot of variables and filters.