
I always get pissed off by people using scientific sounding words to refer to something they themselves are unable to define.
Perhaps it’s because I think like a programmer. Discretionary stuff like “structure” and “taking a buy setup” is meaningless since there is no binary flowchart that I can turn into code.
At the same time, less arrogant expressions can find their way into useful tools.
For instance, sell weakness can be a collection of expressions, that would include:
– 3 failures (fractal prints) near the 4H 30-sample BB.
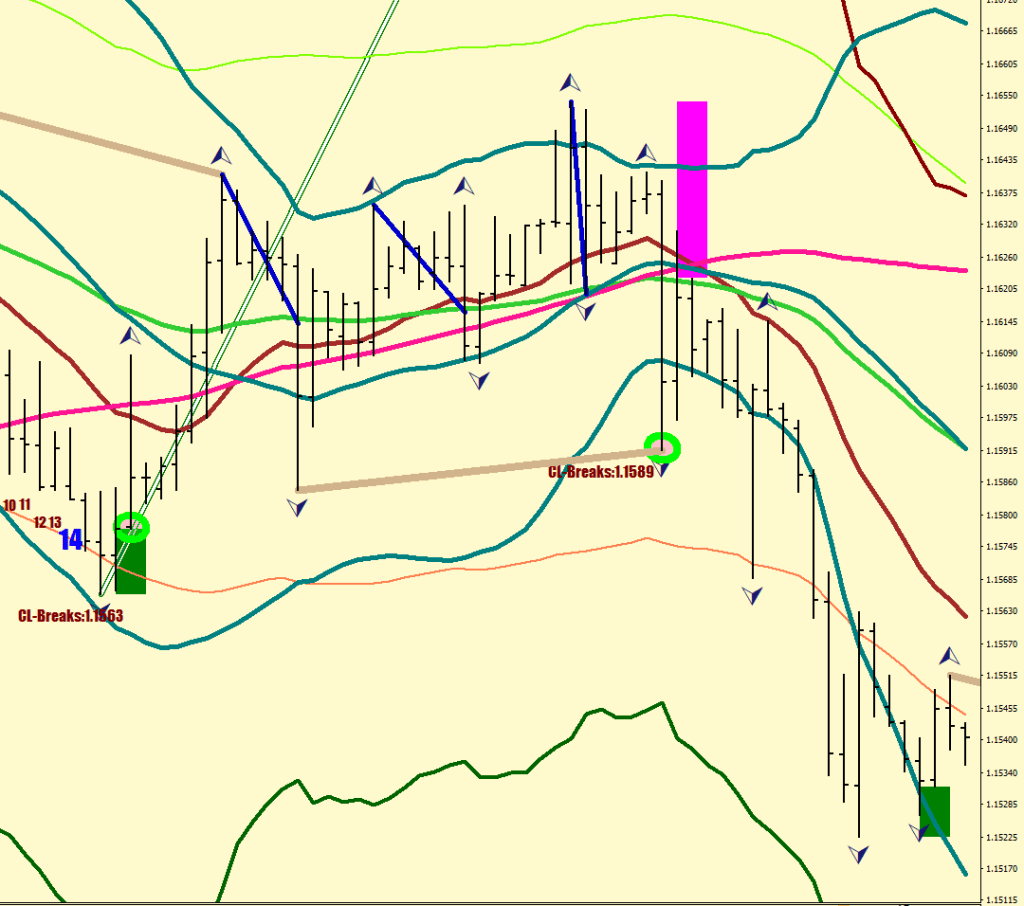
The blue diagonals show tie-offs touching the 9-day EMA (52 EMA on 4H).
– Or sell the beat of the 6th gray diamond on the 30-minute.
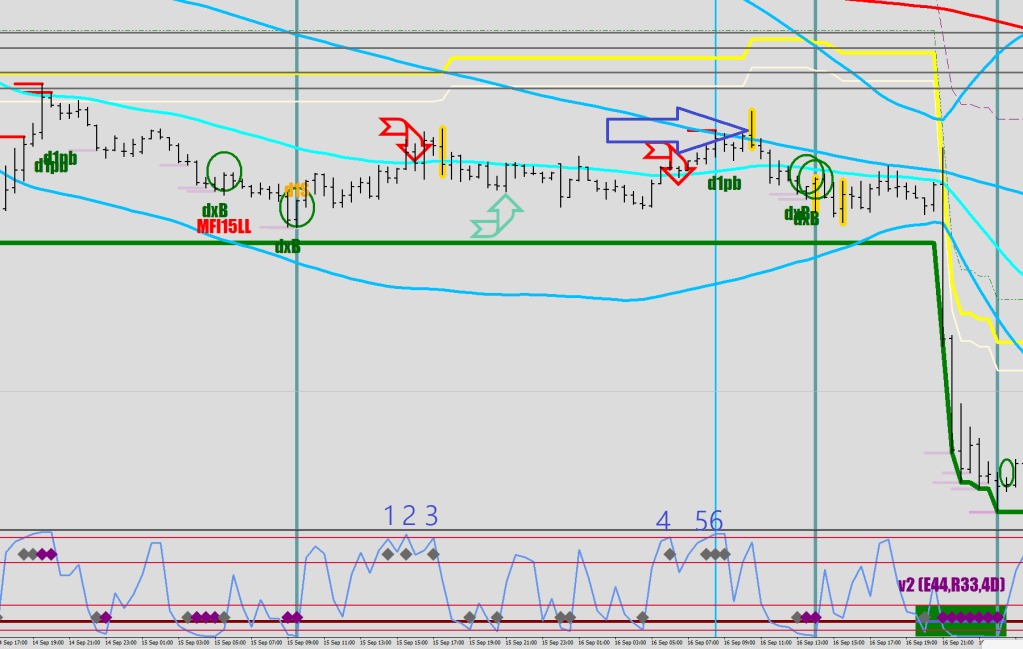
The collection of exits similarly would be made up of different things.
An hourly gray volatility compression divergence is one of the events that seem to score high.
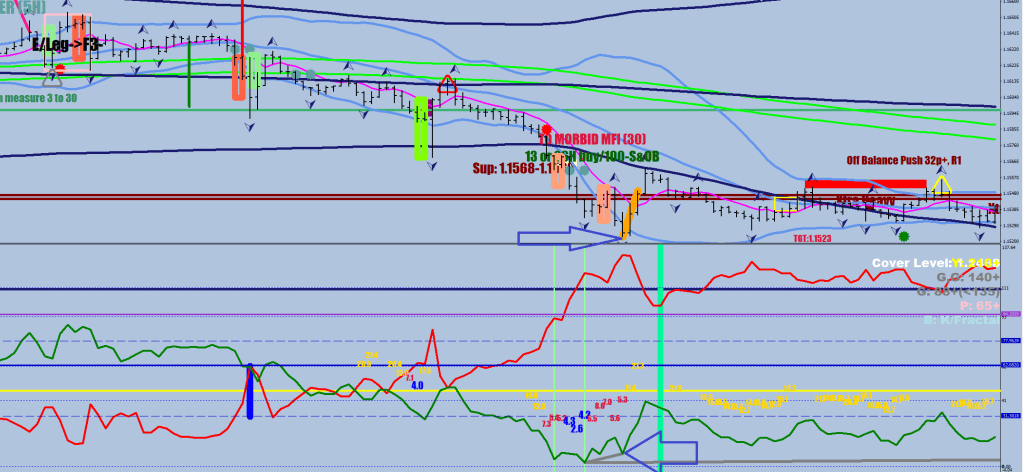
Now, I was missing one of the plausible definitions for “buy strength” last Friday.
Check out this immense Money Flow divergence upon re-testing (matching) the 200-hour low.
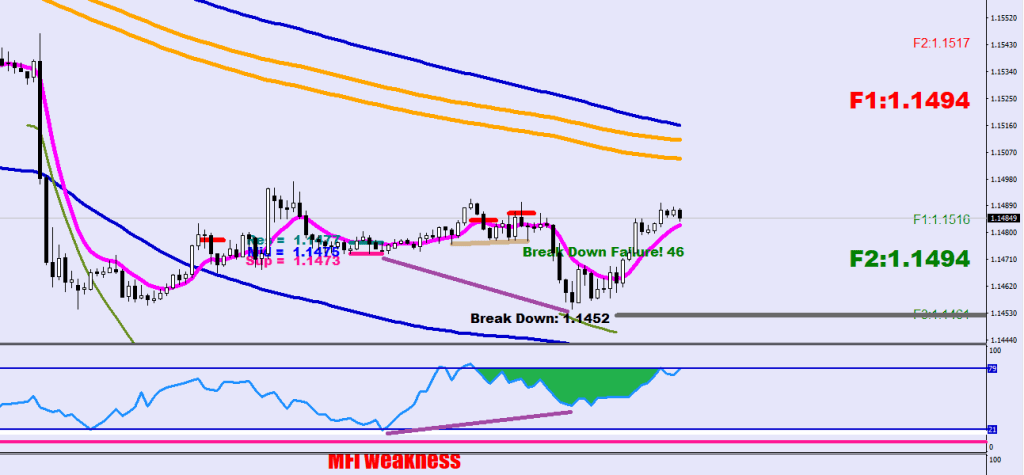
The lowest MF print was 43.87, where the sell off hit the price bracket. With such bullish money flow, the breakdown was doomed.
I could use a shortcut, however. For instance, an 8-pip drop in downside volatility, meaning a 30-minute candle closing back by 8+ pips after a volatility print exceeding 24. Just as there is flat top-drop, there is flat bottom-lift.
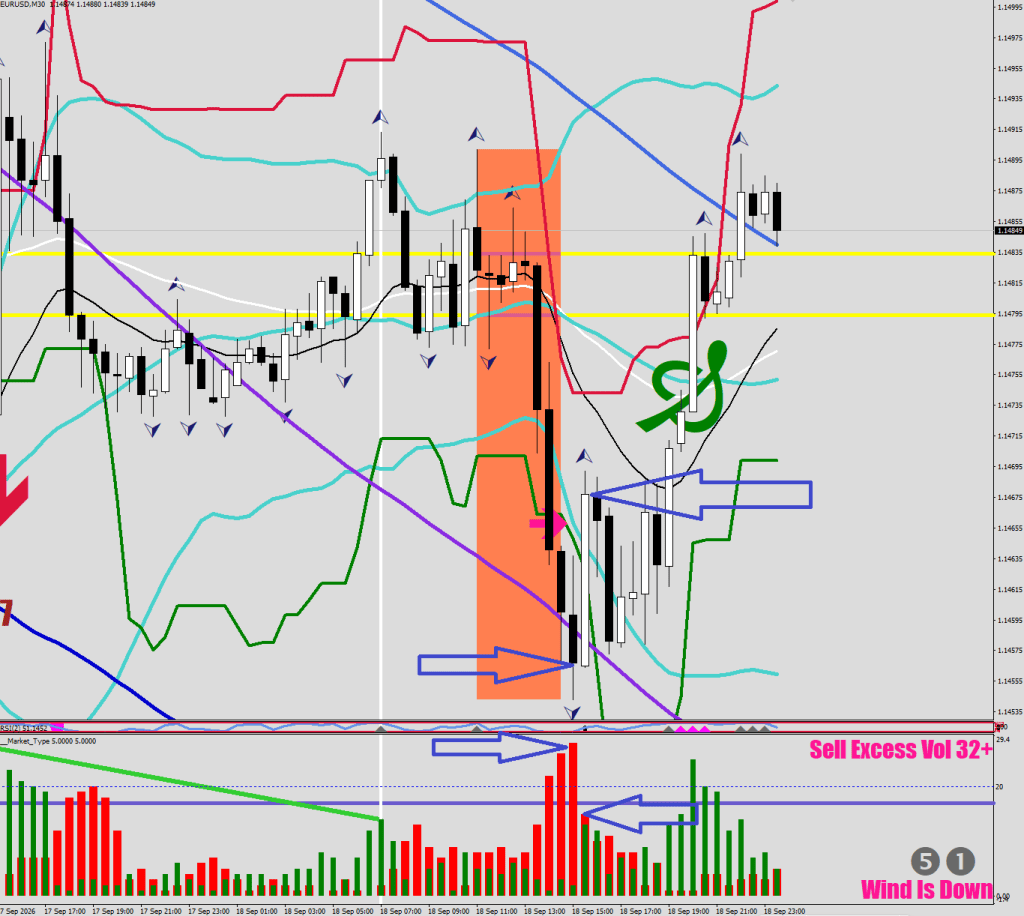
See, this is a must. A binary answer. Buy or don’t. Sell or not.
See, ideally there would be a lower low.
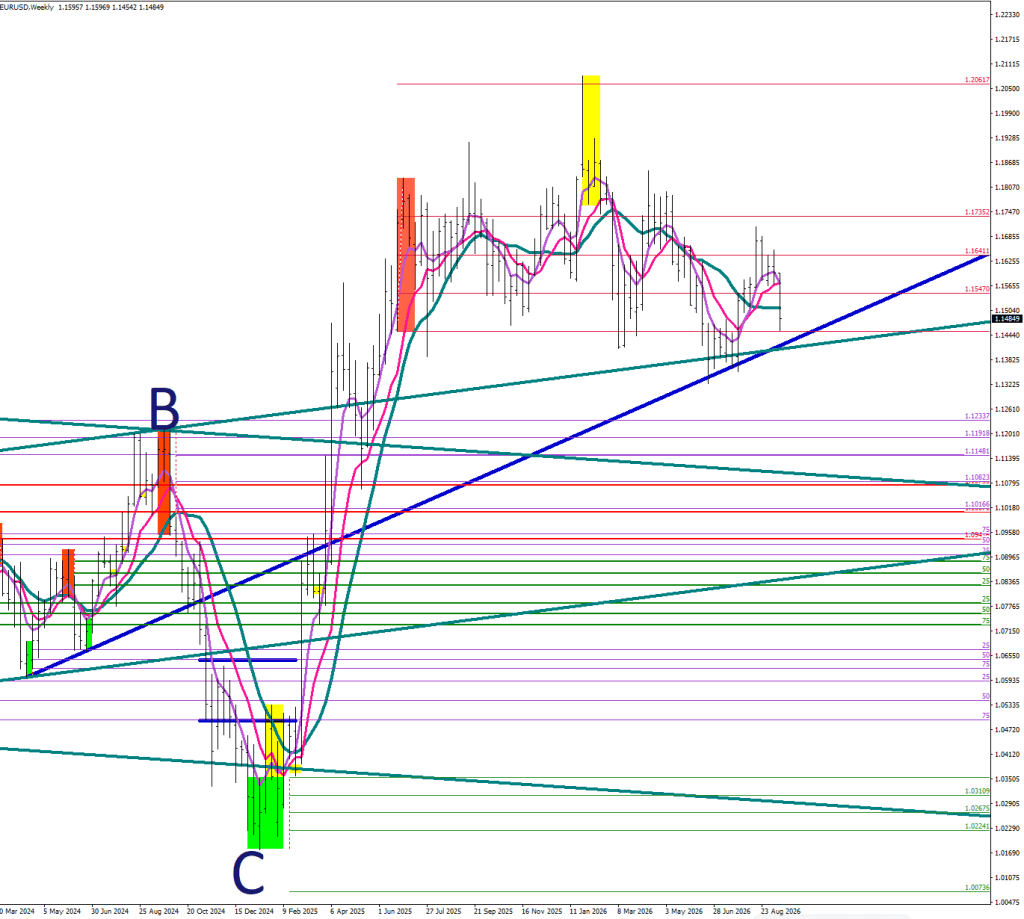
See in this TA chart, where the bars are indicators of price data in a two-dimensional field and trendlines indicate possible limits, both the blue and the green trendlines could chip in for some support.
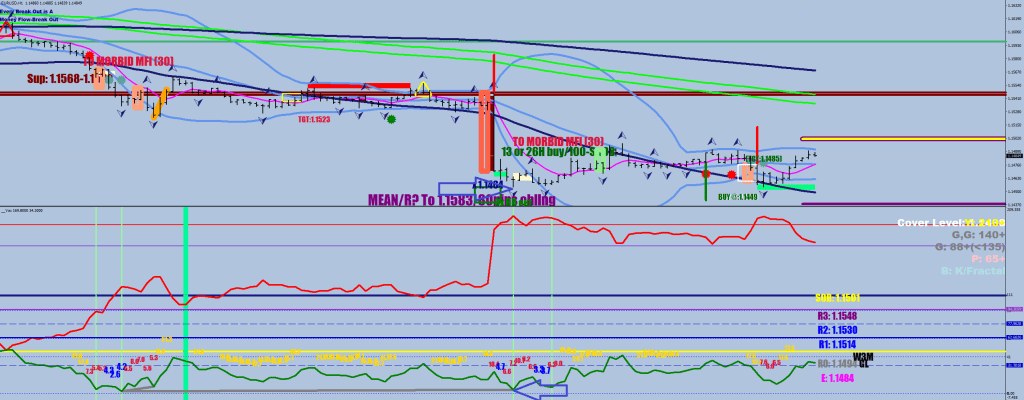
There is still a high-volume node between 1.1440 and 1.1437 (cyan numbers).
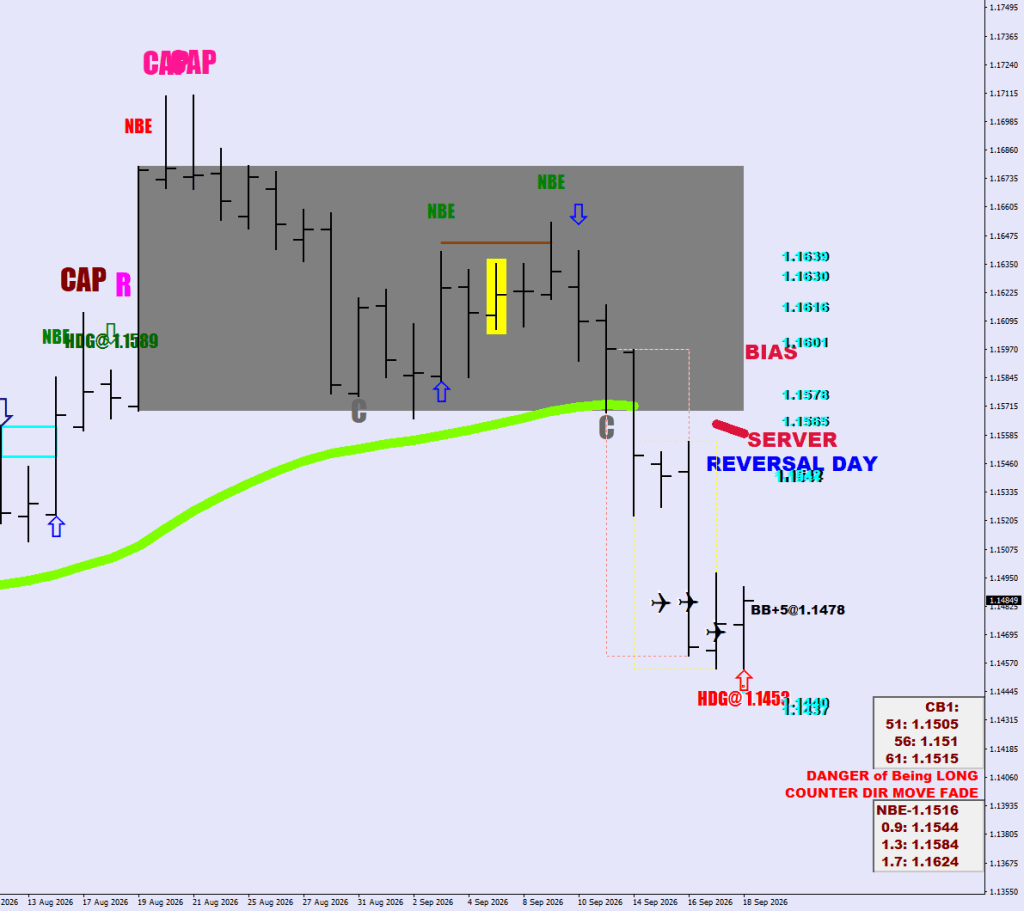
The projected exit block (support zone is 1.1442-1.1400)
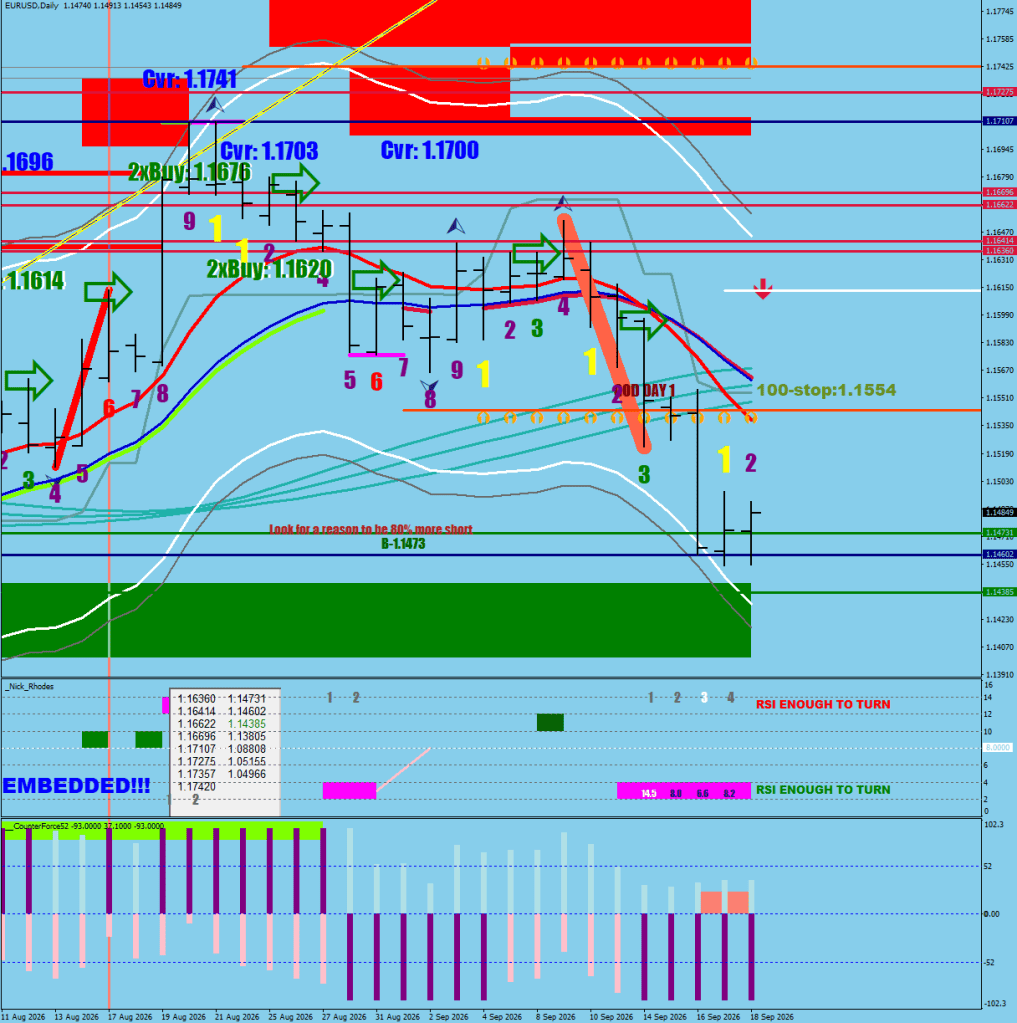
The daily stochastic is still embedded to the downside, and the retracements have only marginally exceeded the R0 level so far.
My vote is on no mean reversion yet, lower low first.

