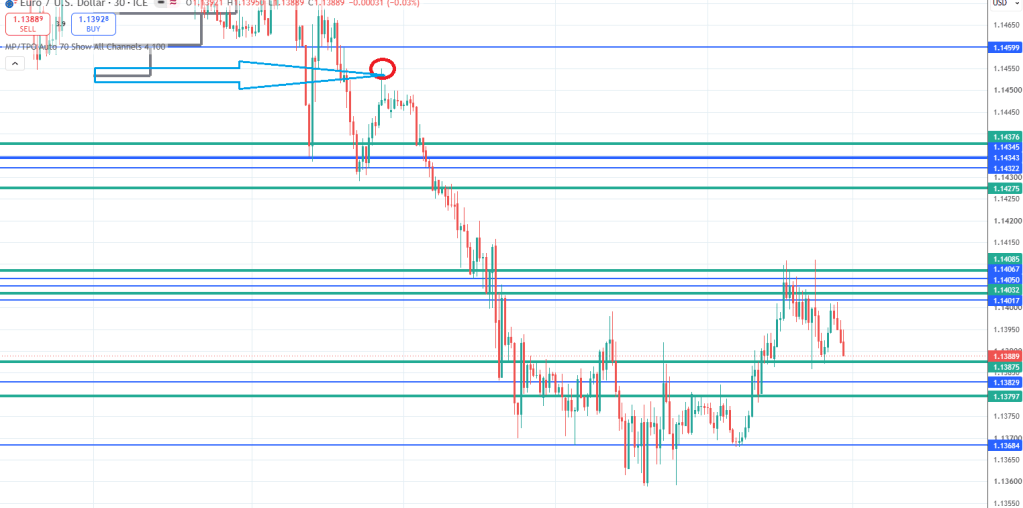
The starting point of a mean reversion is a capsizing of the holdings.
My proxy for holdings detection is the “balance of reset” value calculated from the last stochastic divergence.
I am fascinated with this subject, as I seem to come across deeper mechanical undertanding such as where capsizing becomes a real danger. As it turns out, about 2/3 of directional bets facing a slow down carries an impending mean reversion.
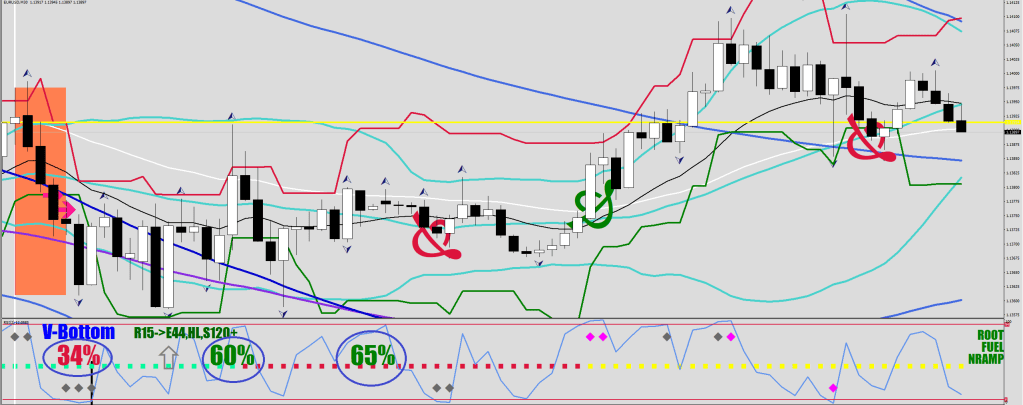
In other words, a print at or below 33% or a print at or above 66% shows a counter-productive market with a high risk of an impending reversal.
What I am measuring is the average of the RSI2 prints until the opposite extreme from the last Market Type divergence.
For instance:
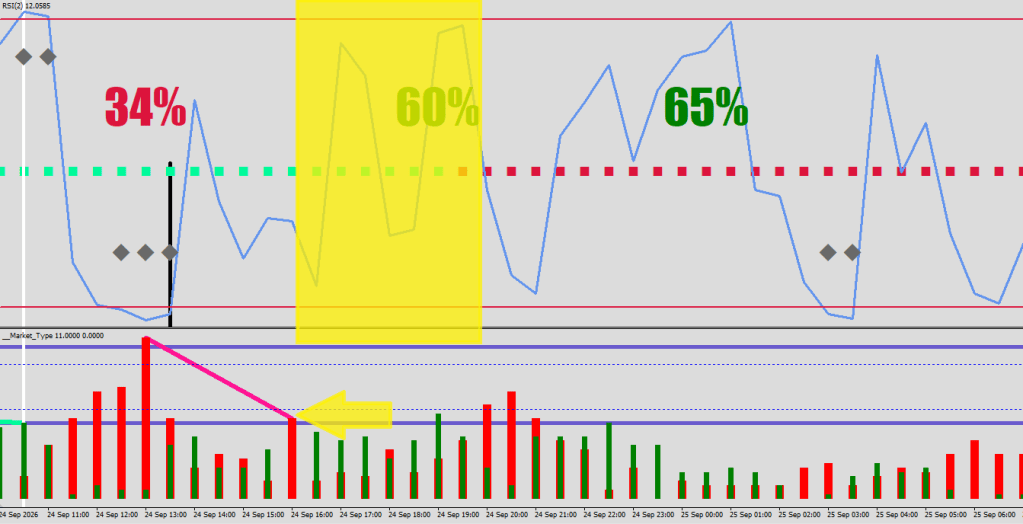
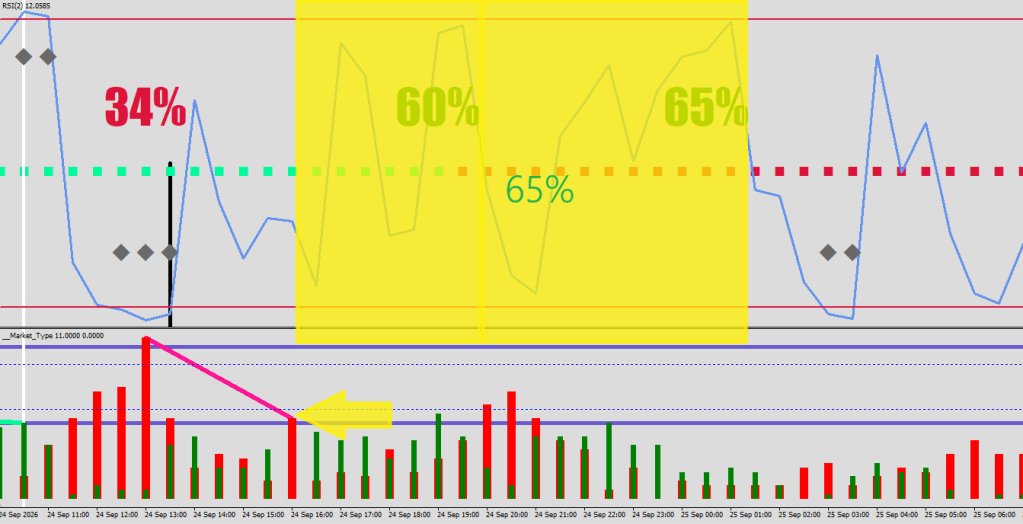
A change from almost 2/3 short to almost 2/3 long is a total capsizing.
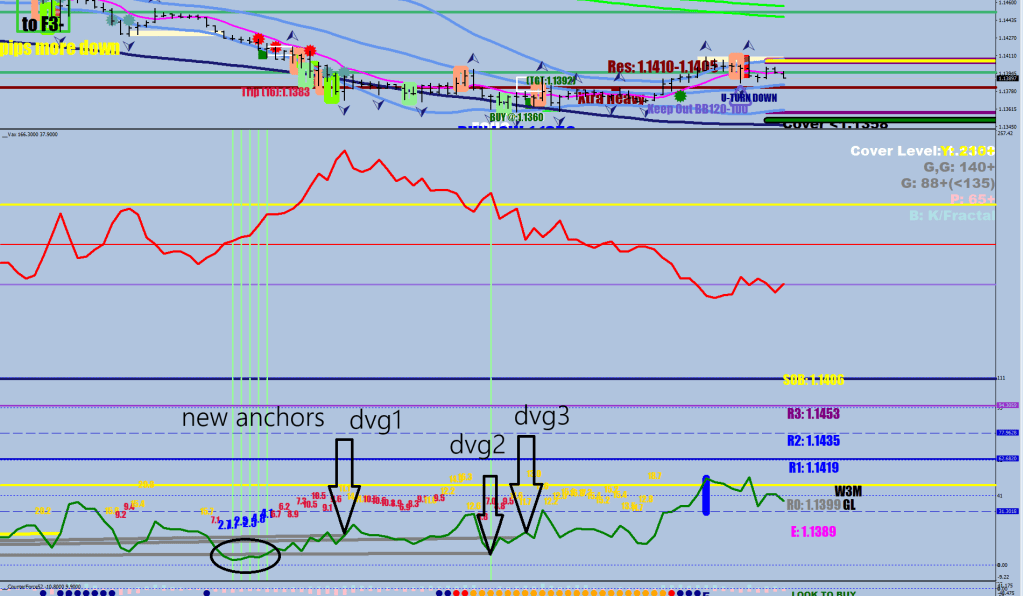
Two gray divergences after a new volatility compression anchor is a prime way to find a period of “slowing”.
The orange dots on the bottom are maximum squeeze; when it goes to red, then blue, it is starting to release – in this case to the upside of course.
After capsizing, the stochastic unraveling (going from one extreme to the other) is providing the fuel necessary for the return.
A trending move often has a telltale, a “failed auction,” saying that the move is on, but the actual starting point is made by a conscious bet made around the fair price, not waiting for a deep, 30% discount. This aggression could form around the backtest of the 120 SMA (30 min).
Once the move is in place, the E44 would serve as a limit, and at greater compression, the E16.
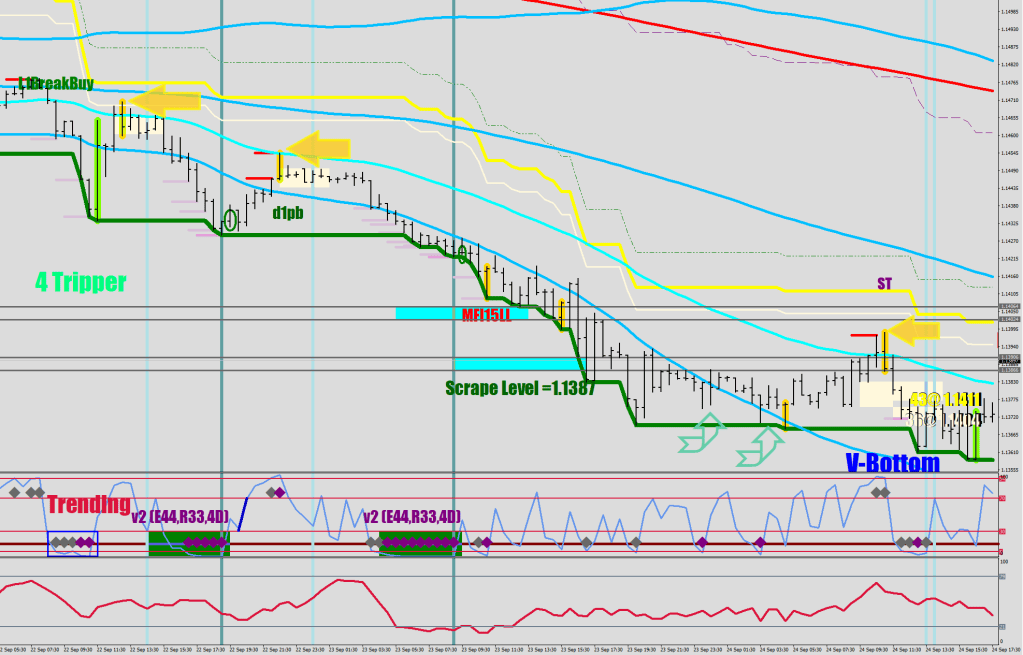
The yellow arrows show the trip highs.
//4-hour high vol surge & reversal
if (High[i+1]==iHigh(symbol,0,iHighest(symbol,0,MODE_HIGH,8,i+1)) && Close[i+1]<iBands(symbol,0,30,2,0,PRICE_MEDIAN,MODE_UPPER,i+1)
&& High[i]<High[i+1] && High[i+1]-Low[i+1]>80*Point
&& Low[i+1]>iBands(symbol,0,30,2,0,PRICE_MEDIAN,MODE_LOWER,i+1)
&& (Close[i+1]<Open[i+1] || (Close[i+1]<High[i+1]-(High[i+1]-Low[i+1])/3*2)  )){
 ObjectCreate("Fox"+IntegerToString(i),OBJ_TREND,0, Time[i+1], High[i+1], Time[i+1], Low[i+1]);
      if (High[i+1]-Low[i+1]>130*Point) {ObjectSet("Fox"+IntegerToString(i),OBJPROP_COLOR,clrOrangeRed);
         if (High[i+1]<iBands(symbol,0,30,2,0,PRICE_MEDIAN,MODE_UPPER,i+1)) {ObjectCreate("DOGZ"+IntegerToString(i),OBJ_TEXT, 0, Time[i+3],High[i+1]+90*Point);
         ObjectSetText("DOGZ"+IntegerToString(i),"A", 36, "Impact", clrRed);
              }
         if (iHigh(symbol,0,i+1)>iHigh(symbol,0,iHighest(symbol,0,MODE_HIGH,8,i+2))) {ObjectCreate("DOGZ"+IntegerToString(i),OBJ_TEXT, 0, Time[i+3],High[i+1]+190*Point);
         ObjectSetText("DOGZ"+IntegerToString(i),"4 Tripper", 36, "Impact", clrRed);

         }
          if (iHigh(symbol,0,i+1)>iHigh(symbol,0,iHighest(symbol,0,MODE_HIGH,8,i+2))
          && High[i+1]<iBands(symbol,0,30,2,0,PRICE_MEDIAN,MODE_UPPER,i+1)) {ObjectCreate("DOGZ"+IntegerToString(i),OBJ_TEXT, 0, Time[i+3],High[i+1]+90*Point);
         ObjectSetText("DOGZ"+IntegerToString(i),"4A", 36, "Impact", clrRed);
           // FourAU[i]=High[i+1];
         }
      }
      else {ObjectSet("Fox"+IntegerToString(i),OBJPROP_COLOR,clrGold);
       if (stoch[i+1]>80 && High[i+1]<iBands(symbol,0,30,2,0,PRICE_MEDIAN,MODE_UPPER,i+1)

       && (iBands(symbol,0,30,2,0,PRICE_MEDIAN,MODE_UPPER,i+1)-iBands(symbol,0,30,2,0,PRICE_MEDIAN,MODE_LOWER,i+1))>460*Point
       ){
               ObjectSet("Fox"+IntegerToString(i),OBJPROP_COLOR,clrOrange);
               ObjectCreate("DOGZ"+IntegerToString(i),OBJ_TEXT, 0, Time[i+3],High[i+1]+90*Point);
                ObjectSetText("DOGZ"+IntegerToString(i),"A(2)", 36, "Impact", clrRed);

         }
      }
      ObjectSet("Fox"+IntegerToString(i),OBJPROP_WIDTH,13);
      ObjectSet("Fox"+IntegerToString(i),OBJPROP_RAY_RIGHT,false);
       ObjectSet("Fox"+IntegerToString(i),OBJPROP_BACK,1);
}
To prevent a mean reversion from playing out in full, they must step up at about a fluctuation maximum (41 pips) before the E-414 band (guard rail).
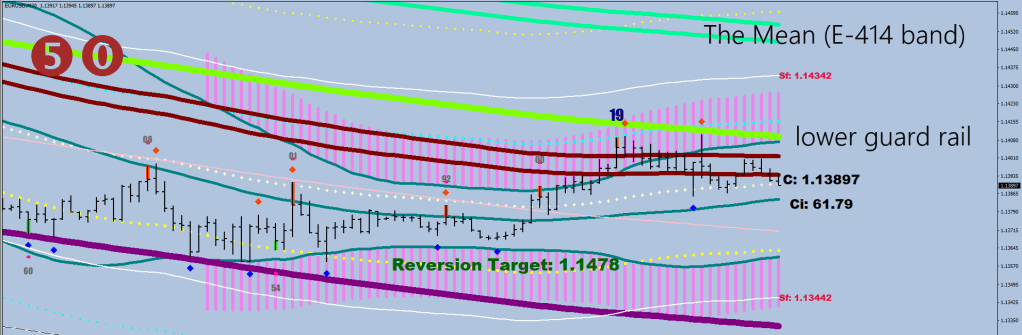
The E-414 band, of course, isn’t a hard stop; the momentum would typically carry the price past, by up to a fluctuation maximum as well.
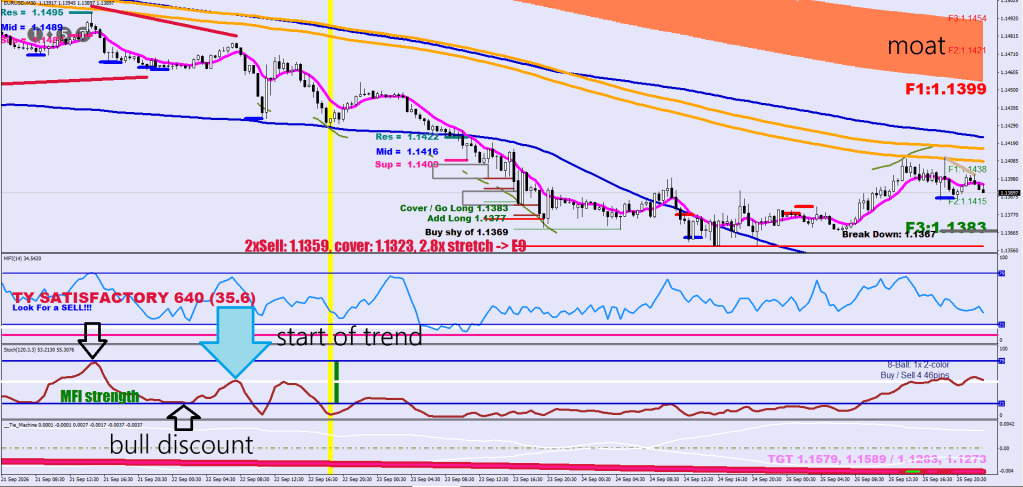
I’ll teach you a new way of looking at the stochastic reading. The only one that makes sense is 120-sample on the 30-minute, which is 60 on the 60. Only the main line; don’t confuse yourself. A 50% read is a fair price. 80% is 30% discount for bears; 20% is a 30% discount for bulls.
The true resistance of the downtrend is the moat. This is between 1 fluctuation maximum from the mean and the 712 SMA (30-min). When it is wider than 27 pips (35.6 currently) it is to be considered impenetrable on a single try.
As for duration, a mean reversion takes around 48 hours on average to play out. The distance isn’t always large, although even a 2.5x fluctuation-maximum move is still more than 100 pips, but the speed is an important factor which could elevate this into a worthwhile weekly options play.
All in all, it seems like the bulls dropped the matzo ball into the close, but as a setup, this is still bullish until the stochastic goes overbought.
Two clips today, they are fighting it out.
This was the rejection at the previous week’s low: