I’m starting to get fed up with the countless cowboys popping up on YouTube channeling their misunderstanding of how the market works, their pseudo knowledge.
We’ll start nice and slow, so that everyone would be able to follow.
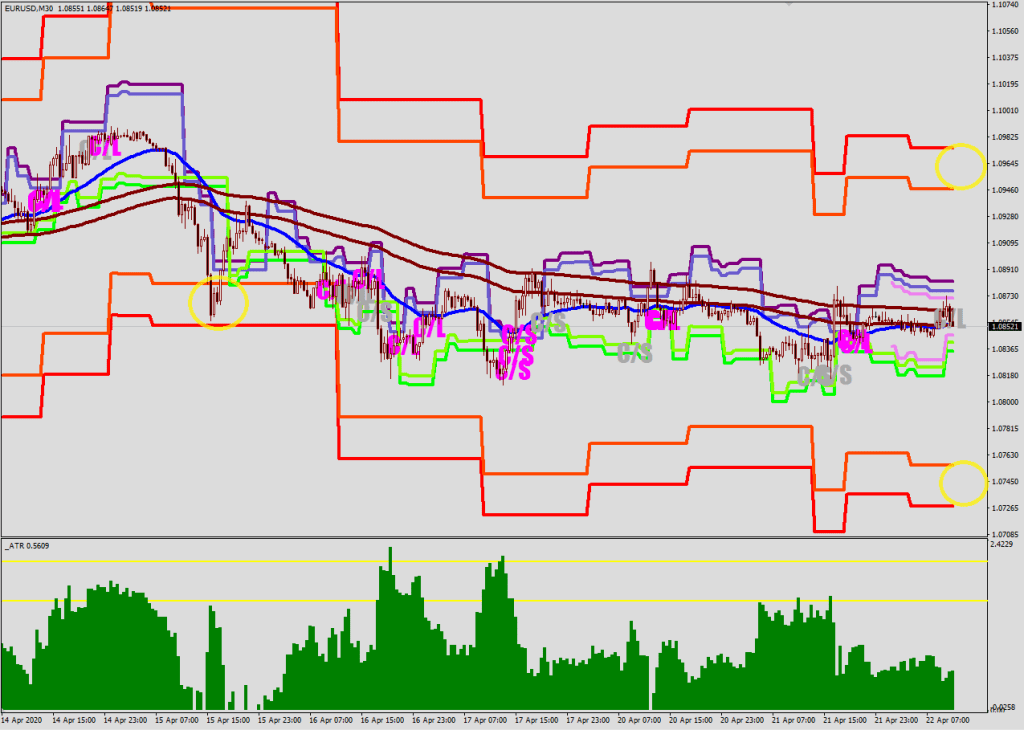
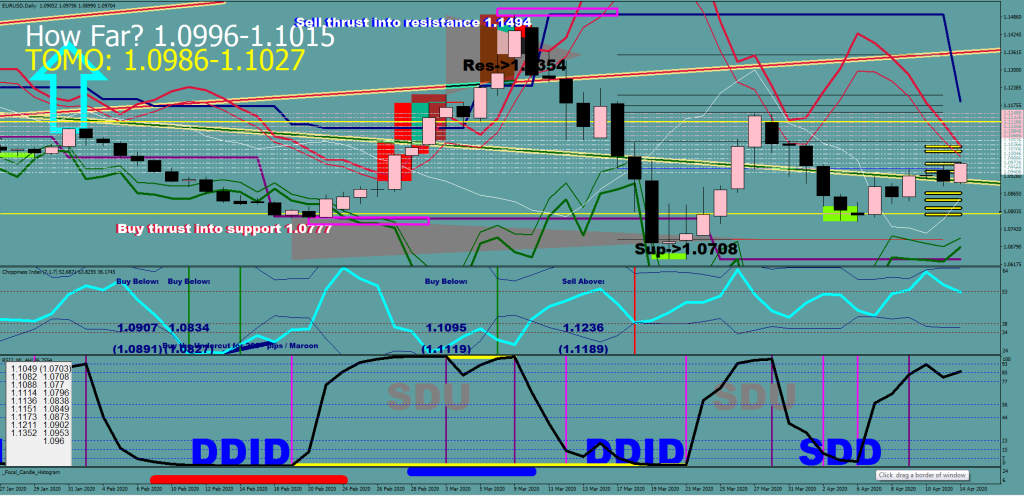
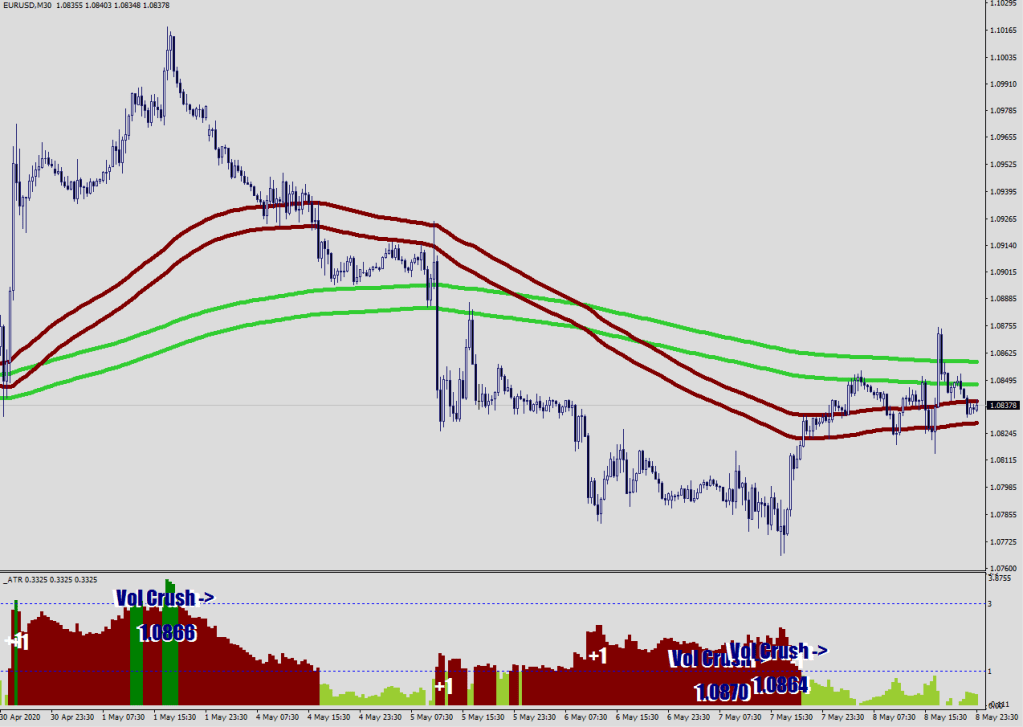
This is a 4-hour chart.
The important plots are
– the Green River (E52 median)
– Mr. Maroon (E17 median)
– Fractals
– Stretch Marker (on the bottom saying ATR) free source in my post, Disappearing Volatility
– and the latest version of 36 Only VRLD – that is attainable from me in exchange for a donation.
We pick up at the end of January.
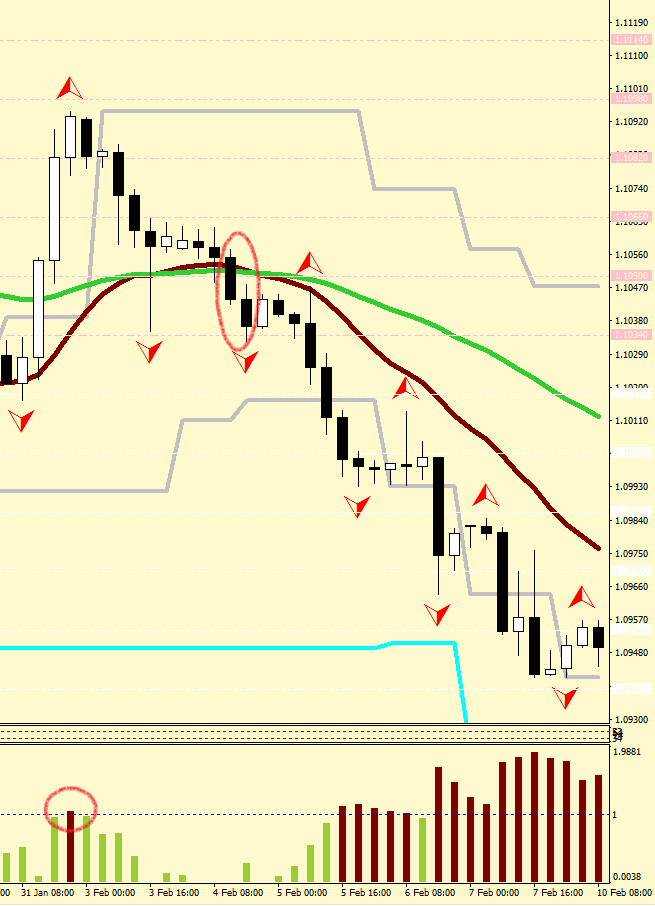
On the Stretch Marker Below, you can see a move failing to sustain above 1x stretch from the mean. This is our current starting point.
Then price made a 2-candle crack & close below the Green River.
All systems go to the downside.
The market was trending lower ever missing the middle of Mr. Maroon and staying off of the cyan line, which is a displacement of the swing lows by a fluctuation maximum of the EUR/USD –
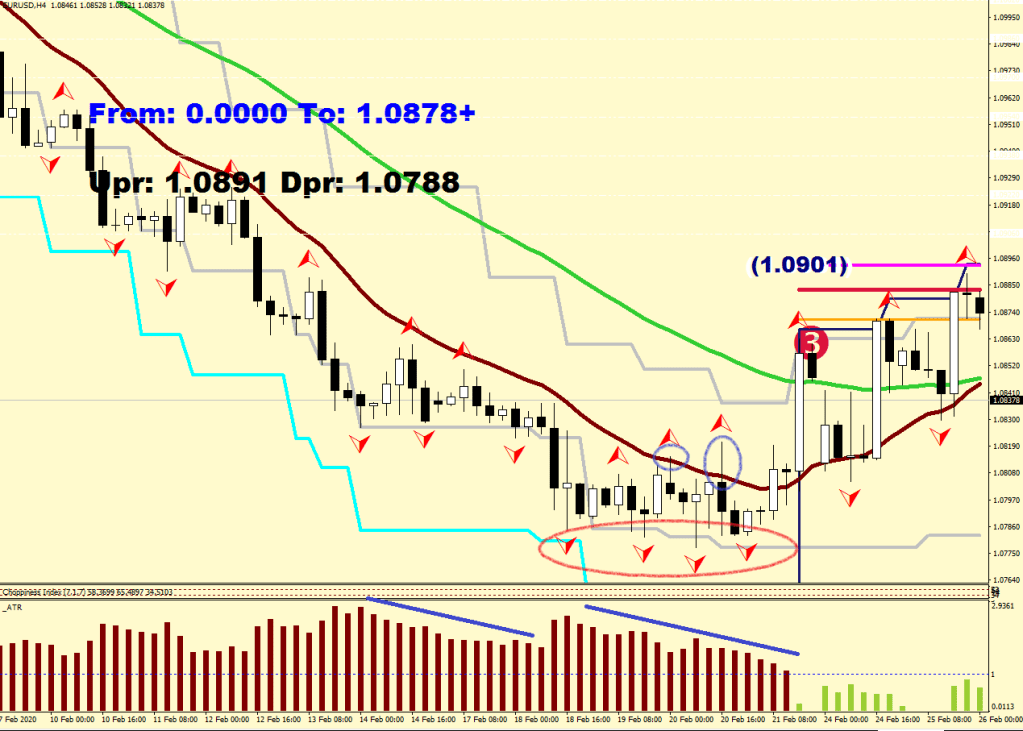
until the following thing(s) happened.
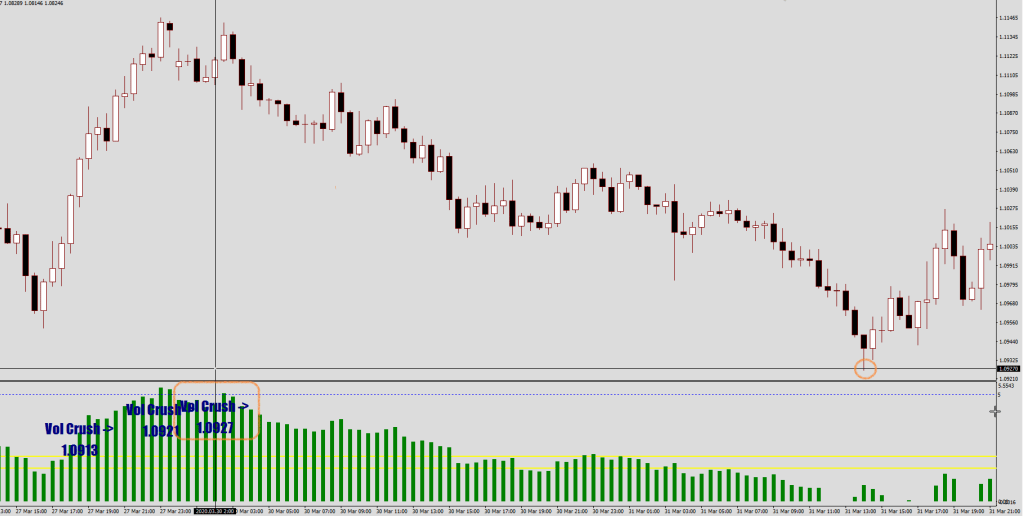
The volatility started declining. See slanted blue lines. Mr. Maroon was popped and violated again (Primary target fill). There were 4 fractals lining up at approximately the same height.
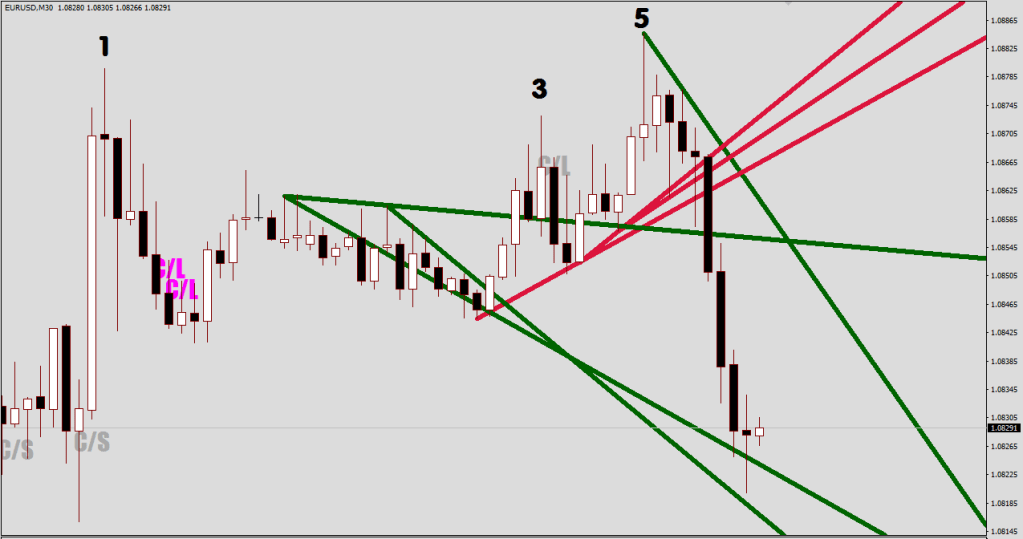
I will let you circle where the Green River was crossed over with two closes and there was no weekend gap potential.
All systems no go to the upside.
The first cyan encounter was a bust for the candle just ripped through and never looked back.

The second encounter made its reaction, but the Primary Target was not reached, the move failed next to Mr. Maroon – makes sense to lighten nearby.
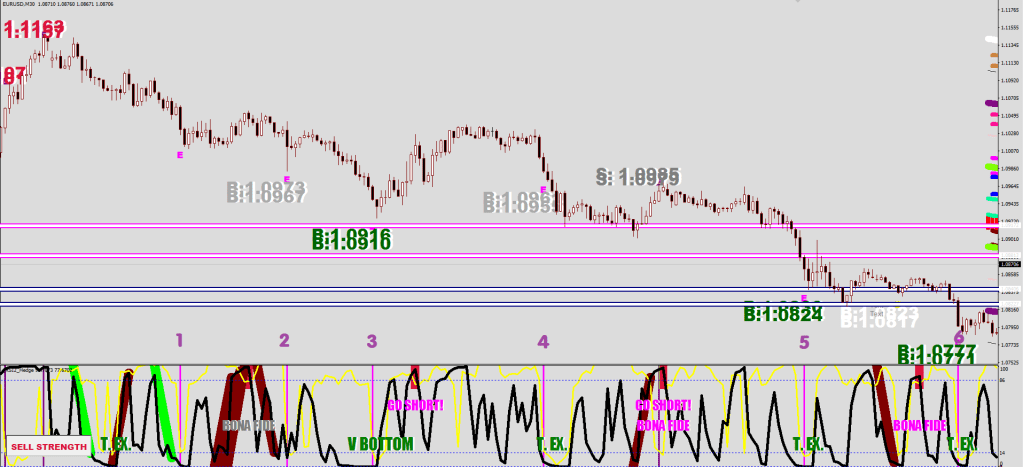
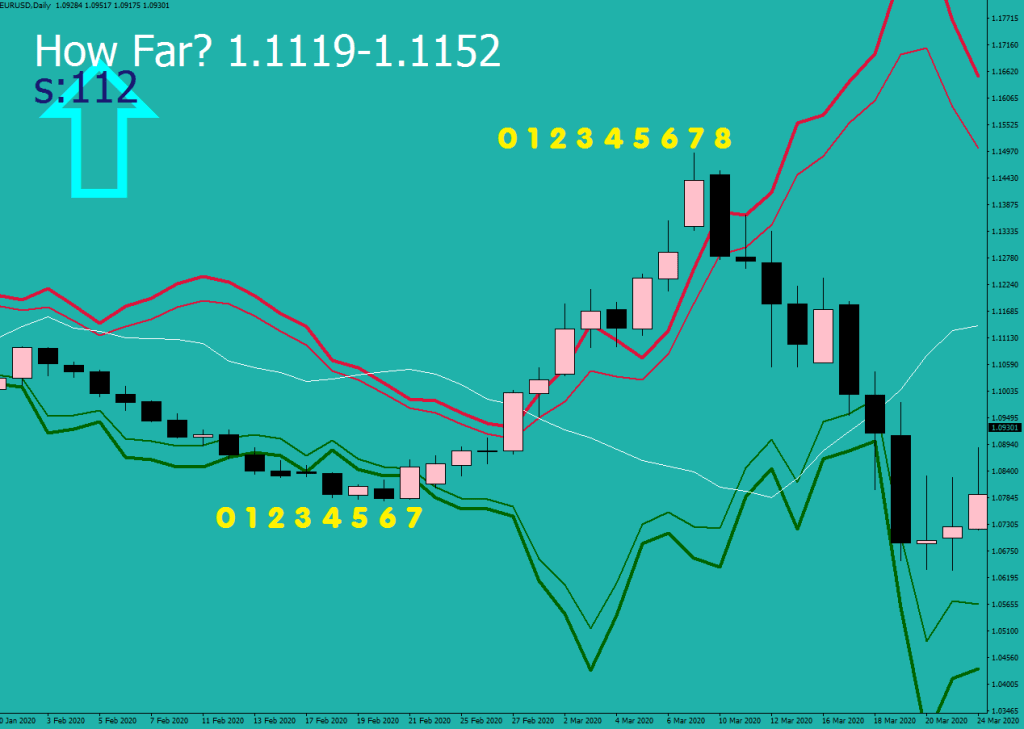
Something ridiculously important happened on the bottom. Price went beyond 4x stretch from the mean. From here on the cyan line switches from Primary Sell to Spiral Buy.

Everything is a buy: break-outs at the Cyan line as well as all the beats at the other side or Mr. Maroon. The whole thing goes exponential until the stretch from the mean reaches a 9.5 multiplier, and price becomes unable to sustain above the Cyan fluctuation maximum displacement. This is the primary failure which had its target set at the last read of Mr. Maroon at 1.1236 and the secondary failure followed soon after with a reach & fail for the top (with volatility having started to decline). The secondary fail’s target is the location of the mean, which was at 1.1138 at the previous 4-H candle.

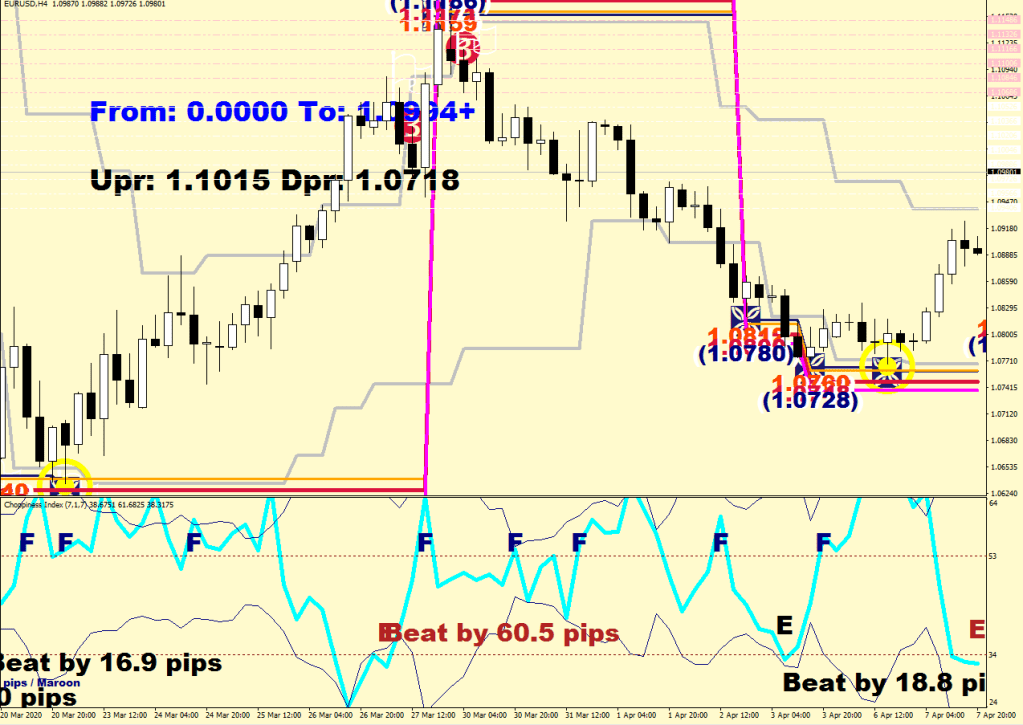
After that you see a cross over of the Green River, then a failed attempt to break above it.
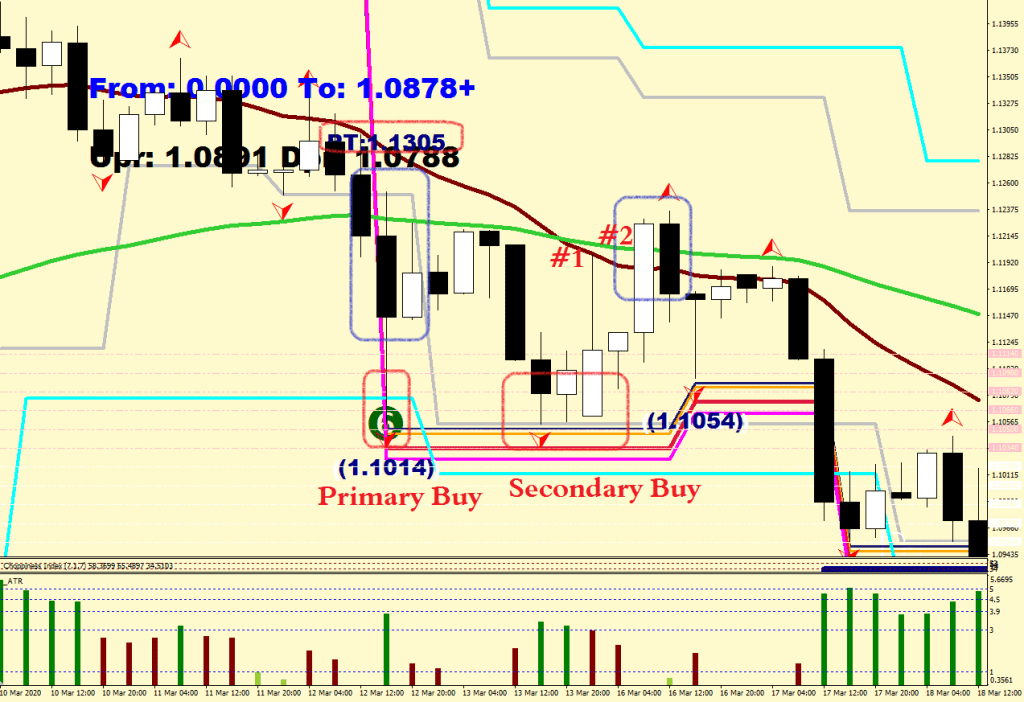
The consolidation that takes places below the Green River comes with playable upside. The Primary Buy can’t fulfill its full length target, only manages a touch of Mr. Maroon further down, right after the Secondary Buy gets called in with a re-visit of the low, which does ultimately manage full length at 1.1220 and change.
All systems go to the downside again.
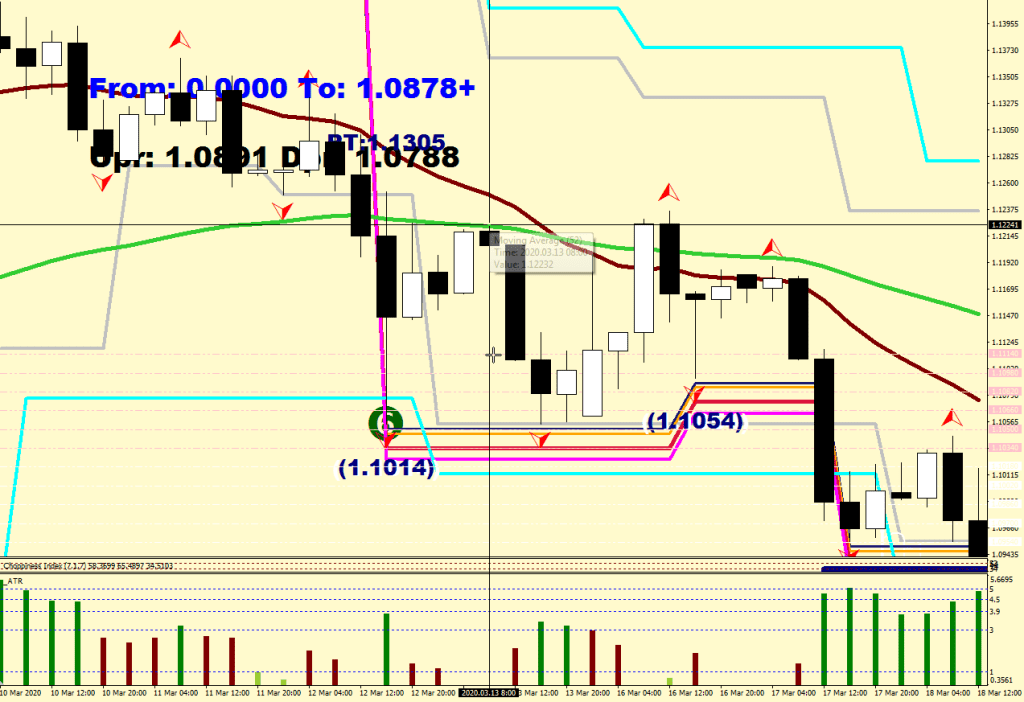
On the way down the Cyan (Maximum Beat) line fails to hold, and the Cyans transition from Primary Buy to Spiral Sell with the stretch from the mean rising above 4x again.
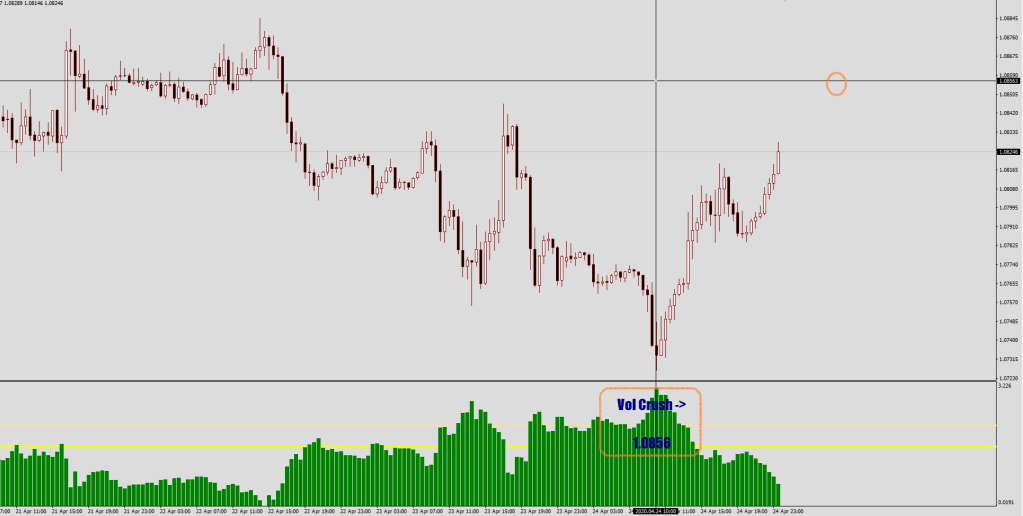
We end up with a mirror image more or less of the reversal at the top: 9.5x stretch from the mean, a 3-candle volatility drop, which sets the primary target as shown by the arrow, and the secondary buy gets called in at the re-visit and slight beat of the low.
The Green River gets crossed over again, the pullback to Mr. Maroon is a buy again until a Primary Sell appears at the cyan line failure.
There is no secondary entry this time: this is a continuation lower low down. P.T. on the screen.
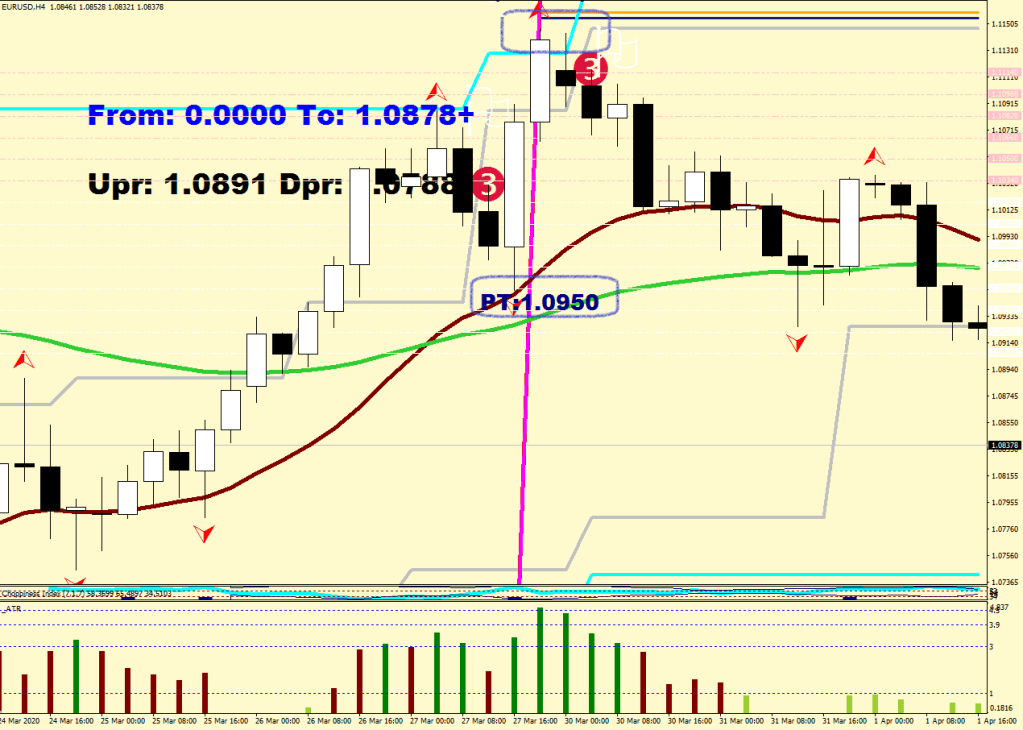
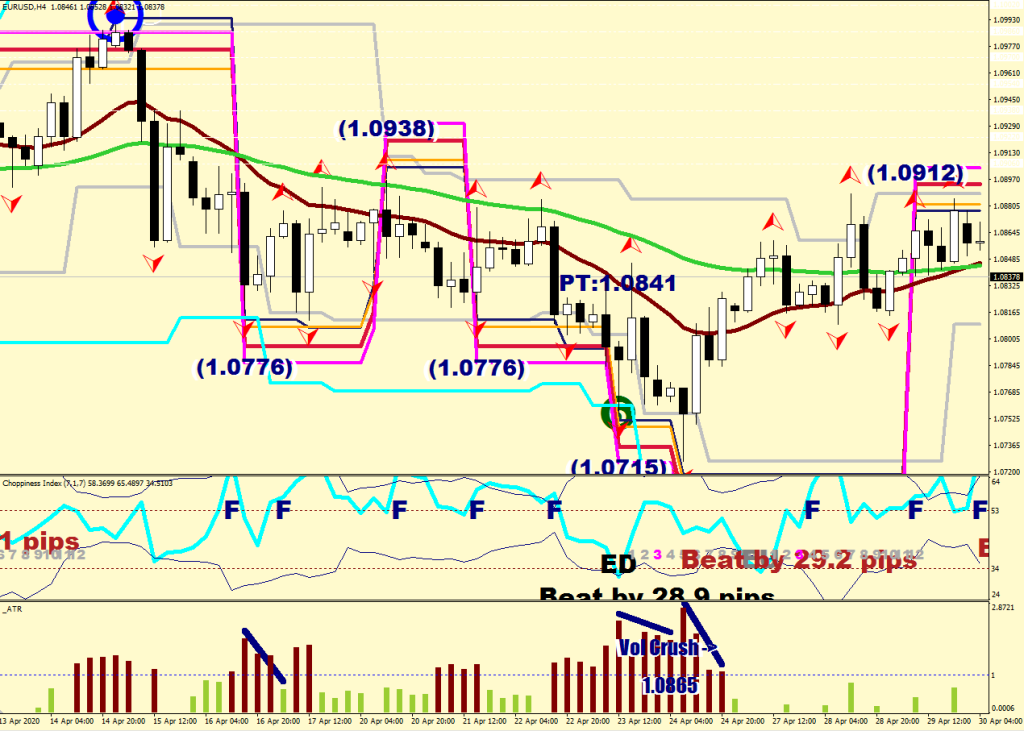
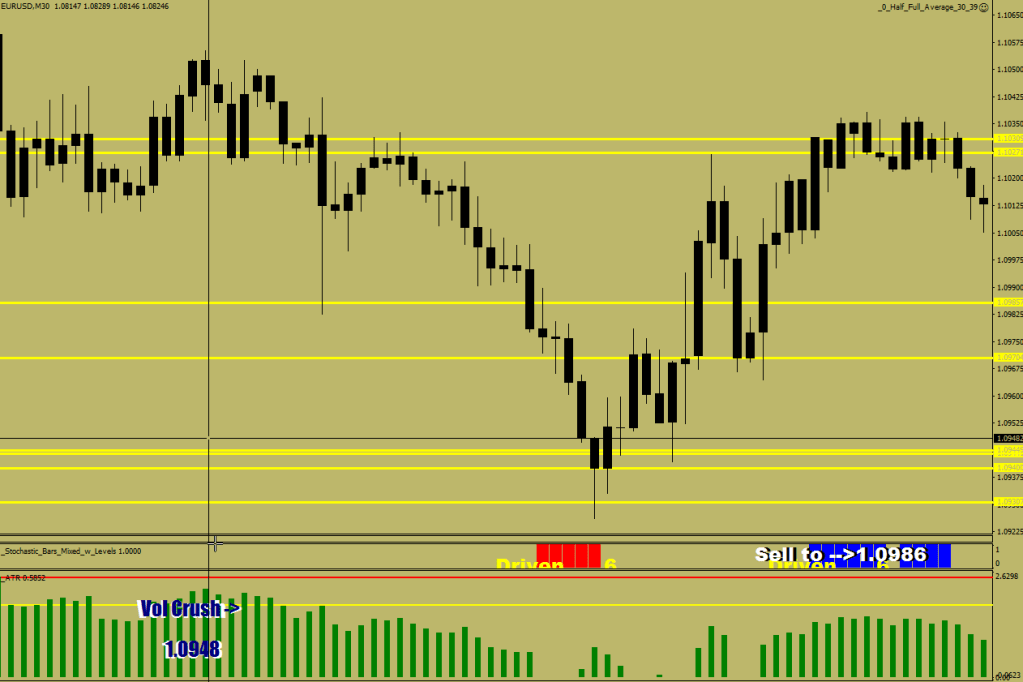
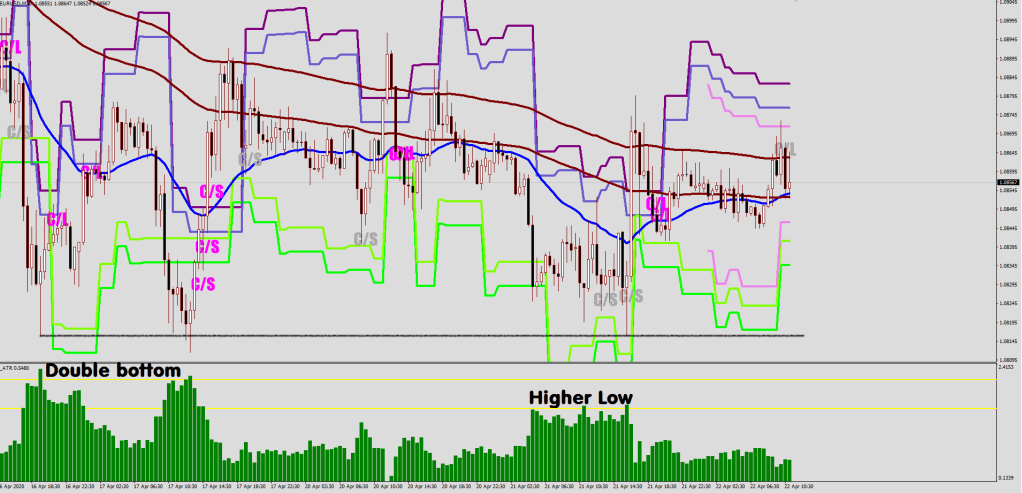
You get to circle the first failure for crossing over the Green River on the image above.
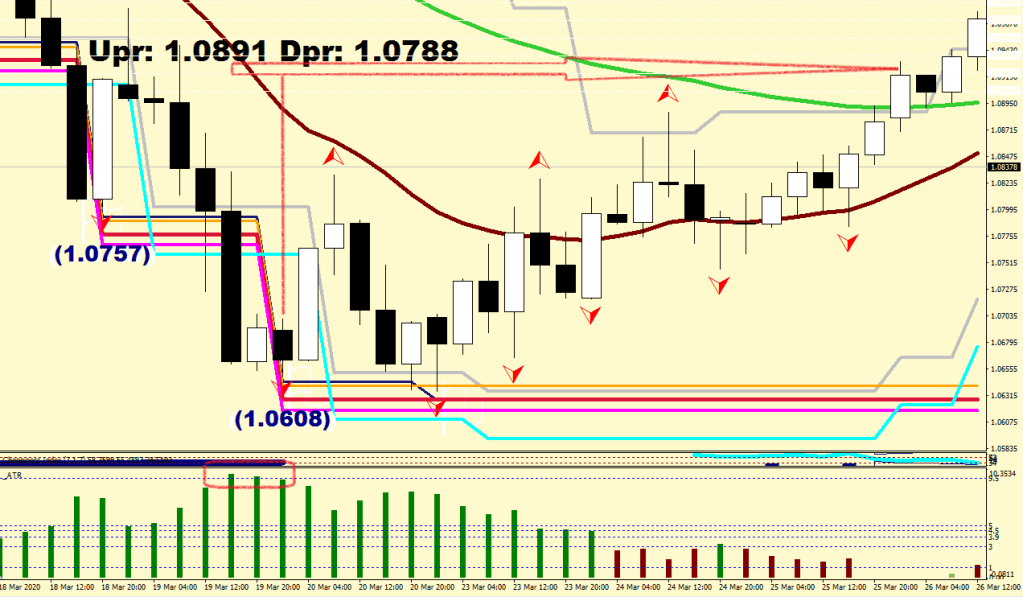
But the Green River does get crossed. You get 20+ hours of consolidation to get in on a short as close as possible to the Green River.
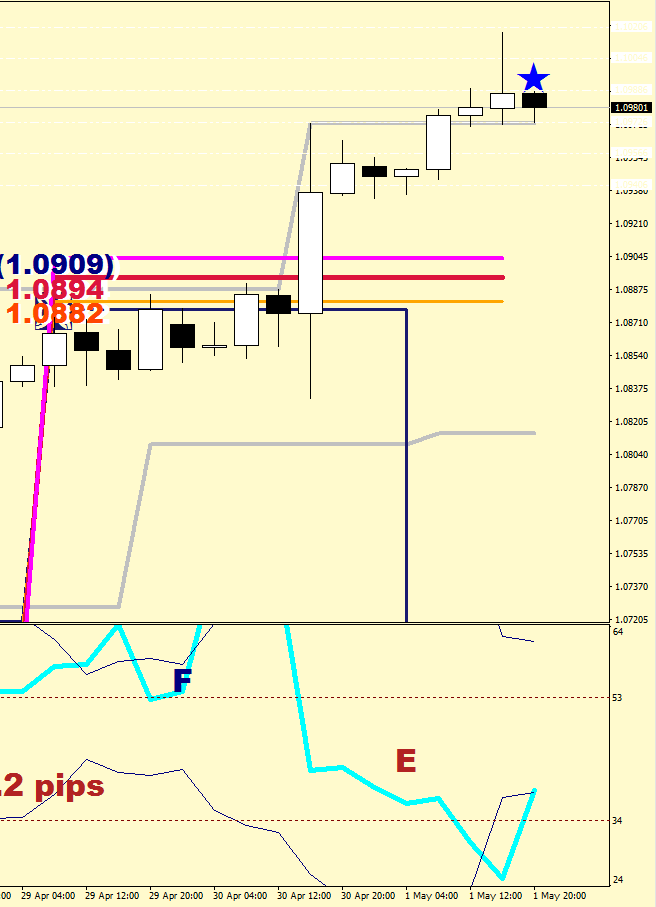
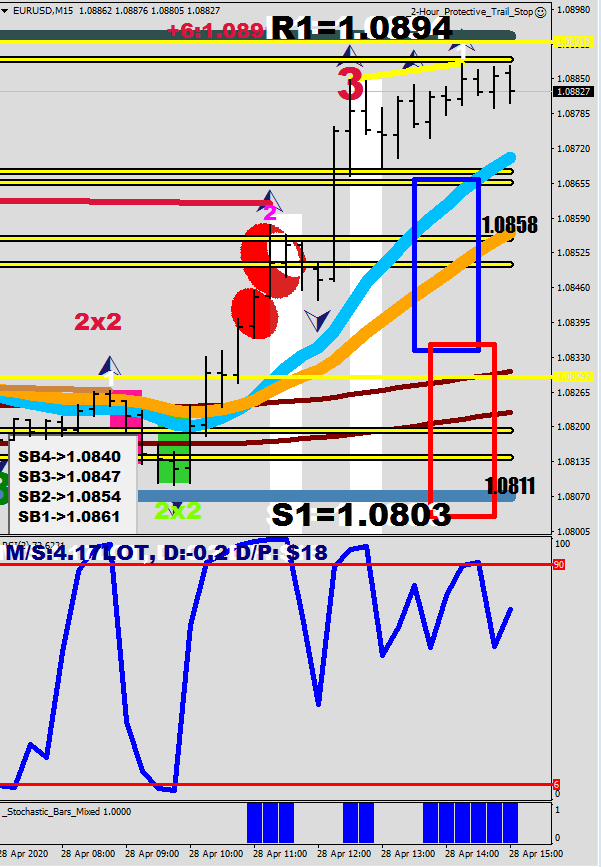
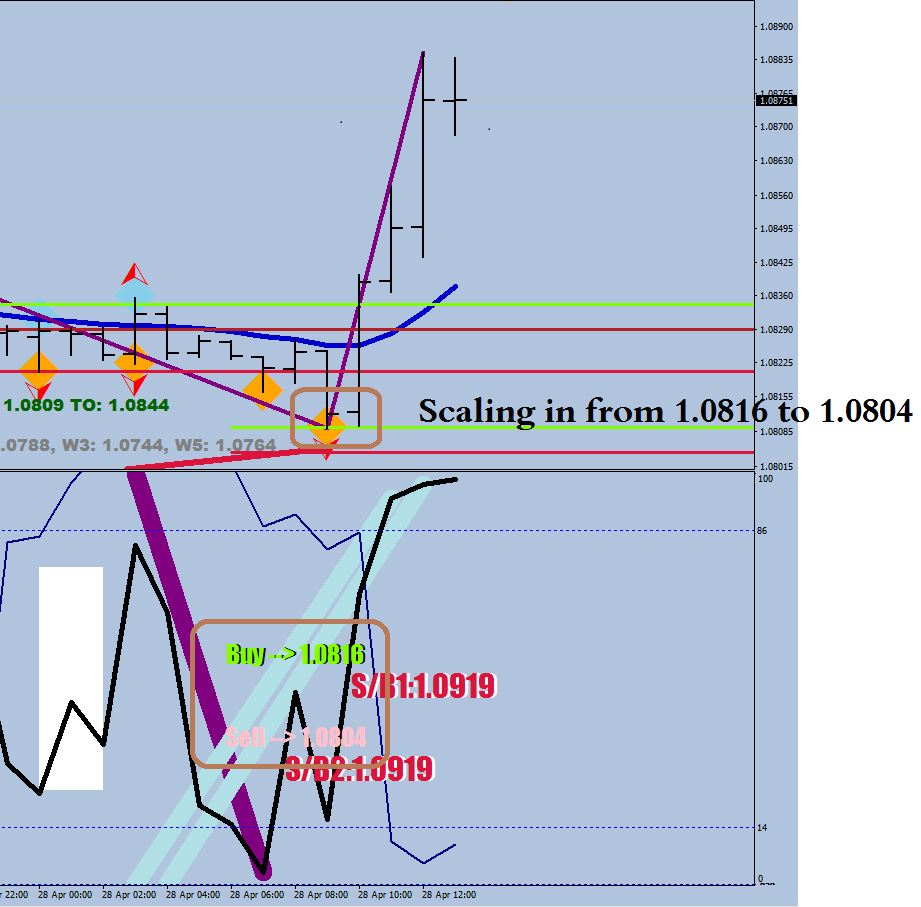
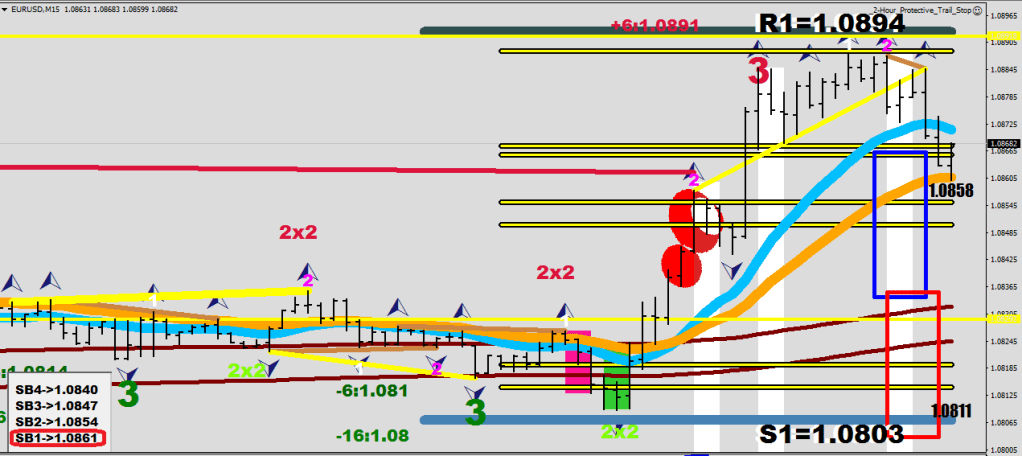
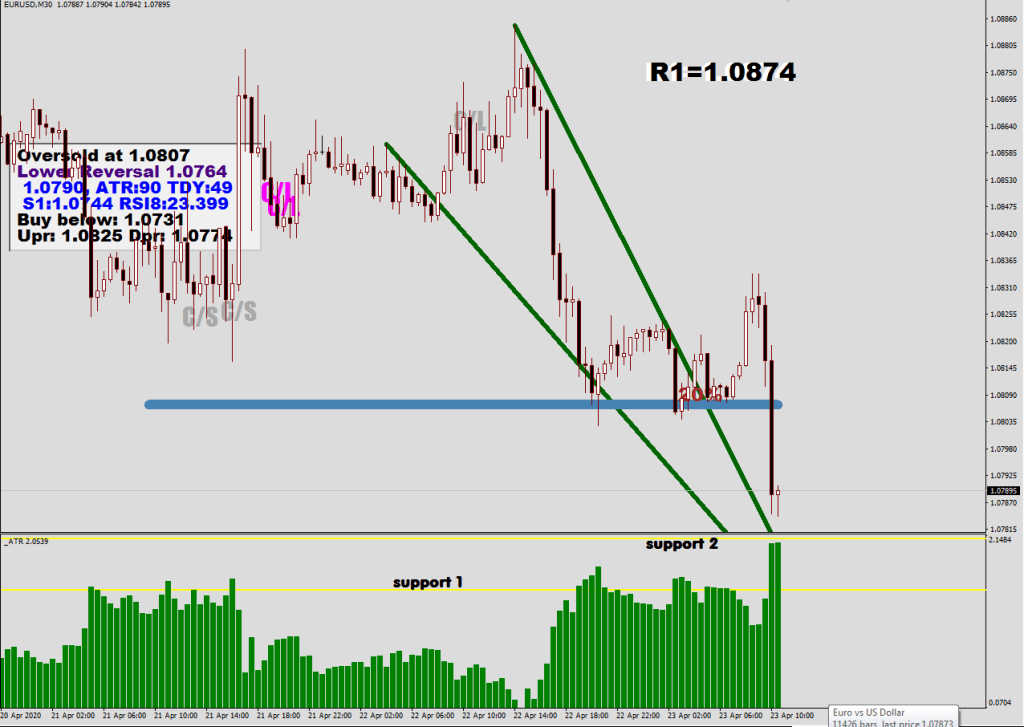
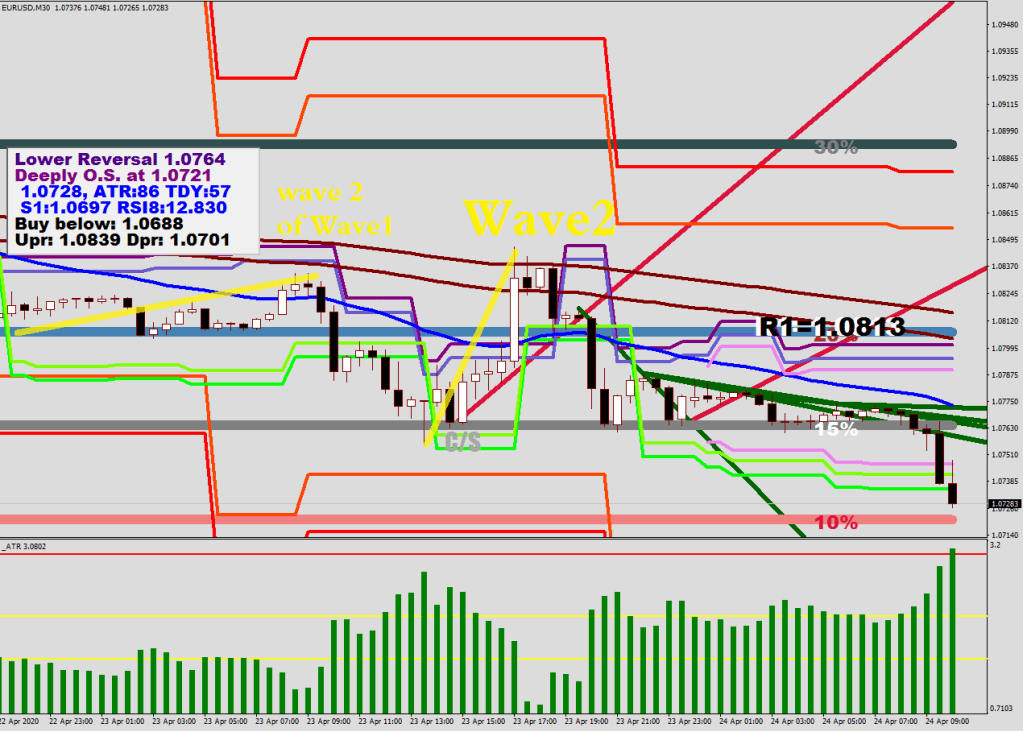
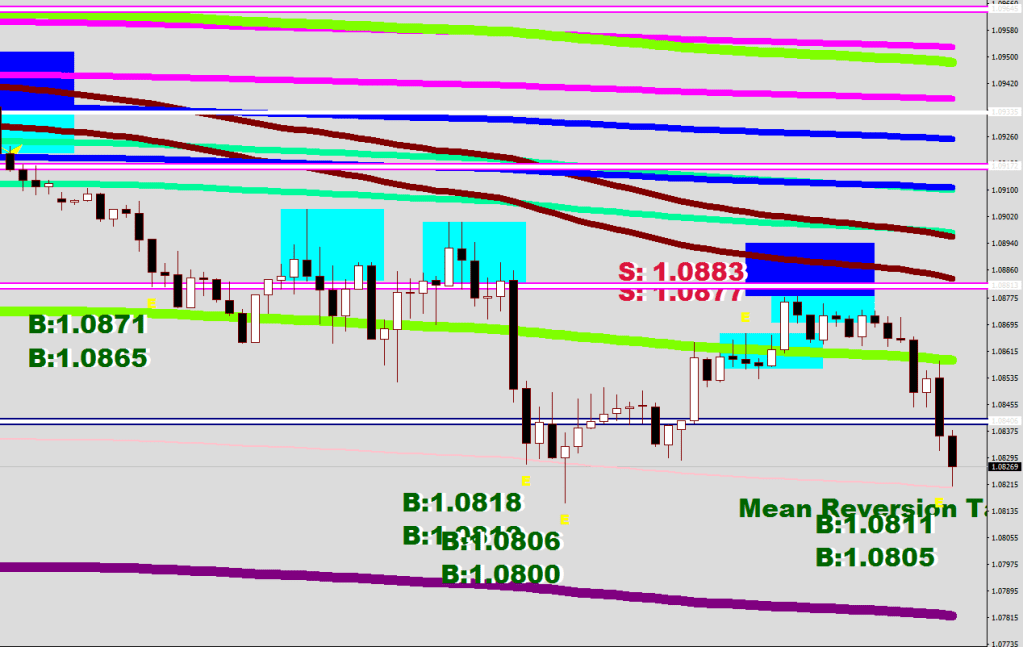
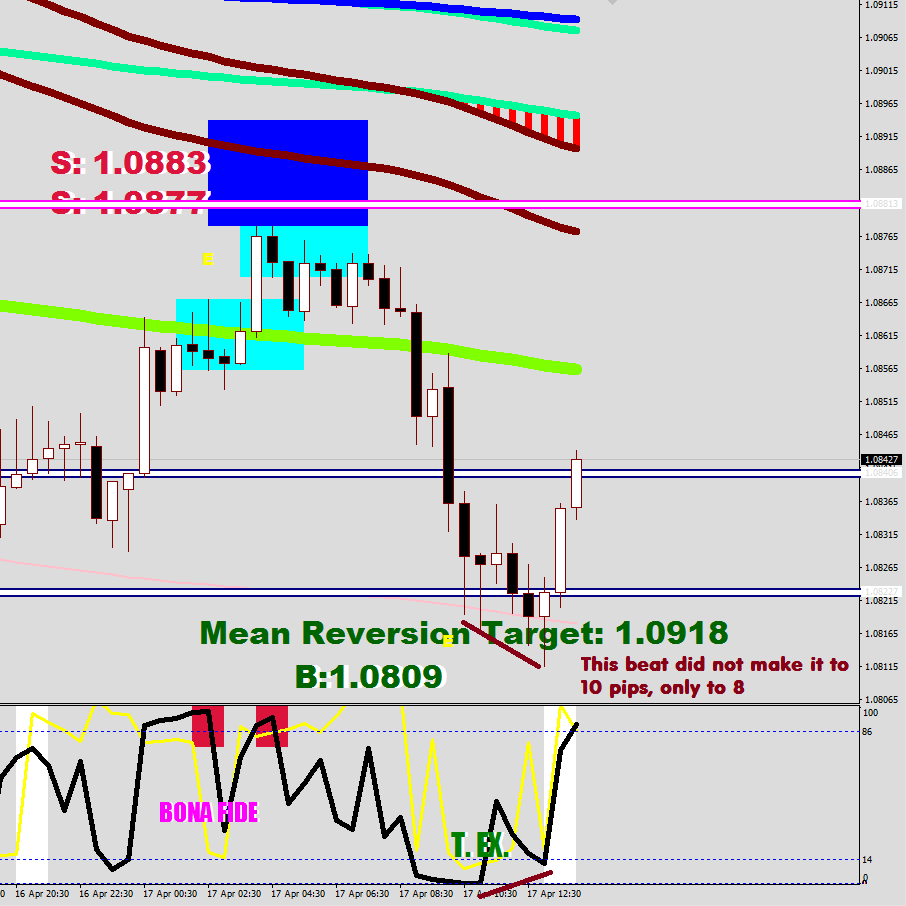
The bottom is very familiar again. A failure at the Cyan line is the Primary Entry with its target listed – and there is a the 3-bar volatility decline. The Secondary entry shows up as an RSI2 divergence (Yellow bulls eye) with its slight beat. The Secondary Target is 1.0909 or so.

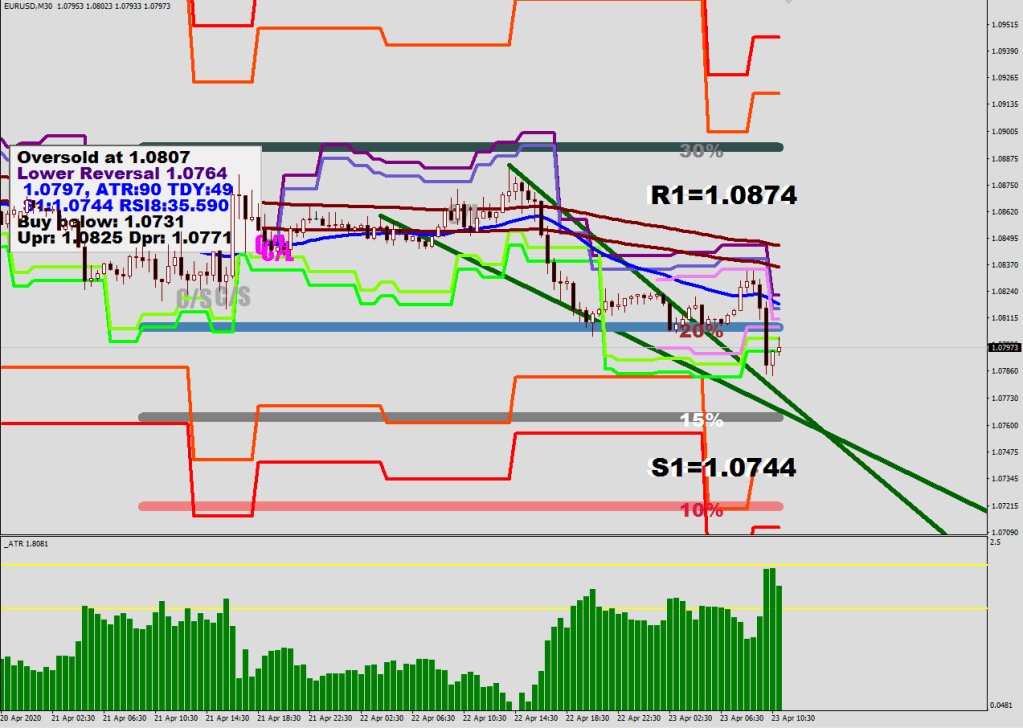
After the Green River gets crossed over, the pullback to the other side of Mr. Maroon (& the River) is a buy.

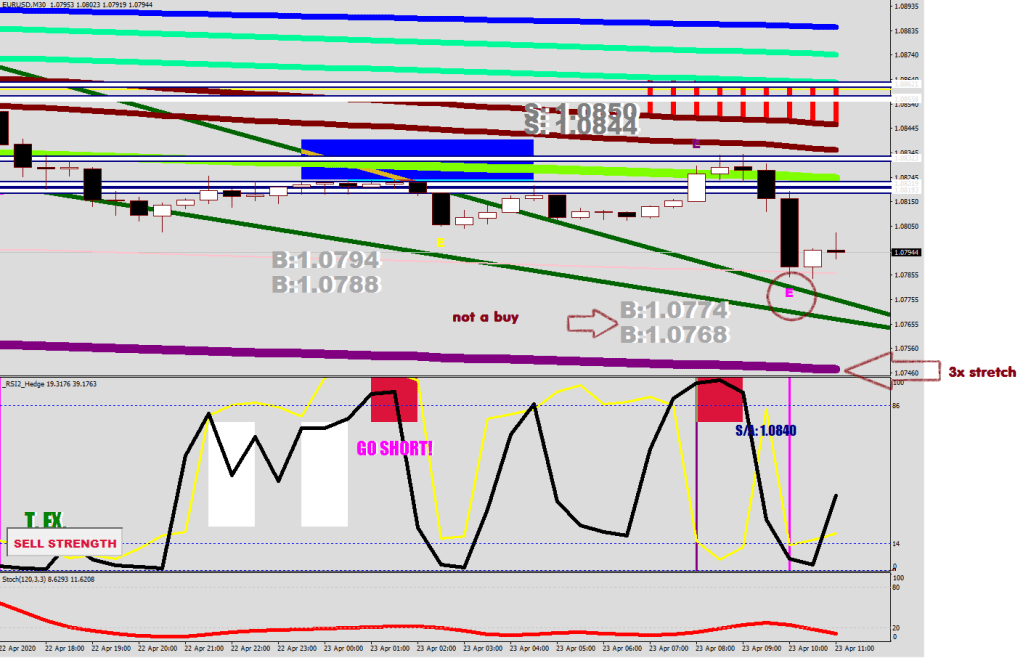
There is a problem this time: price failing to sustain above 1x stretch from the mean, although it tries 3 times. The bulls eye dot is the RSI2 divergence that the beat sets up, and this makes for the next continuation swing Lower High.
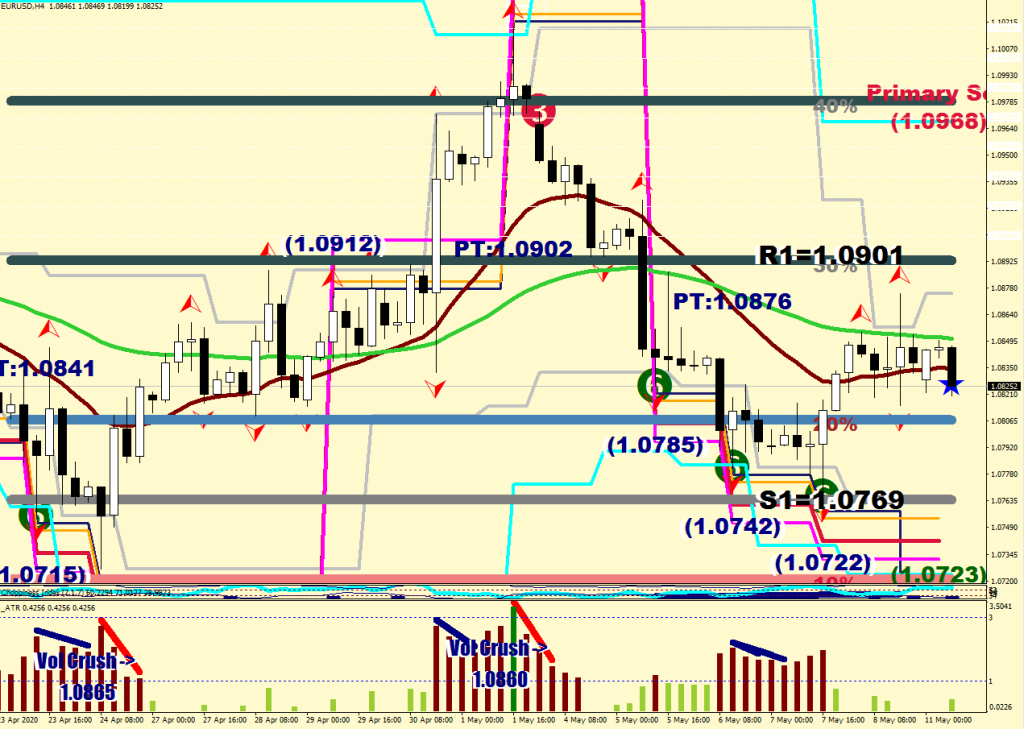
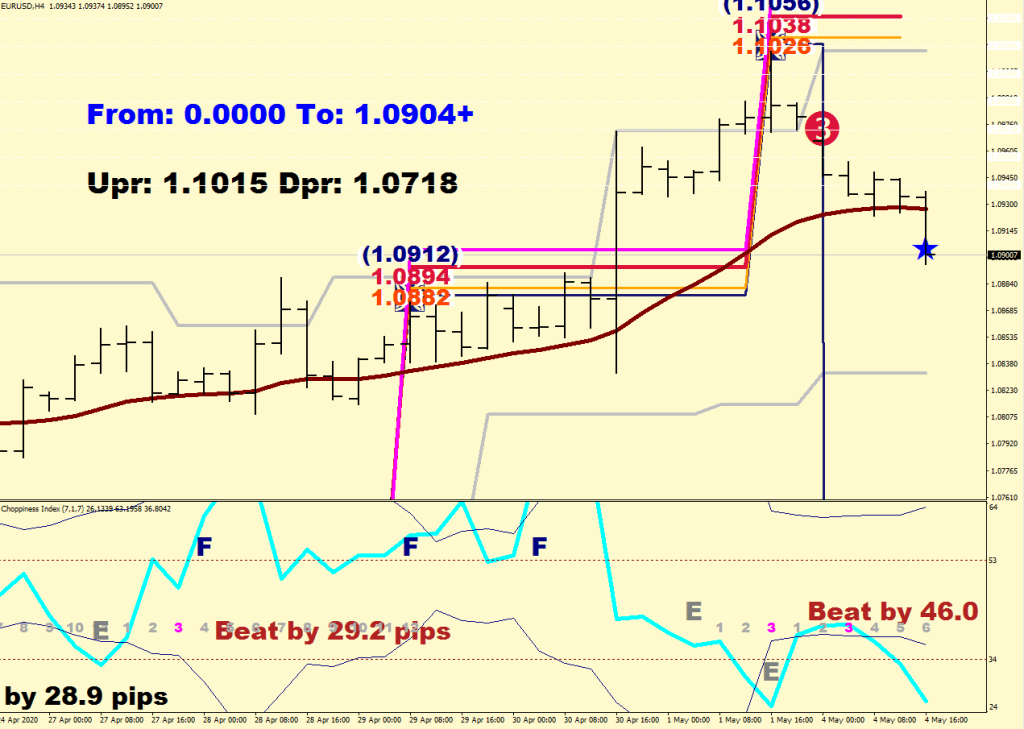
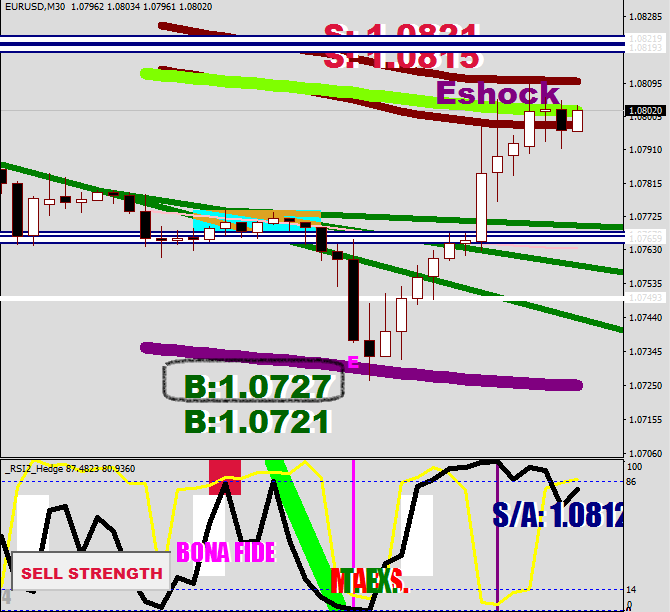
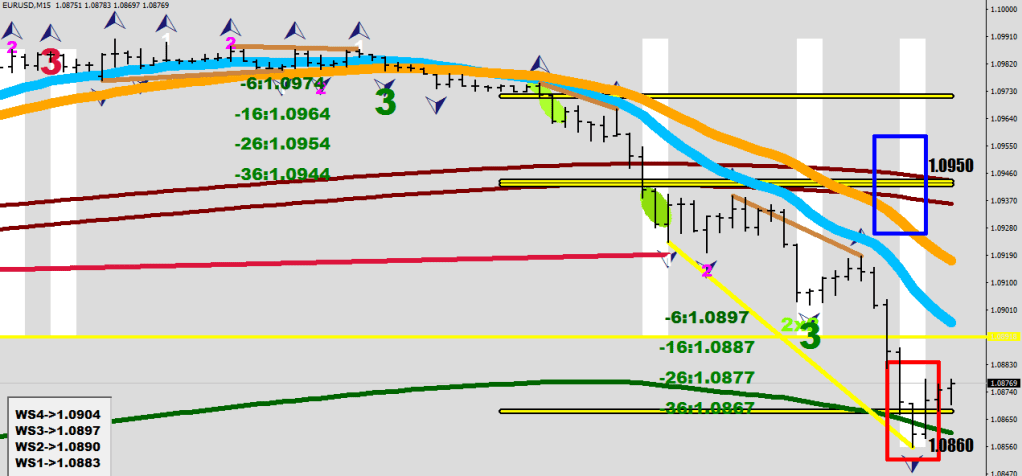
The Green River gets crossed over, there is no way back, a consolidation occurs at the other Bank.
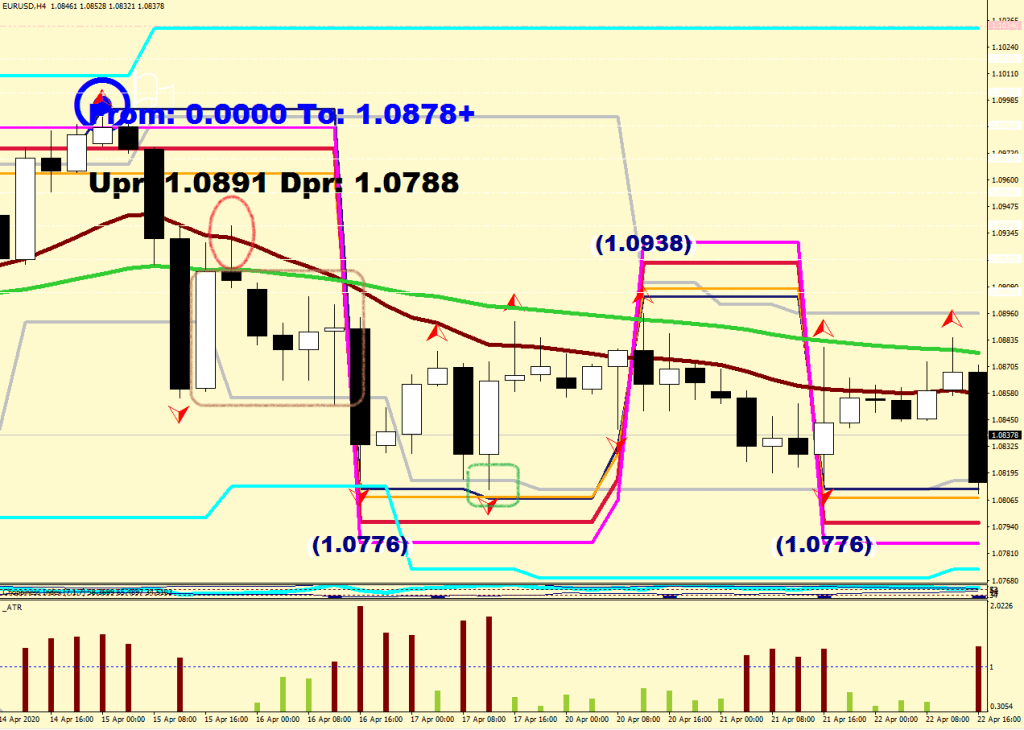
The Primary Buy signal gets missed by a few pips. A Secondary Buy emerges with the close range potential of touching the Green River. Counter direction has its limitations.
The other side of the Green River can be utilized for a continuation entry down for it is a lower high again.
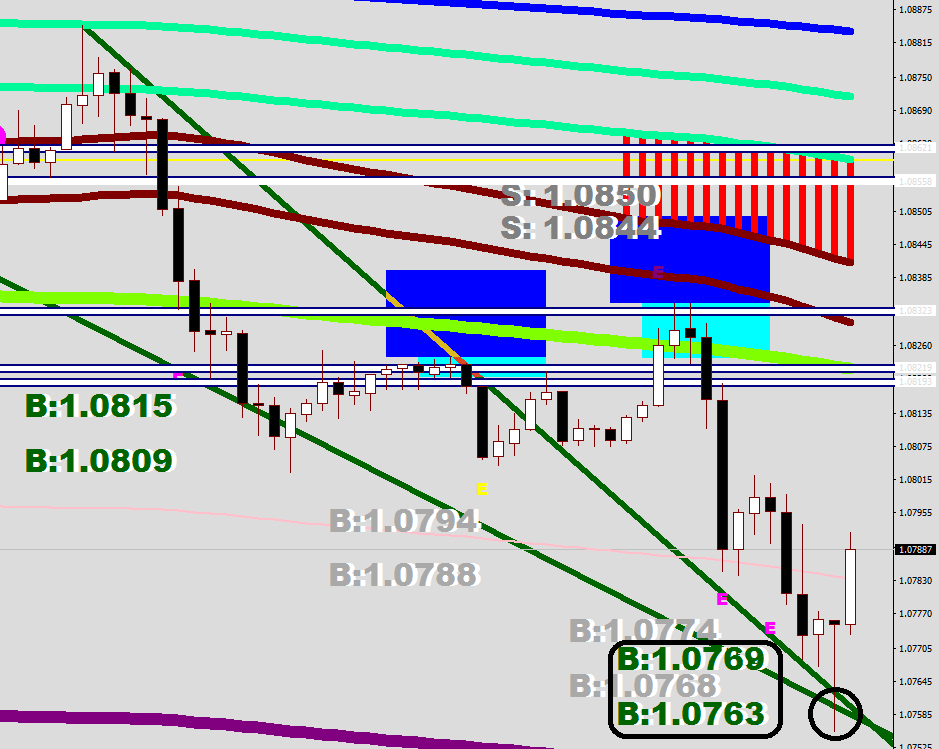
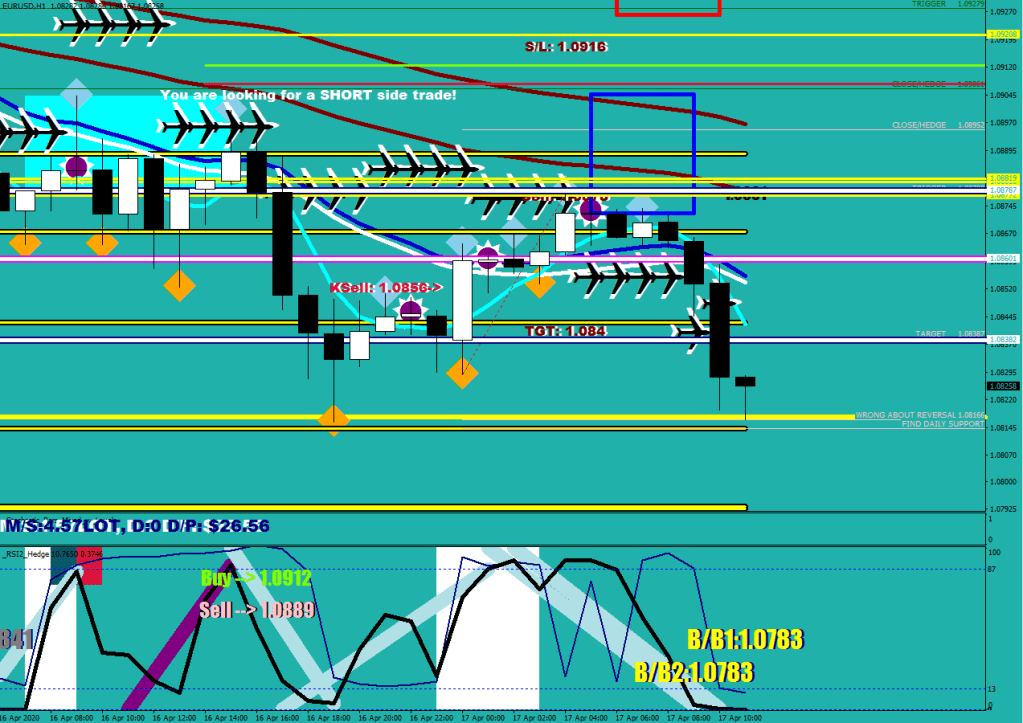
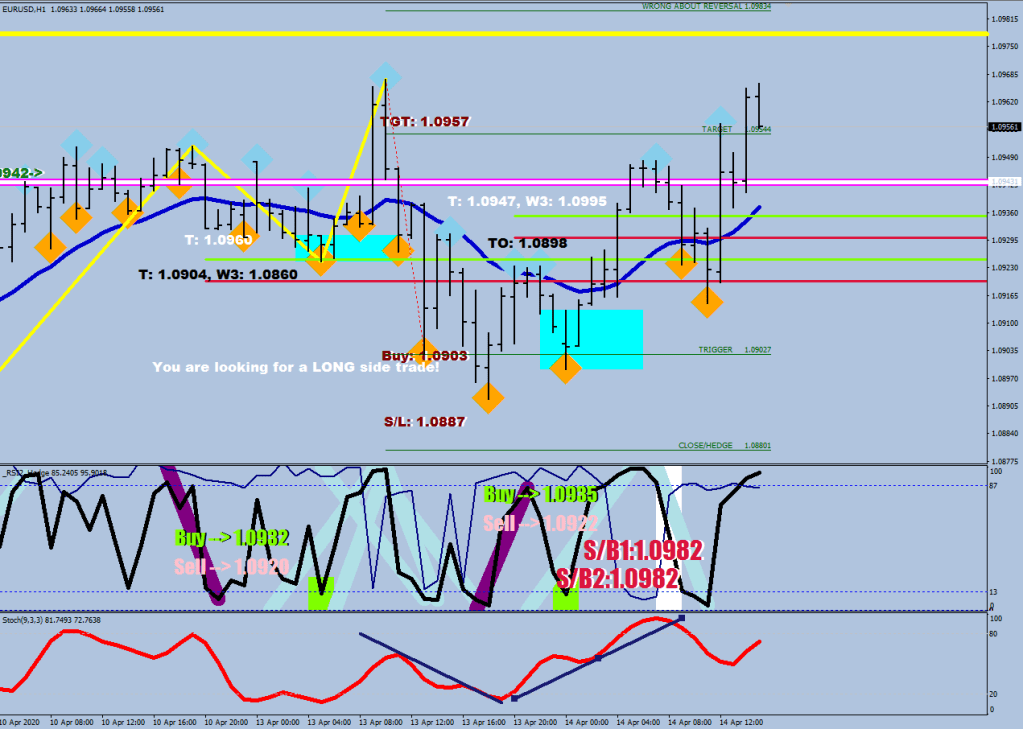
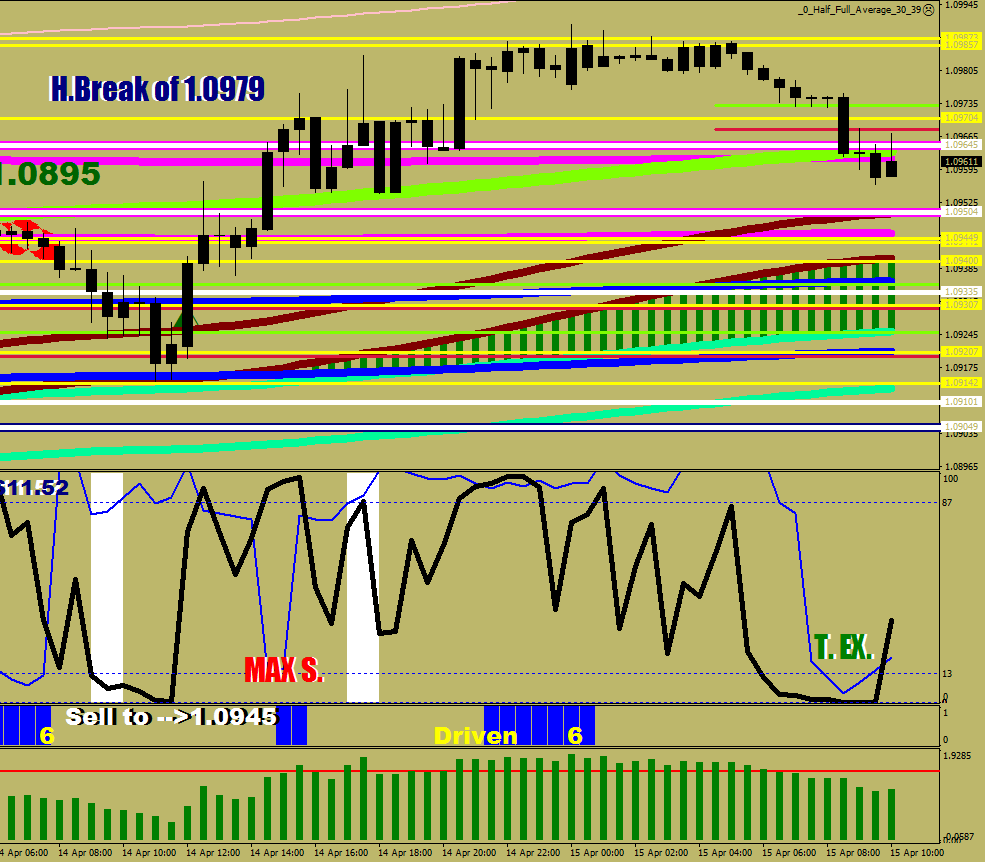
The familiar bottom again. Cyan violation = Primary Buy, re-visit / undercut (this time by 25 pips) is the Secondary Buy.

On the way up the Green River gets crossed over and the buying at the other Side of Mr. Maroon / Green River persists.
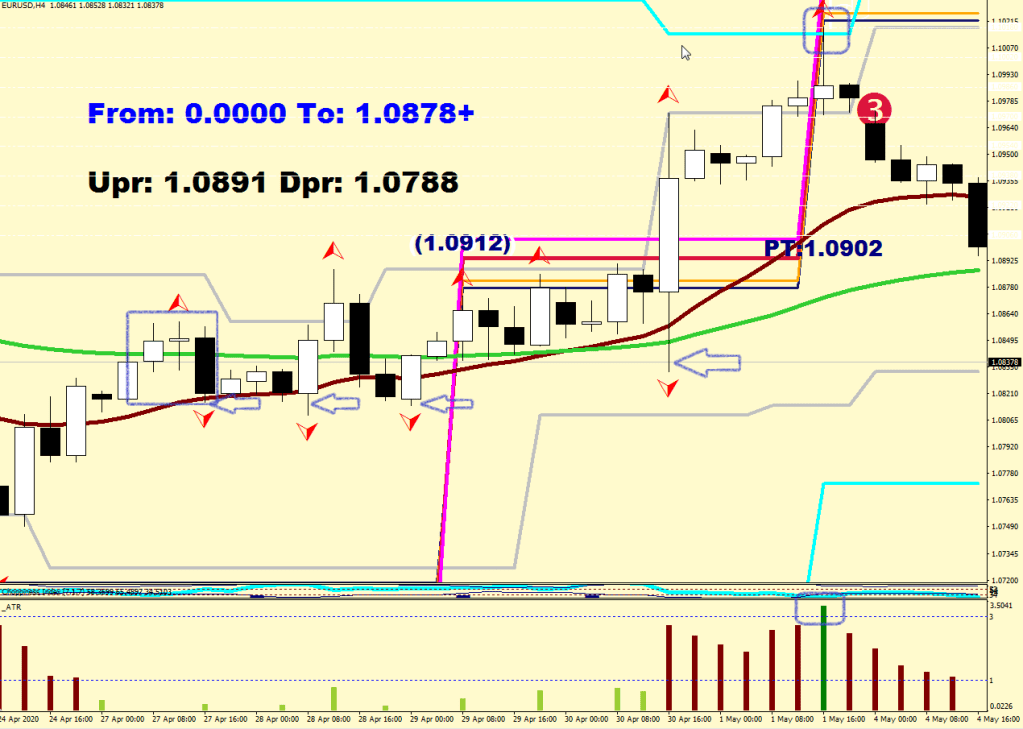
A Primary Sell sets up with the Cyan violation at a healthy 3x stretch from the mean. Target prints. The is no Secondary sell opportunity granted with the gap down over the weekend.

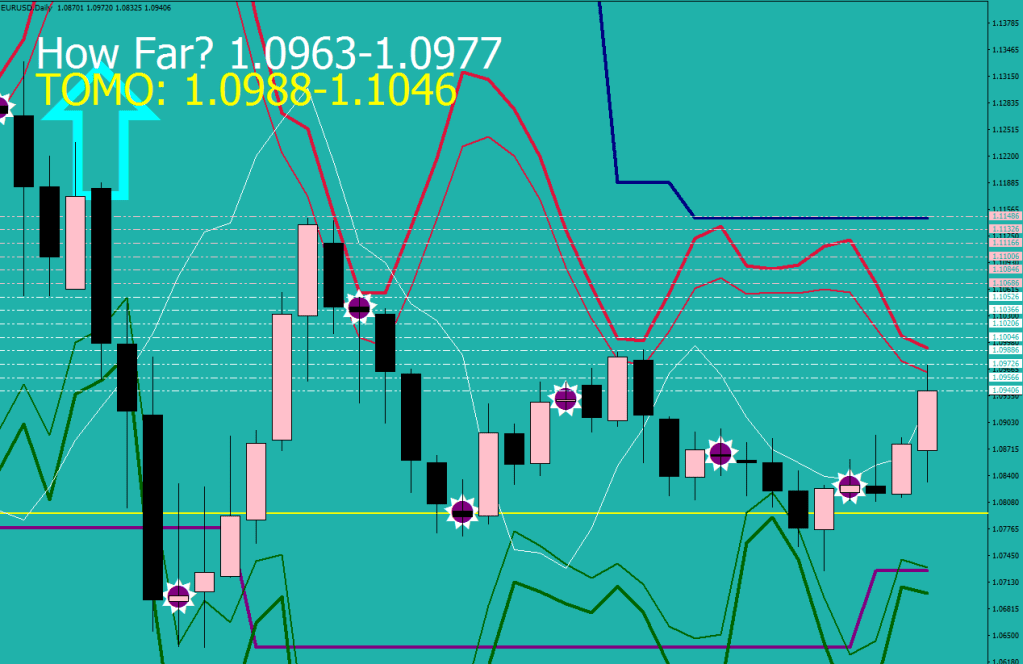
The Green River was crossed down. A consolidation took place below with an additional rejection. The Primary and Secondary buys both got their exits filled.
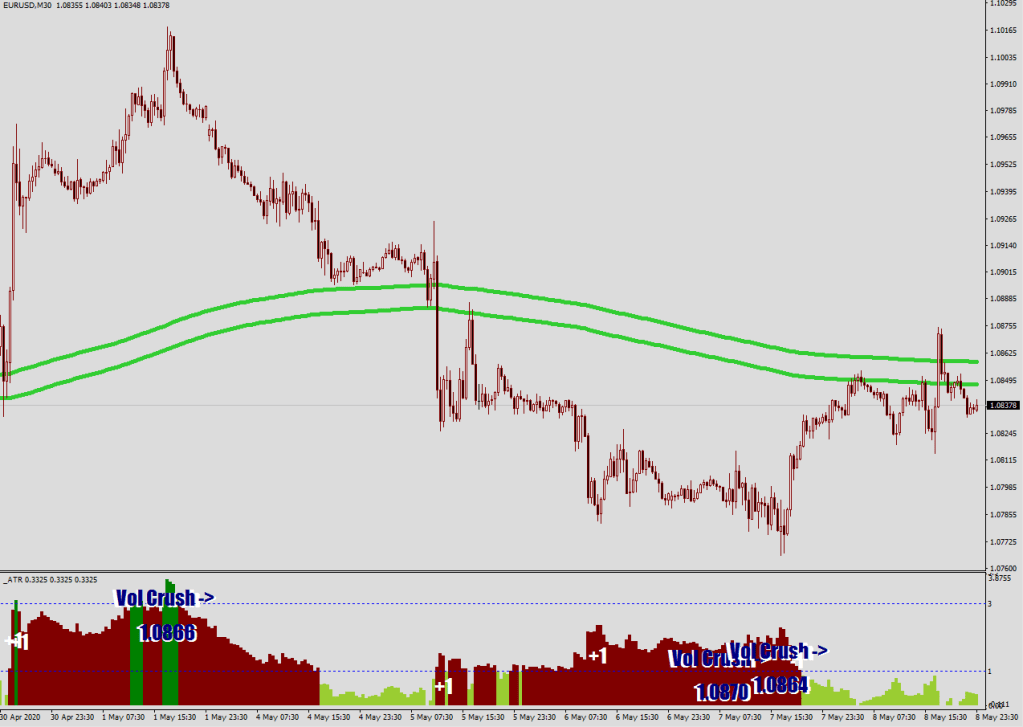
Price from here can go both ways, there is no Edge here, the last move was up, but price did not cross over the Green River yet. It would be easier to consolidate below the river, maybe even fail it again, but this could be all waived by a gap up and stay or a quick move up and a consolidation on the other side.

Although I can’t give you a call here, at least now you have something appropriate in your head about how the market really operates.
…