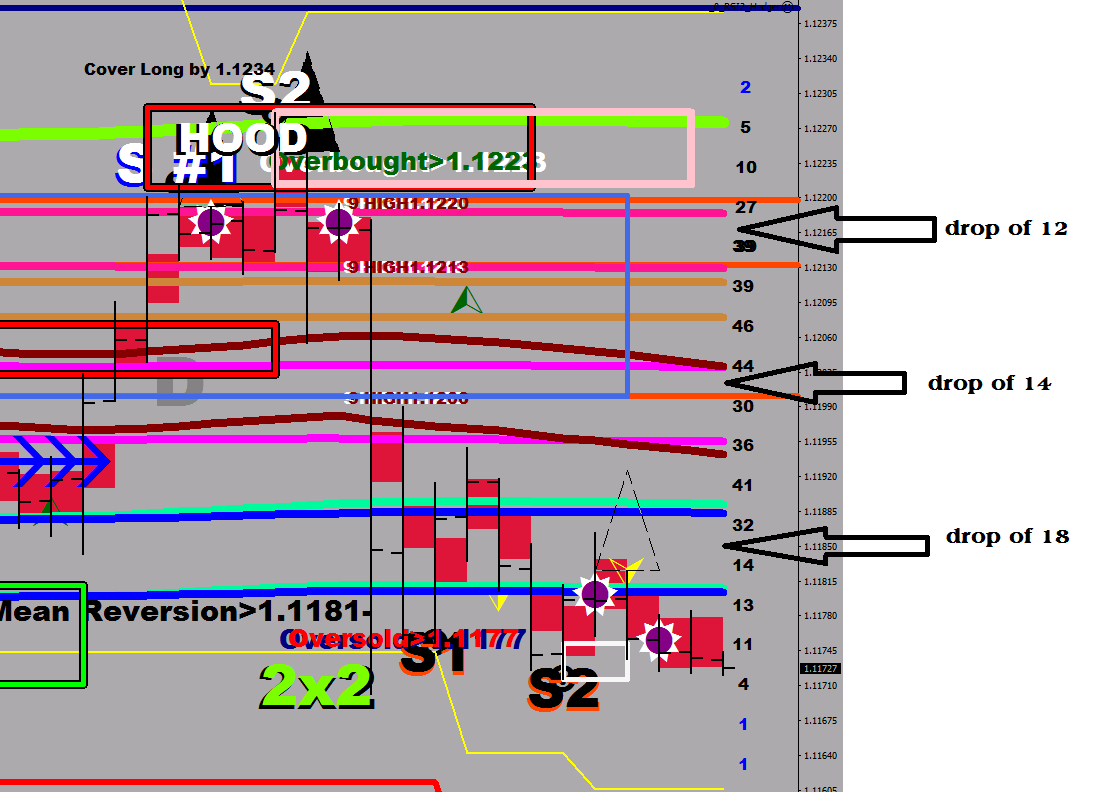
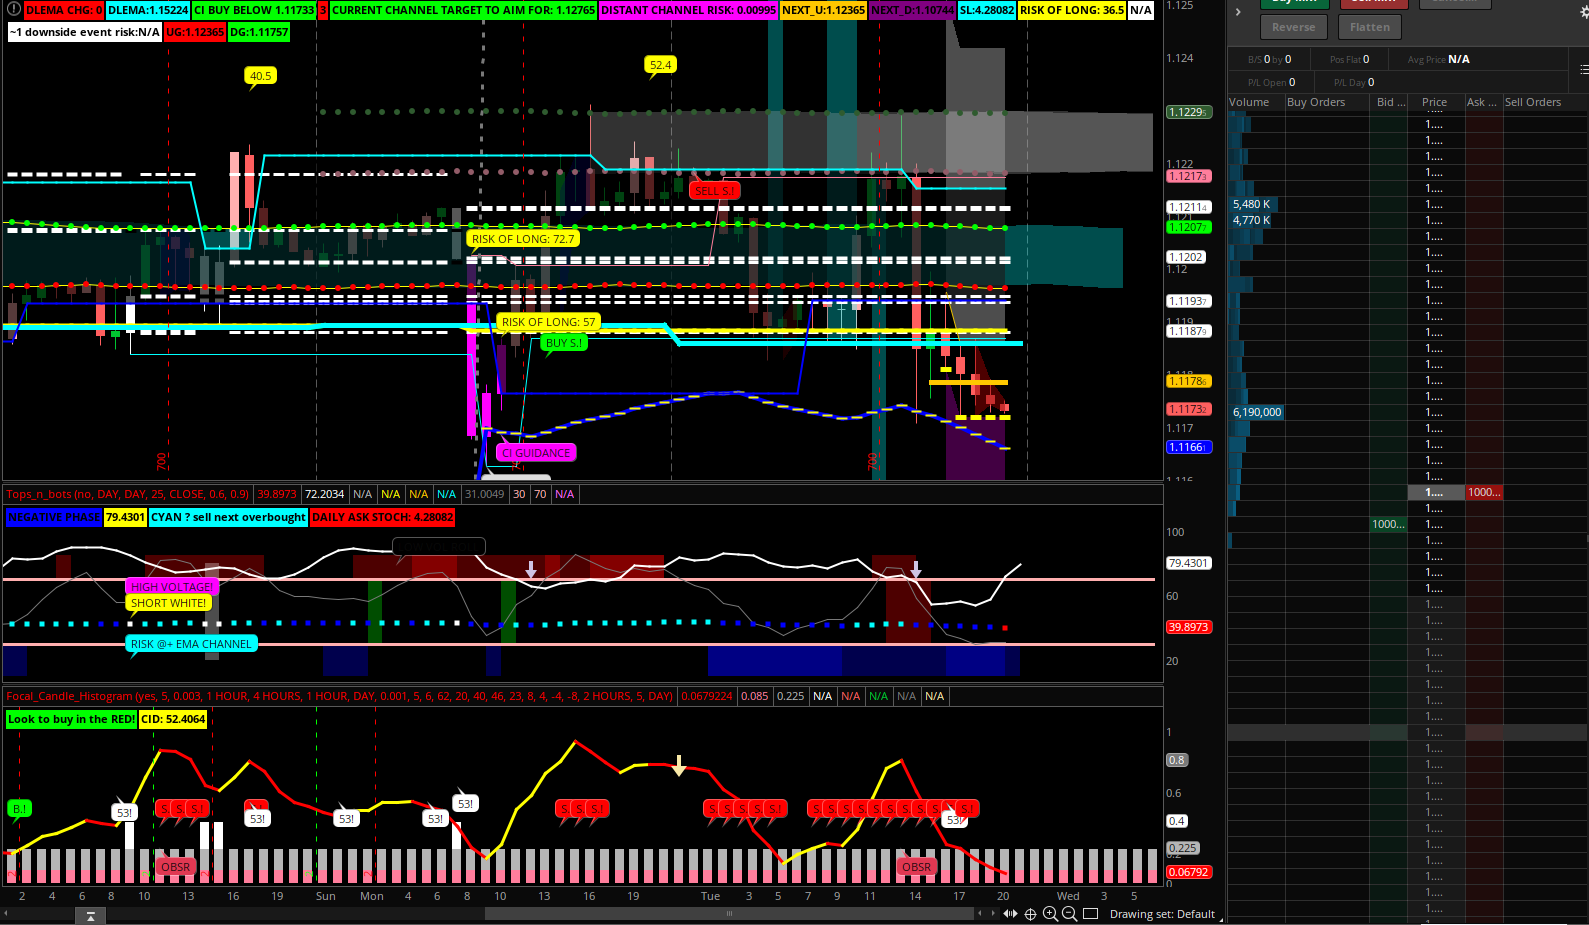
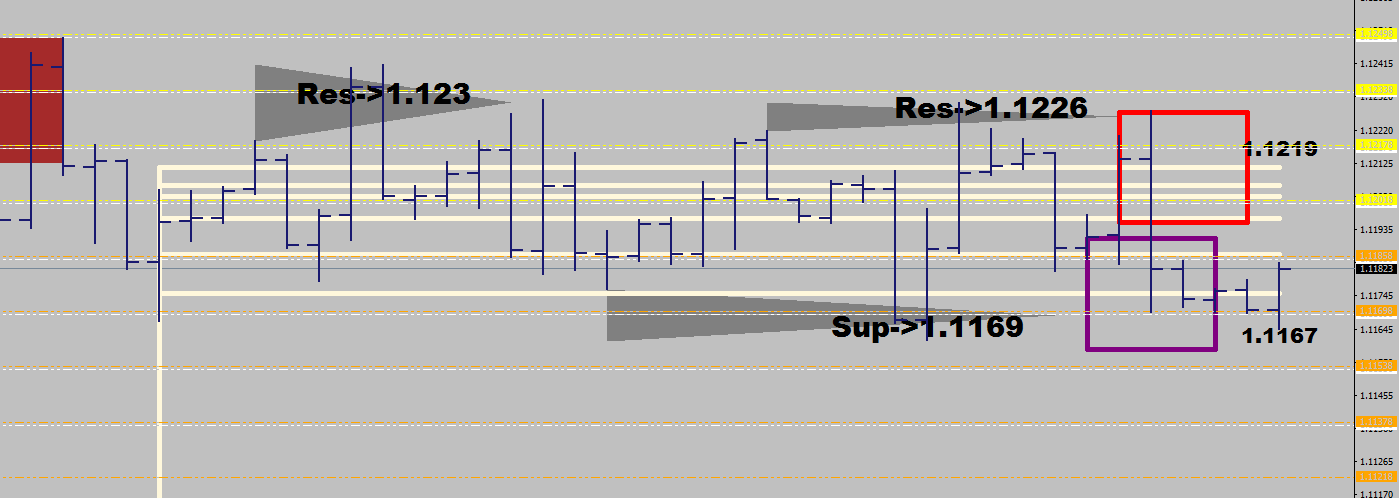
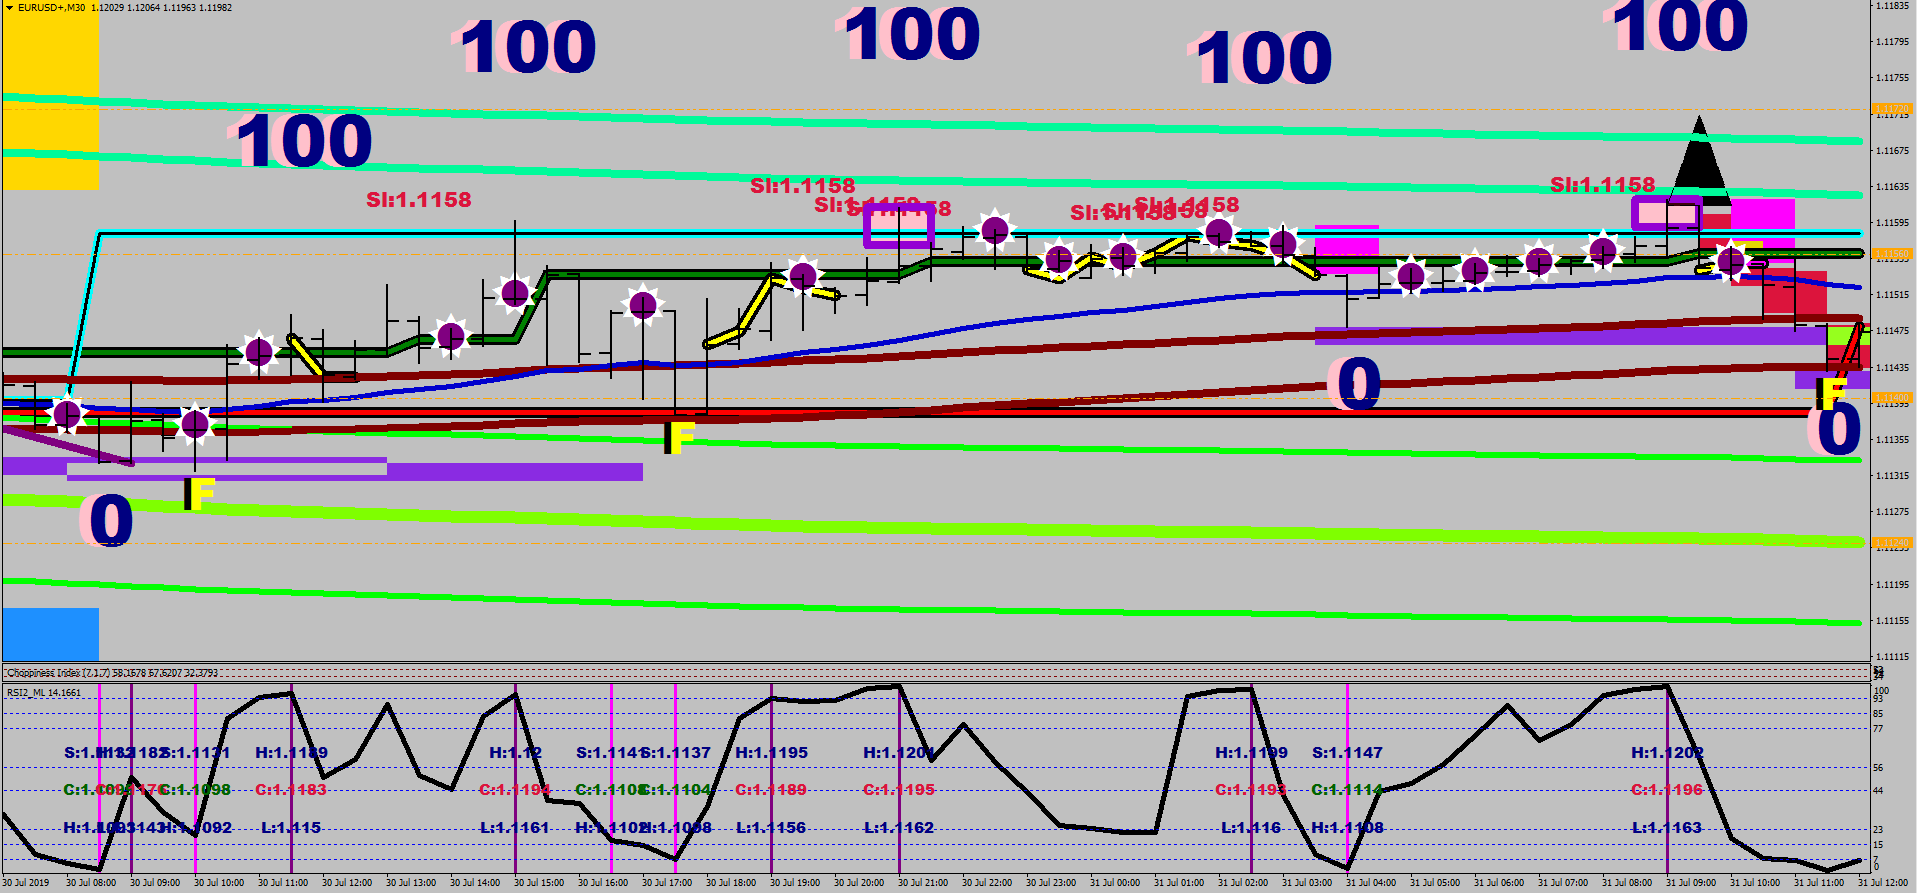
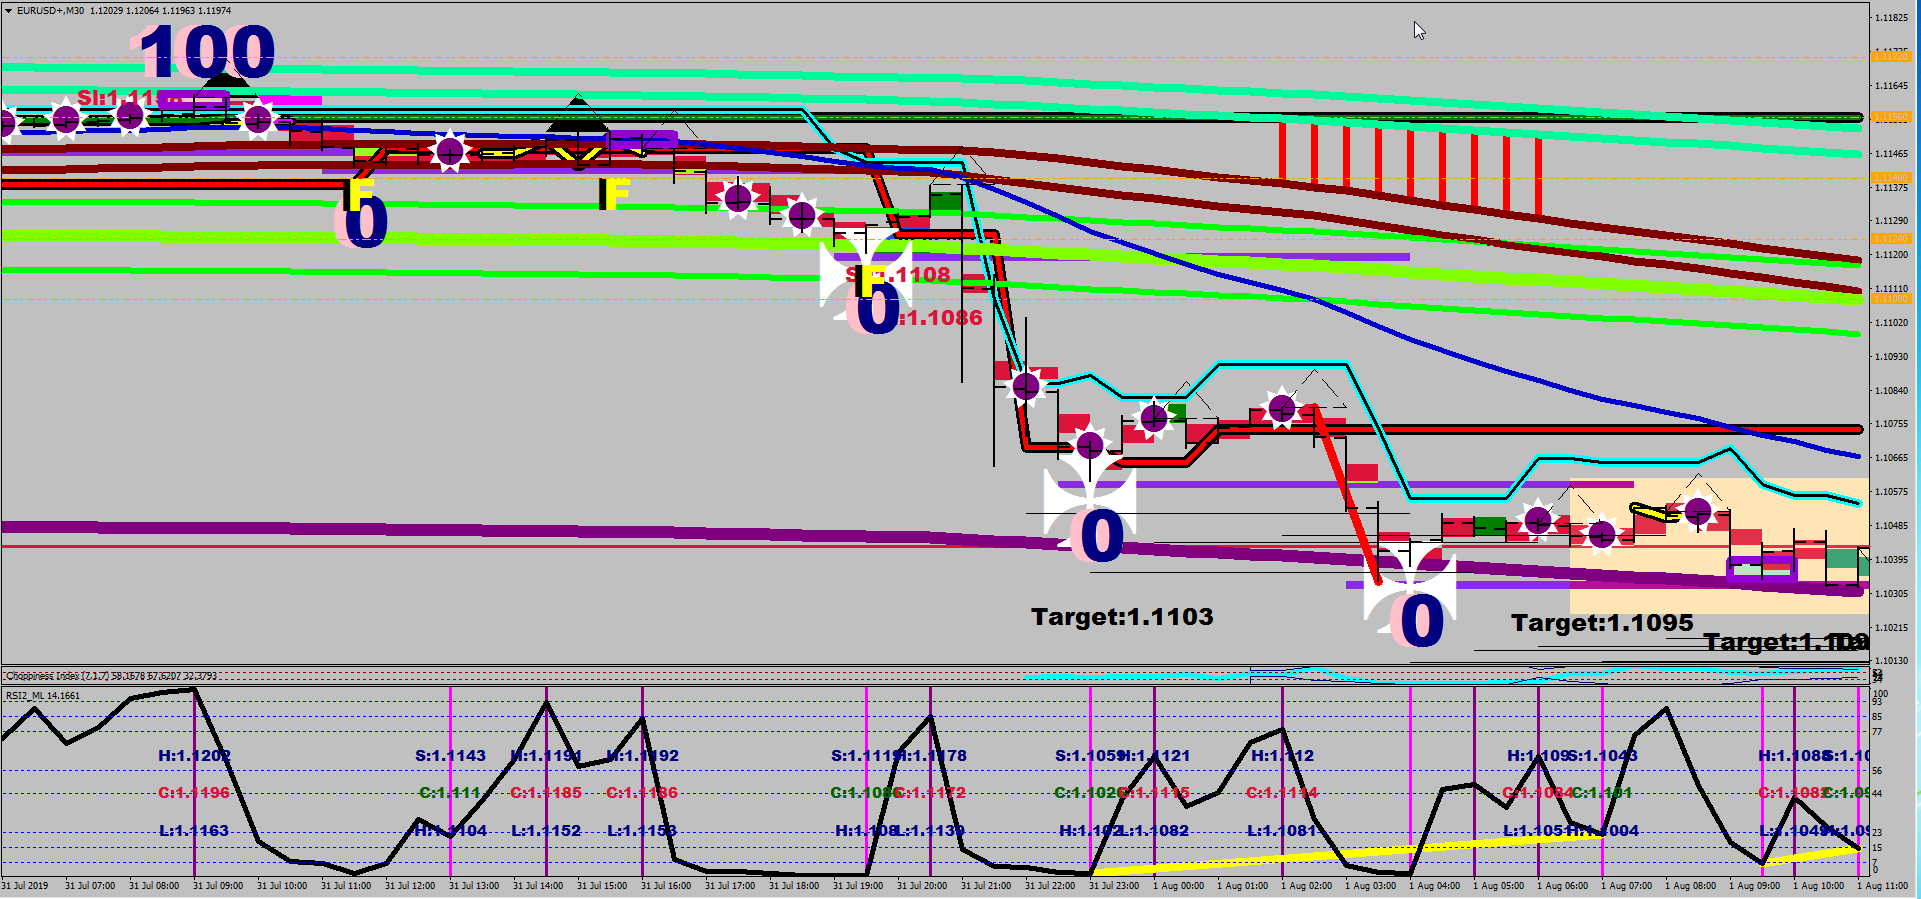
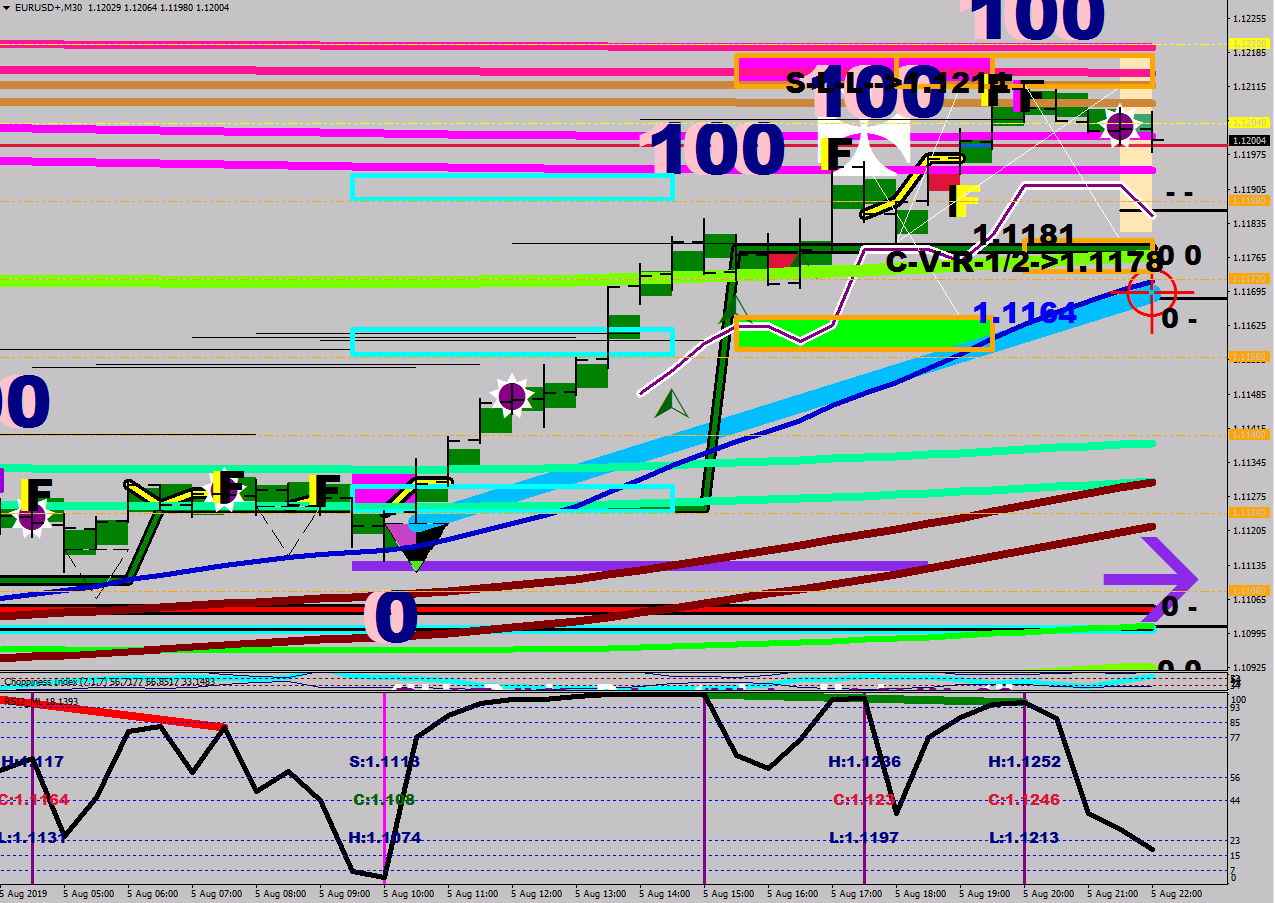
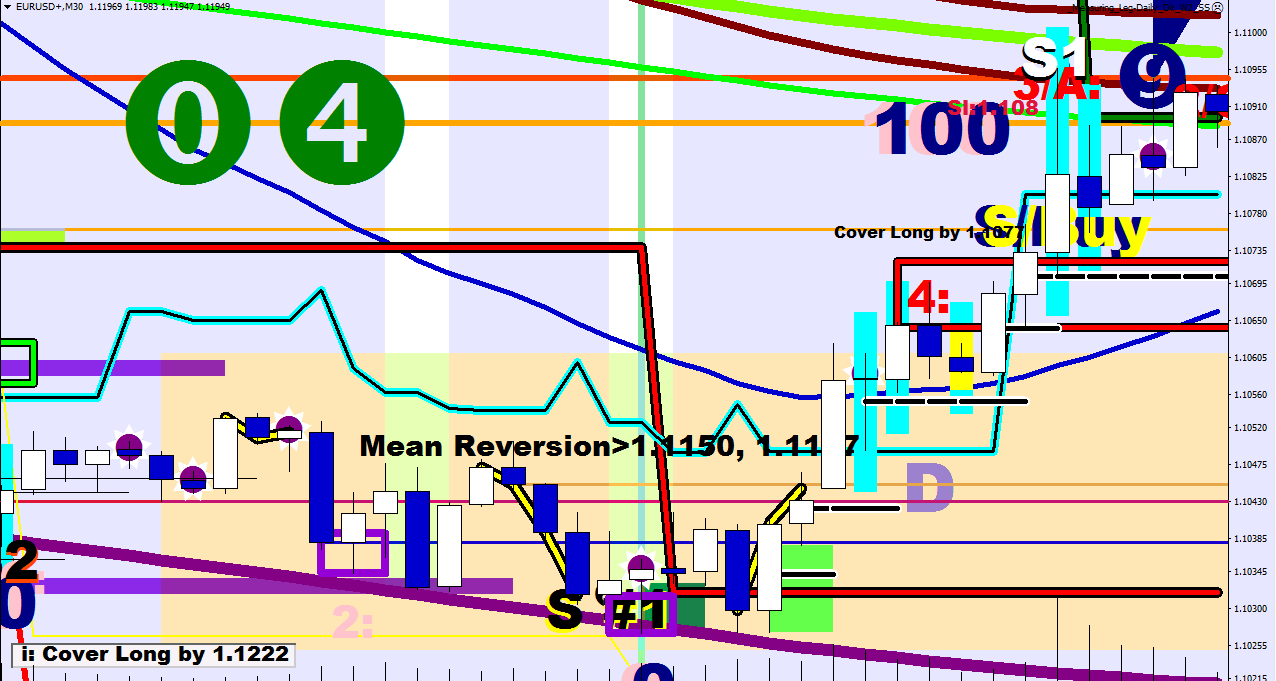
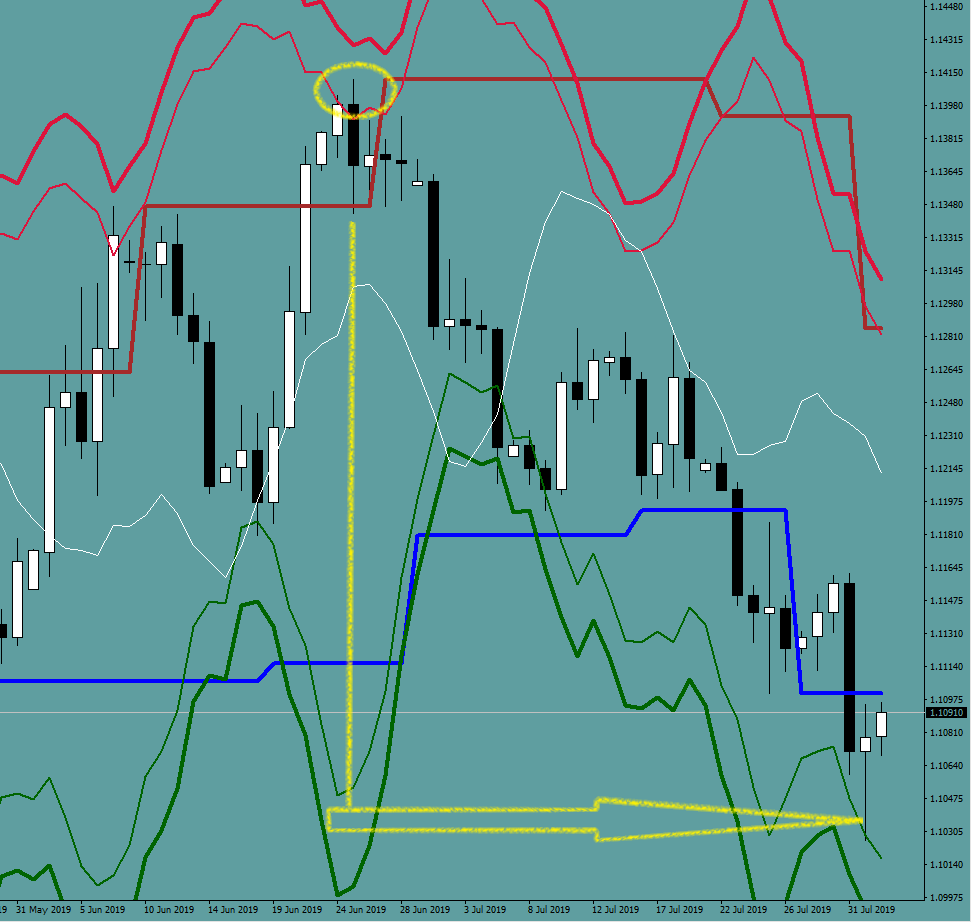
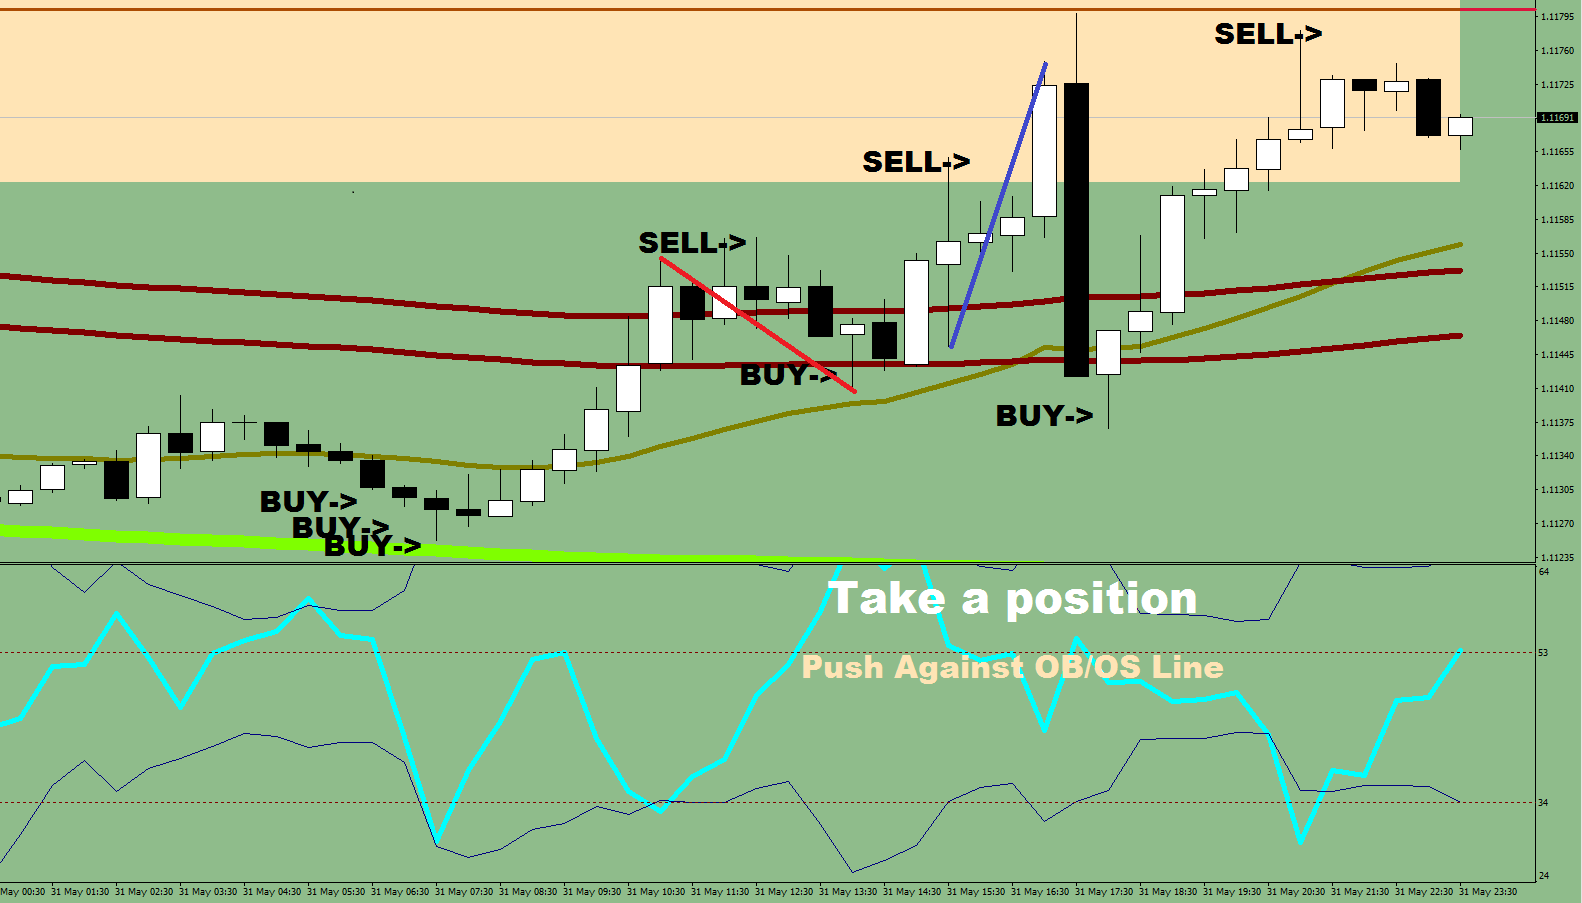
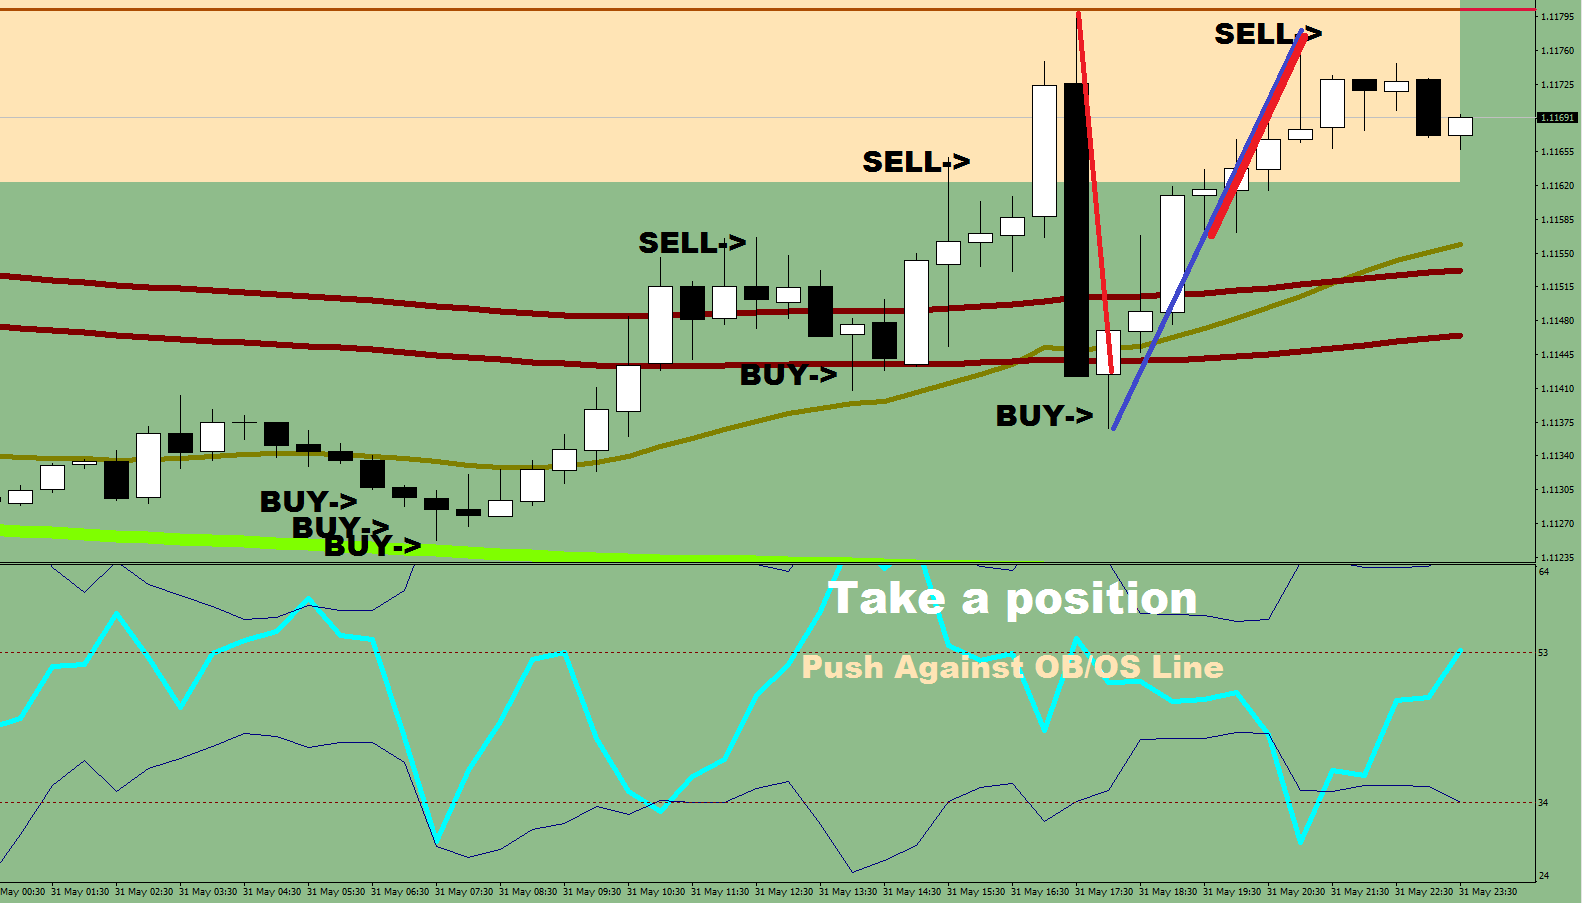
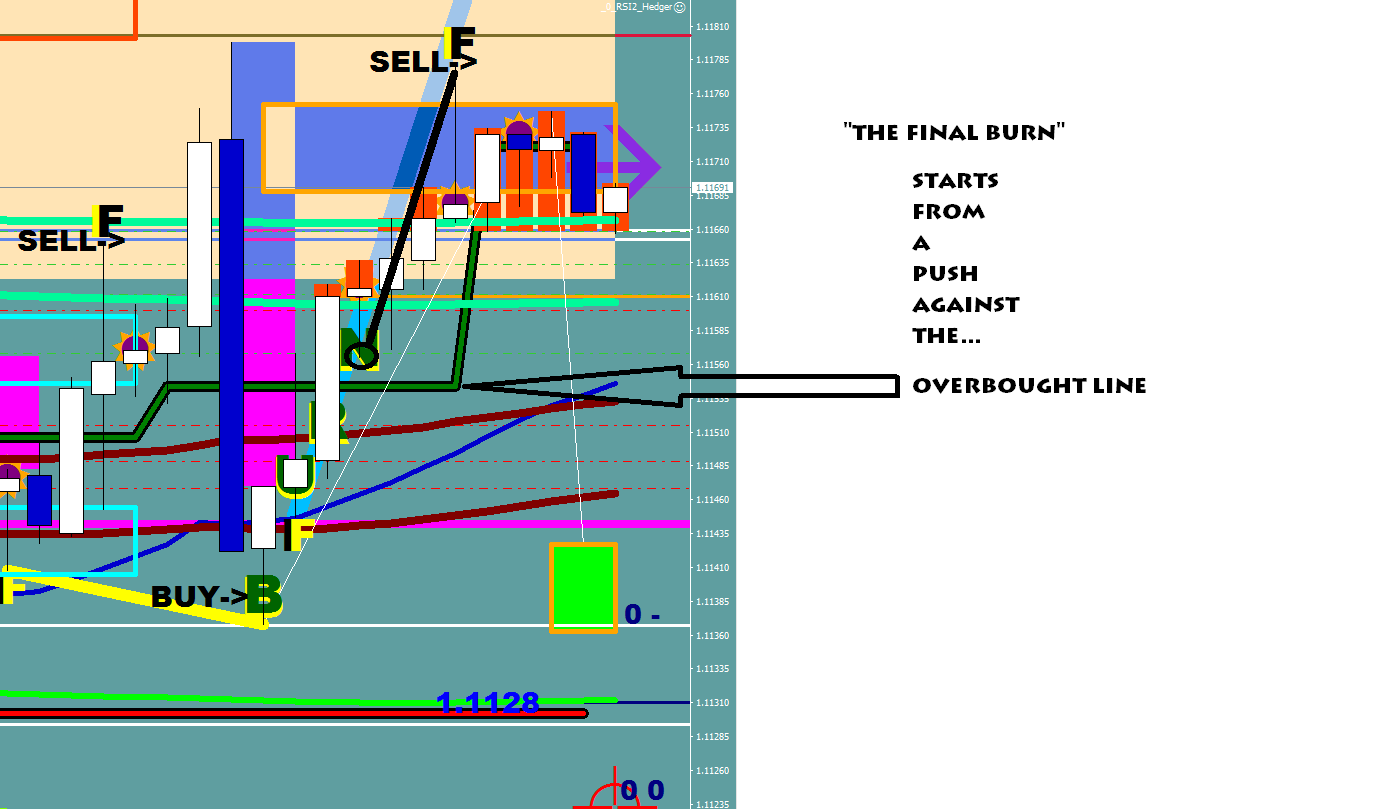
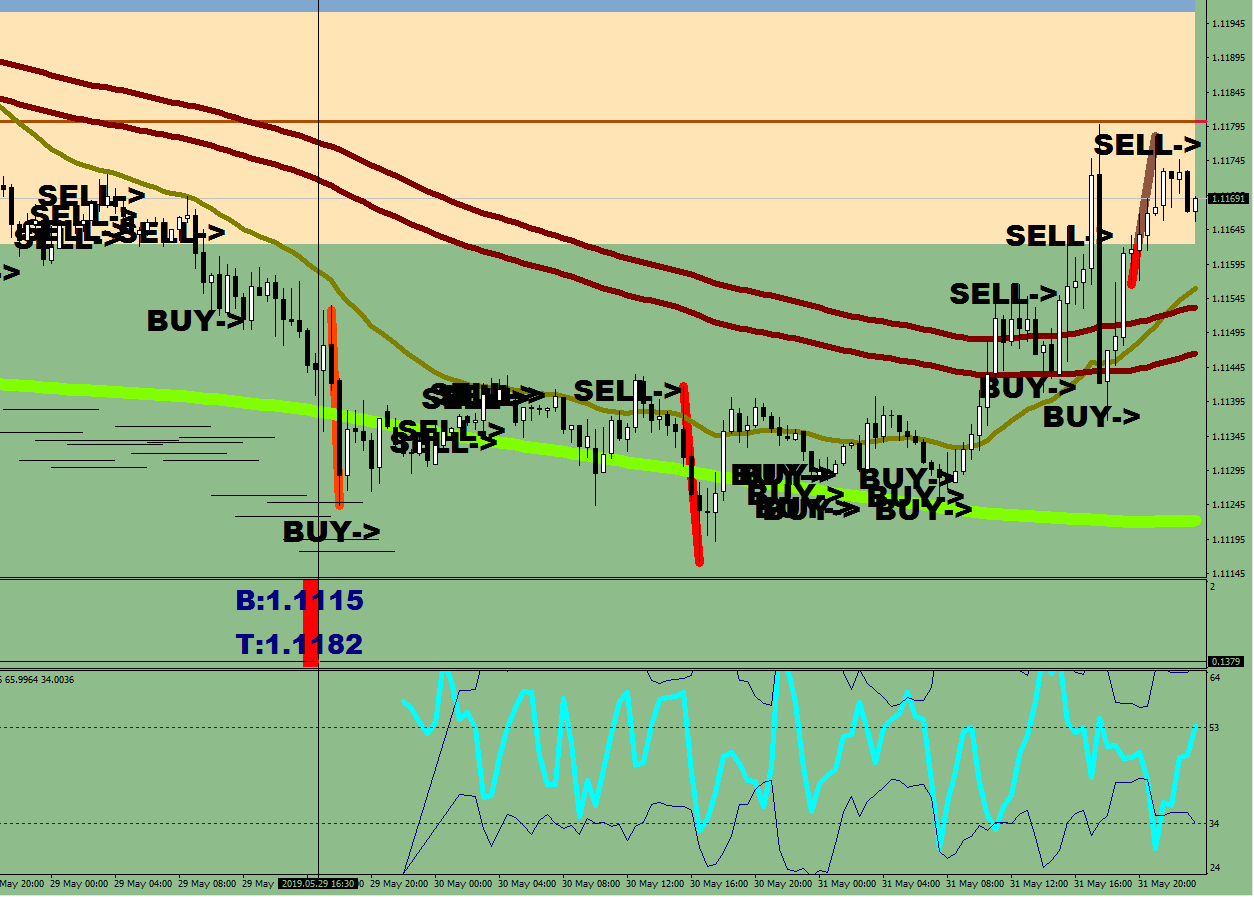
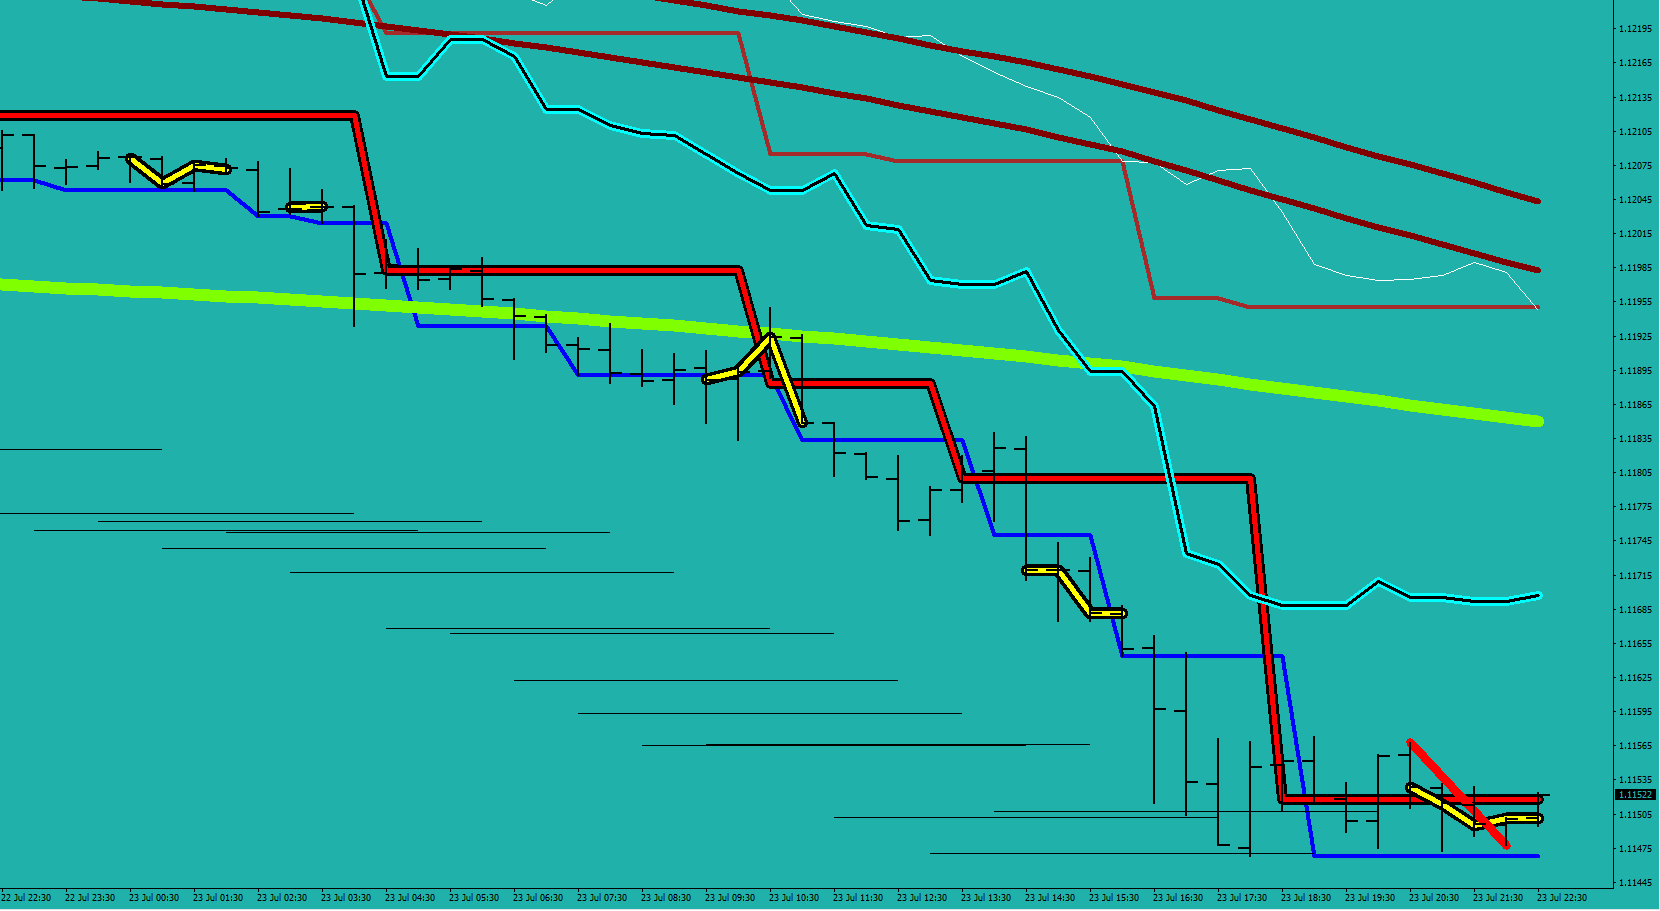
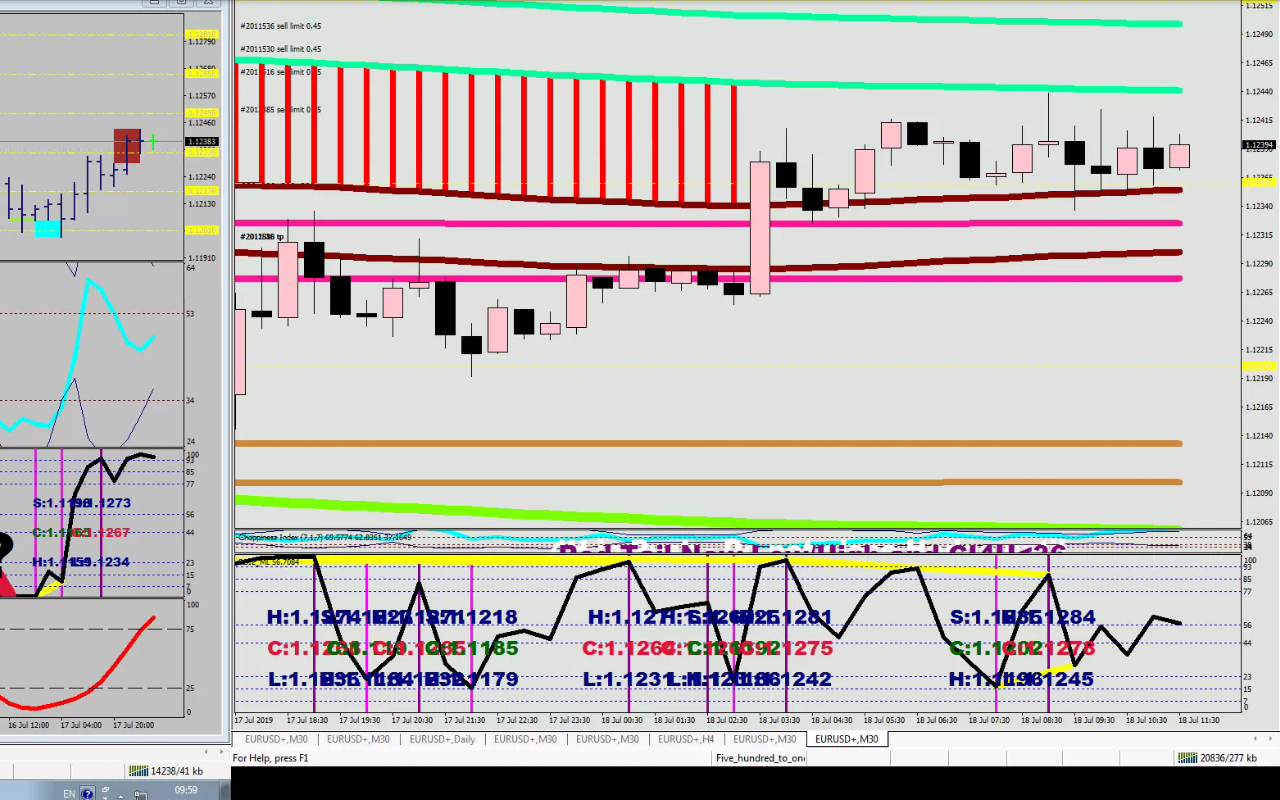
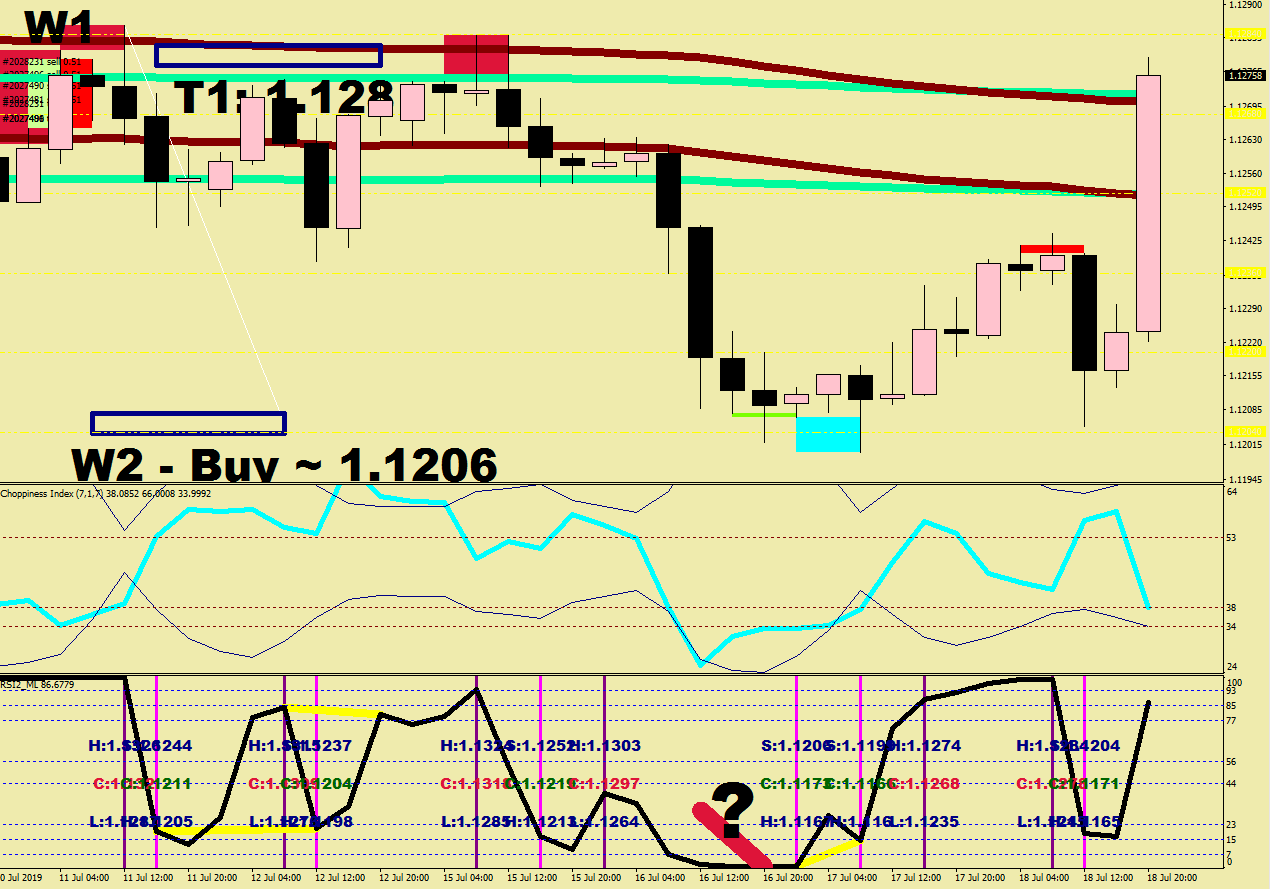
Market profile is one tool that can point out possible areas of a stall / reaction that may ultimately result in a reversal.
Number of 30-minute blocks spent at a given price level. Price usually skids a bit further.
The order flow isn’t visible for forex traders in general, this is something to have to qualify for, and is called Level 2 – the typical use is Futures trading.
You can imagine the “at ladder screen” showing the number of contracts requested / offered at the given level.
Although most larger firms go out of their ways to hide the volume they are trying to accumulate without unintentionally triggering a reversal, there are others with different intentions: they are trying to spoof the market into a reversal by placing an outrageous sized pending order – that they usually pull at the last second – what can you lose, the broker would only give you a partial fill at the maximum size your account can afford, as a worst case scenario.
Your anticipation therefore should be an educated guess of the level where a likely change in behaviour / order flow can happen.
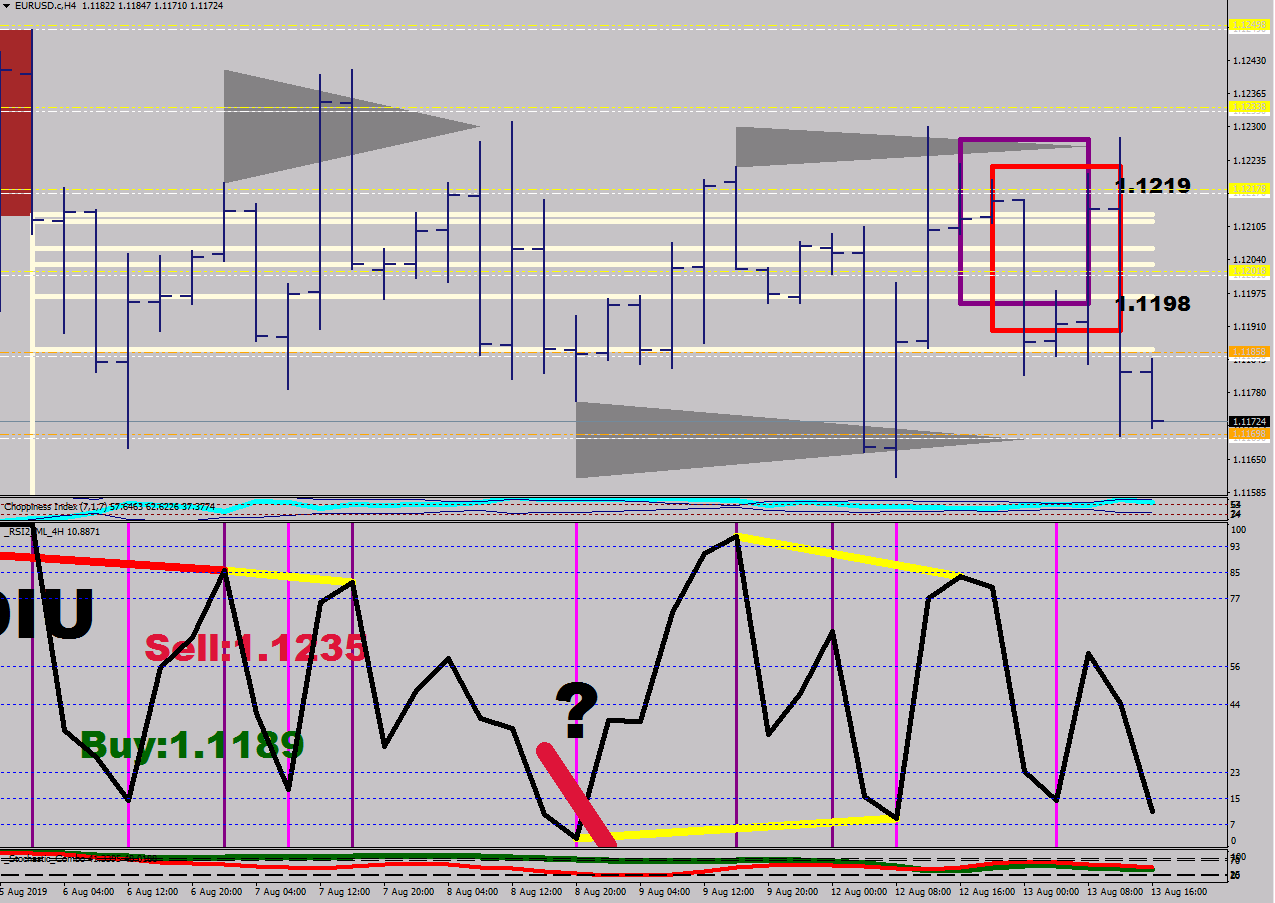
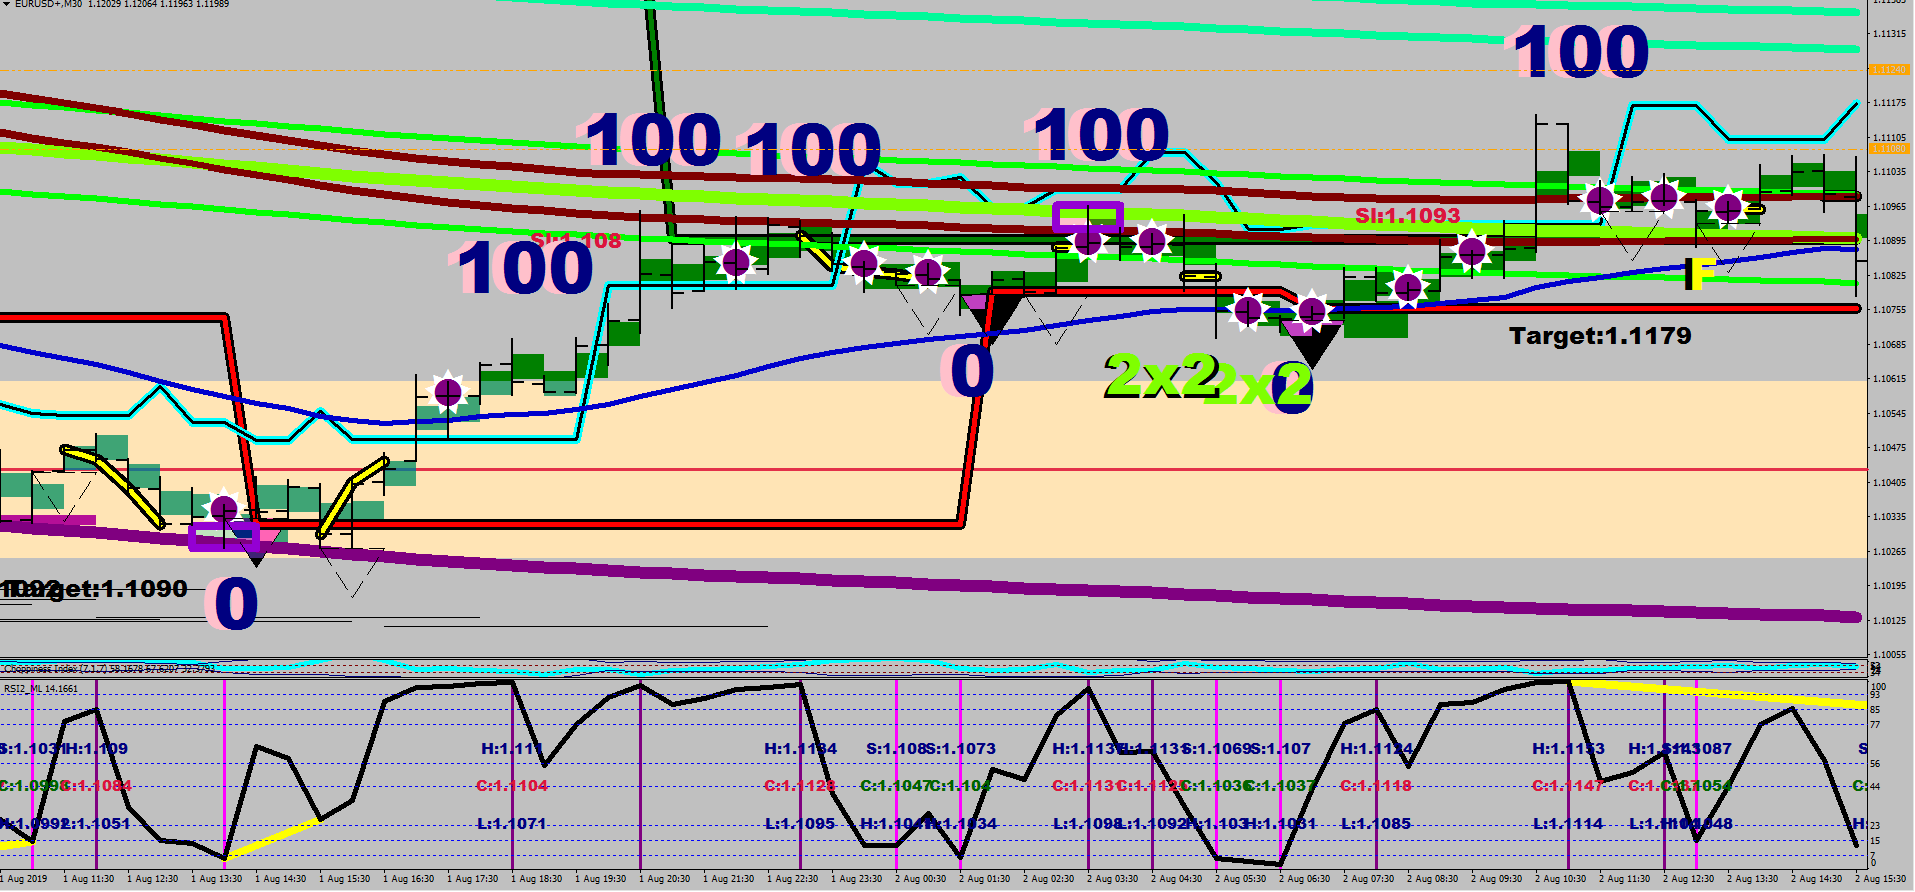
Another hint, that is actually accessible on top of the fore mentioned two, is the RSI2 reversal divergence.
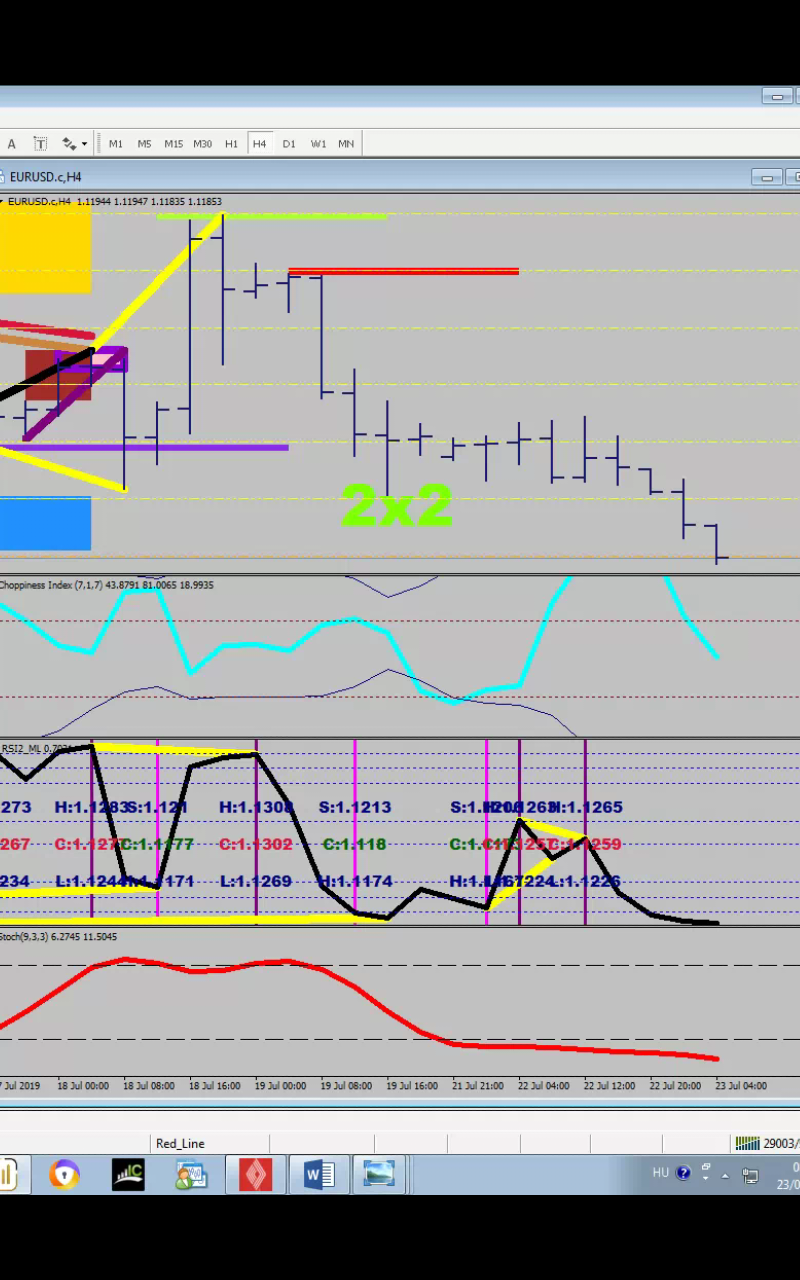
The triangle sharp ends are the averages of the 4H divergences. What are the support and resistance levels, if not these?
The reason for a divergence is that the trajectory of an incline/decline was broken by an accumulation / distribution, and since there are now participants holding the bag – they are under water ever since they opened, they would likely want to get rid of their unwanted positions for a break even, plus those, whom are in gains, may just have their 1-pip beyond the opening price protective stop loss placed. These events may tip the fragile balance of the scale that has been fueling the progress in a direction.
If you can point out these levels before hand then you can prepare on time to make the necessary changes.
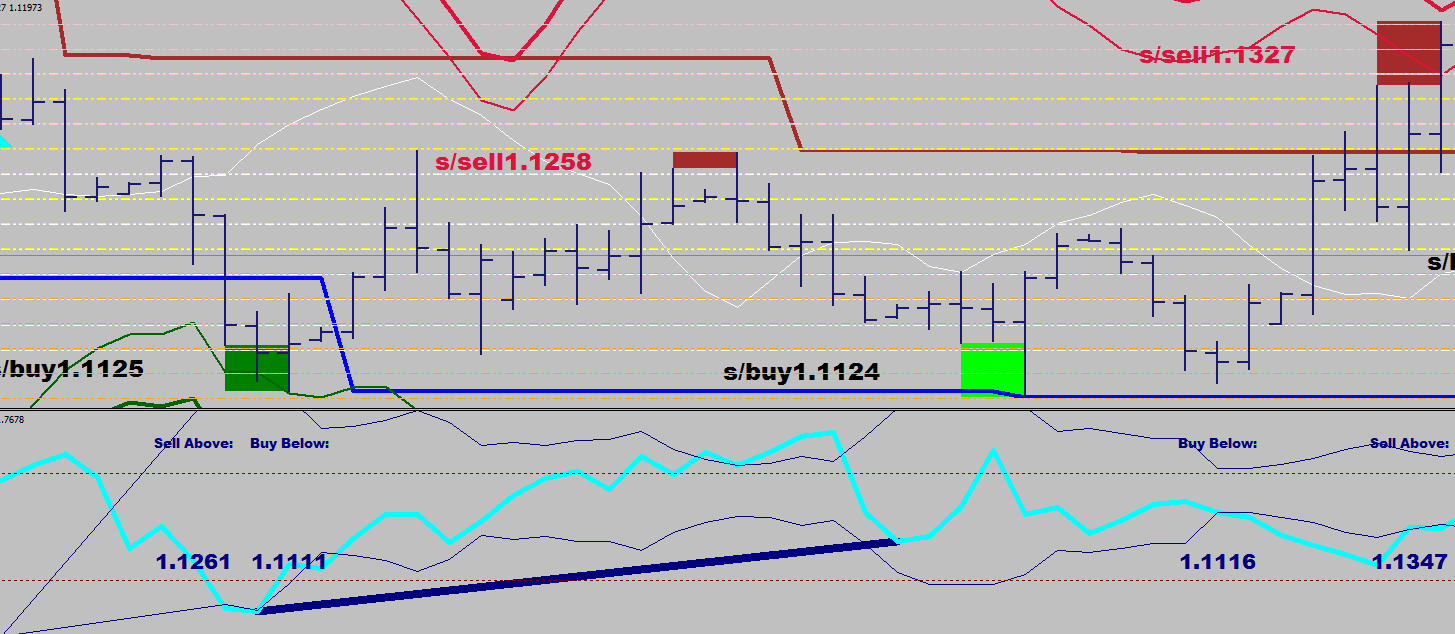
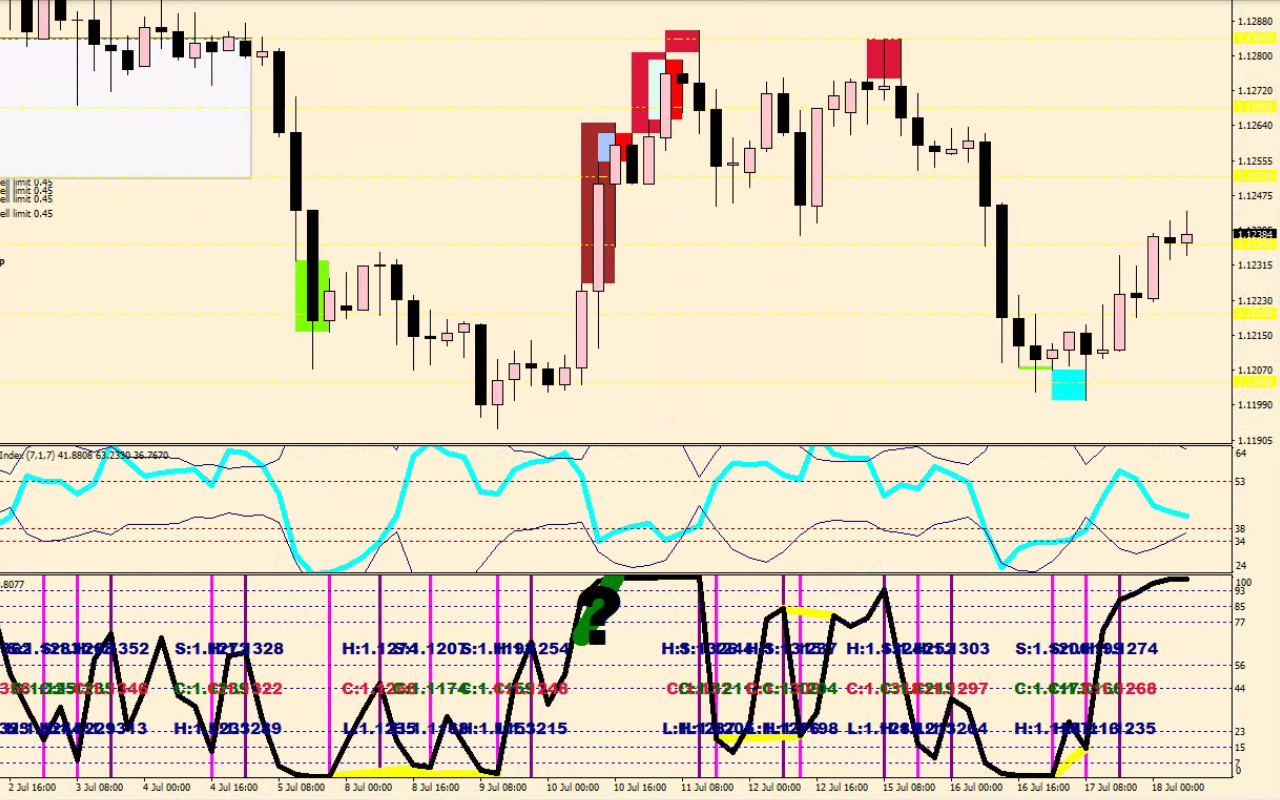
My idea for the day is utilizing the spike below the volatility bracket of the 7-sample consolidation indicator for a well determined entry point to start defying a move.
It is so simple, that it is almost elegant. You would need to have it as the first indicator below to have the plots show right.
Getting in the groove – in my opinion – requires a lot.
You would need 2 brokers 2 hours of server time apart, to be able to have different grouping on 4h candles. A signal may show up with one broker, and not with the other.
You would need to start plotting the things that are most important, and these things can be found on the Daily, the 4H and the 30 minute charts.
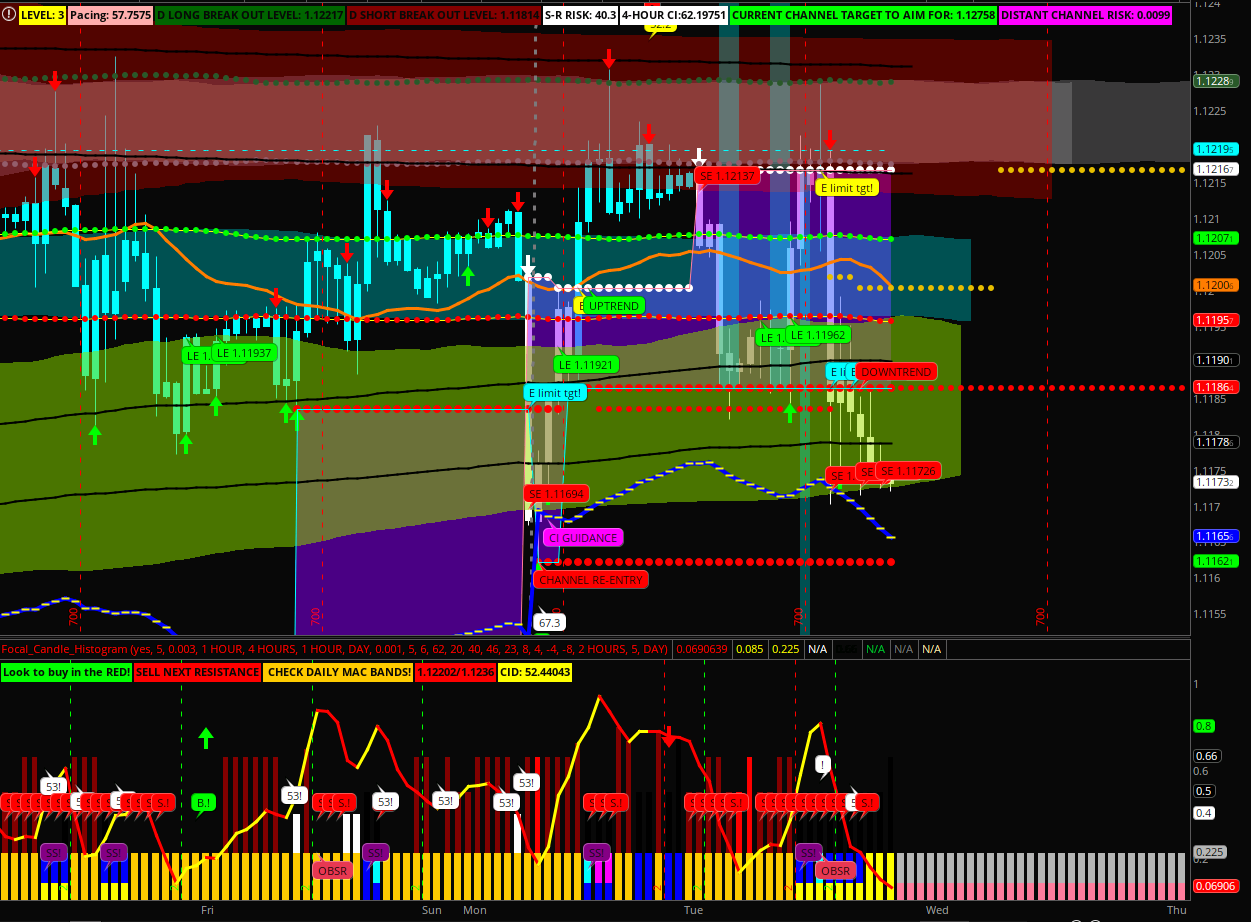
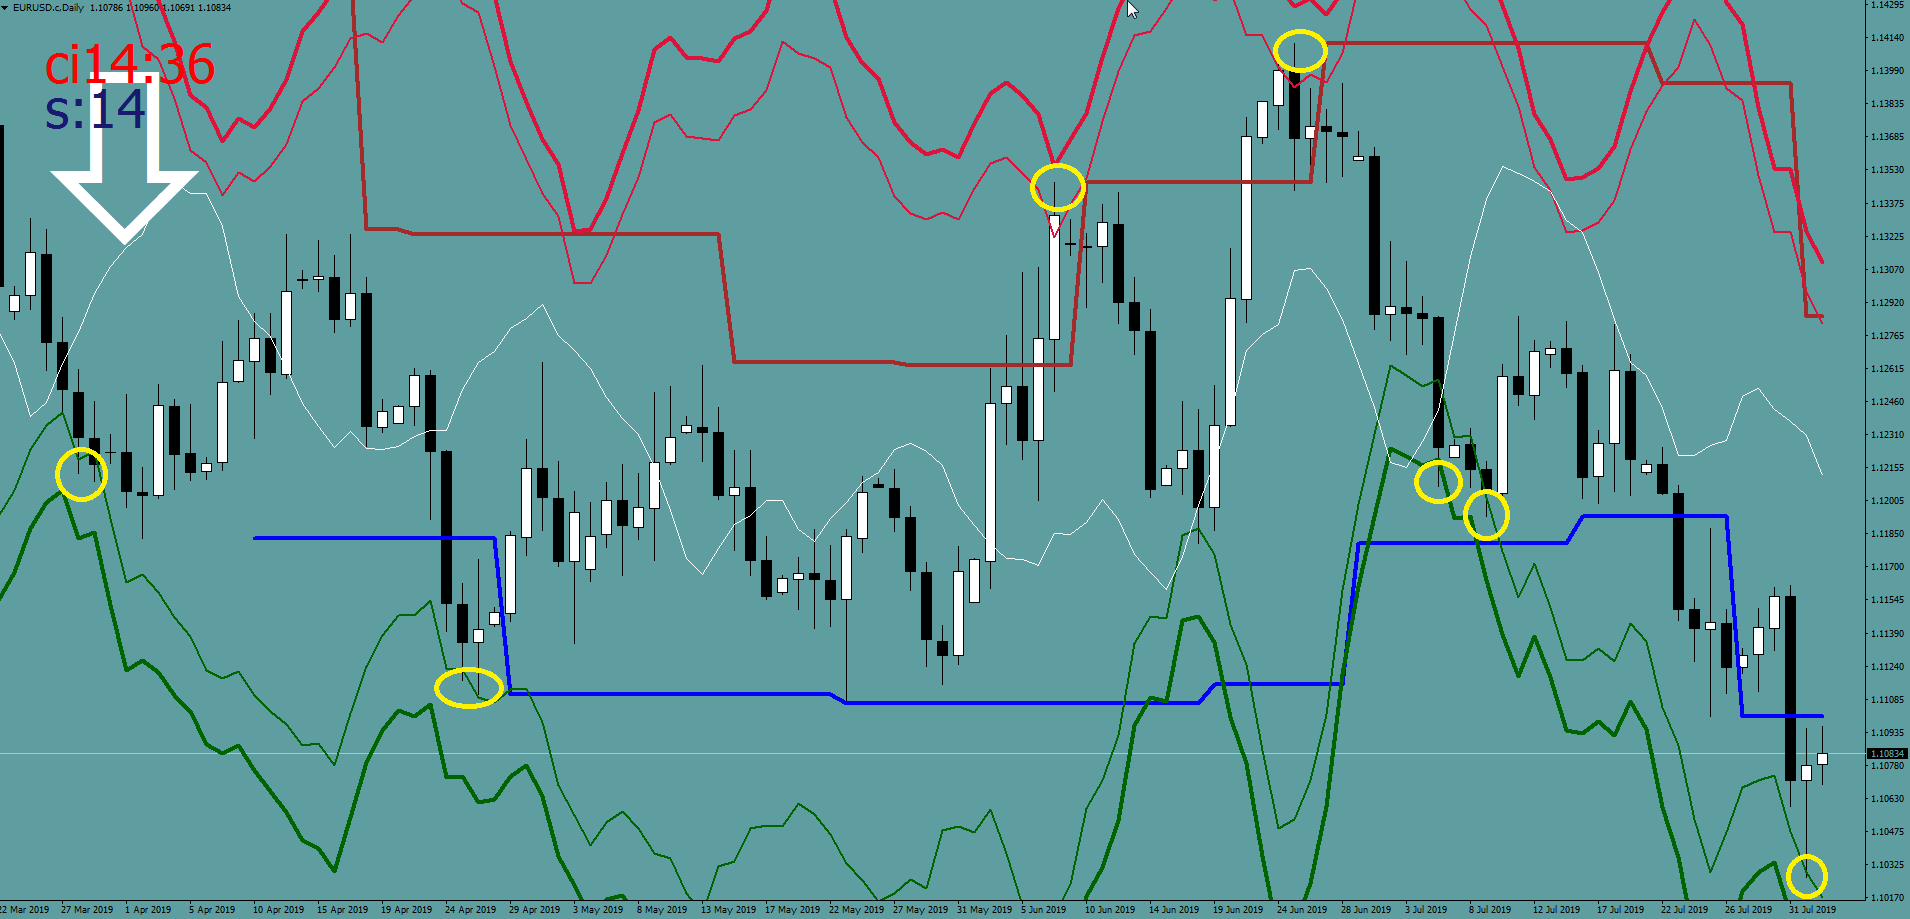
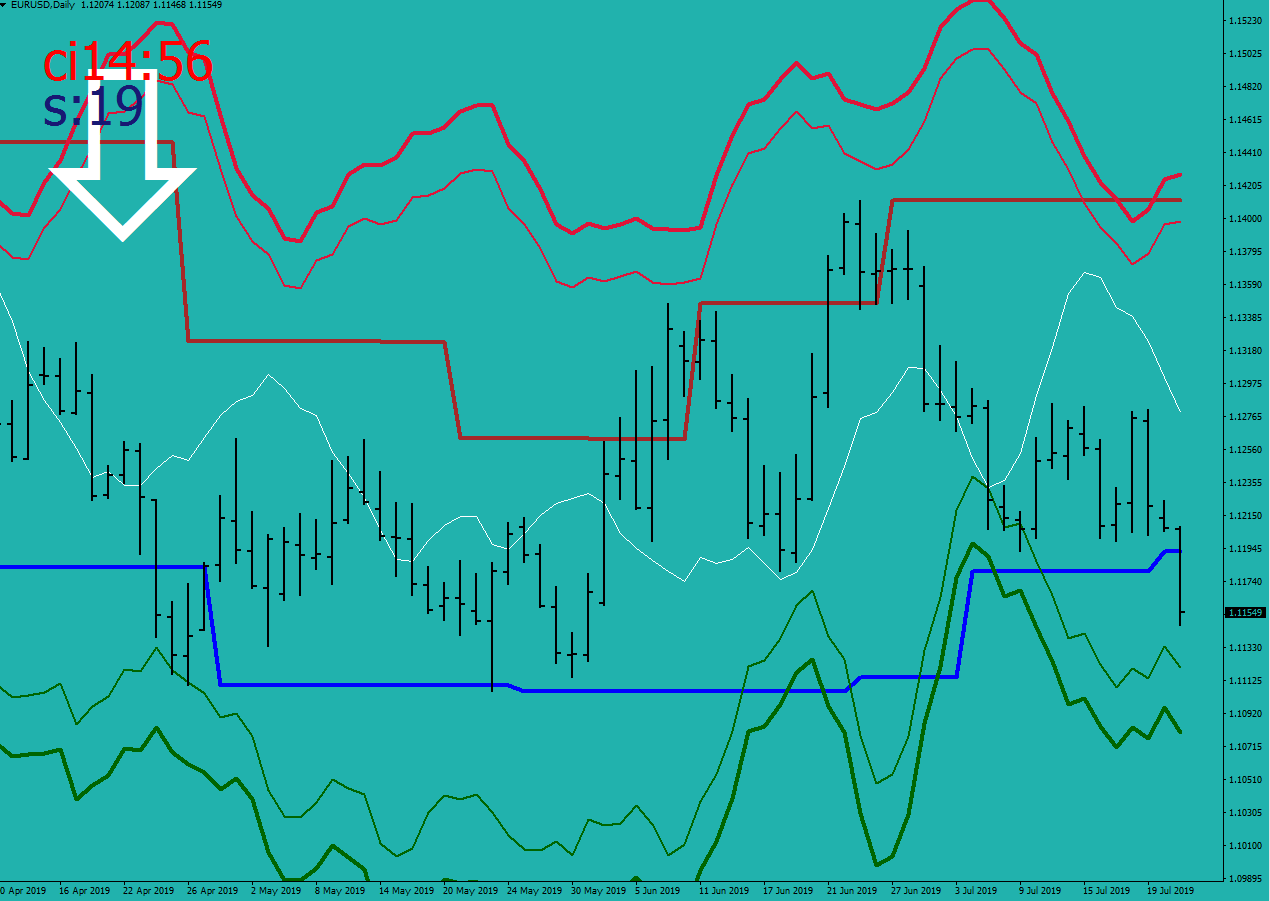
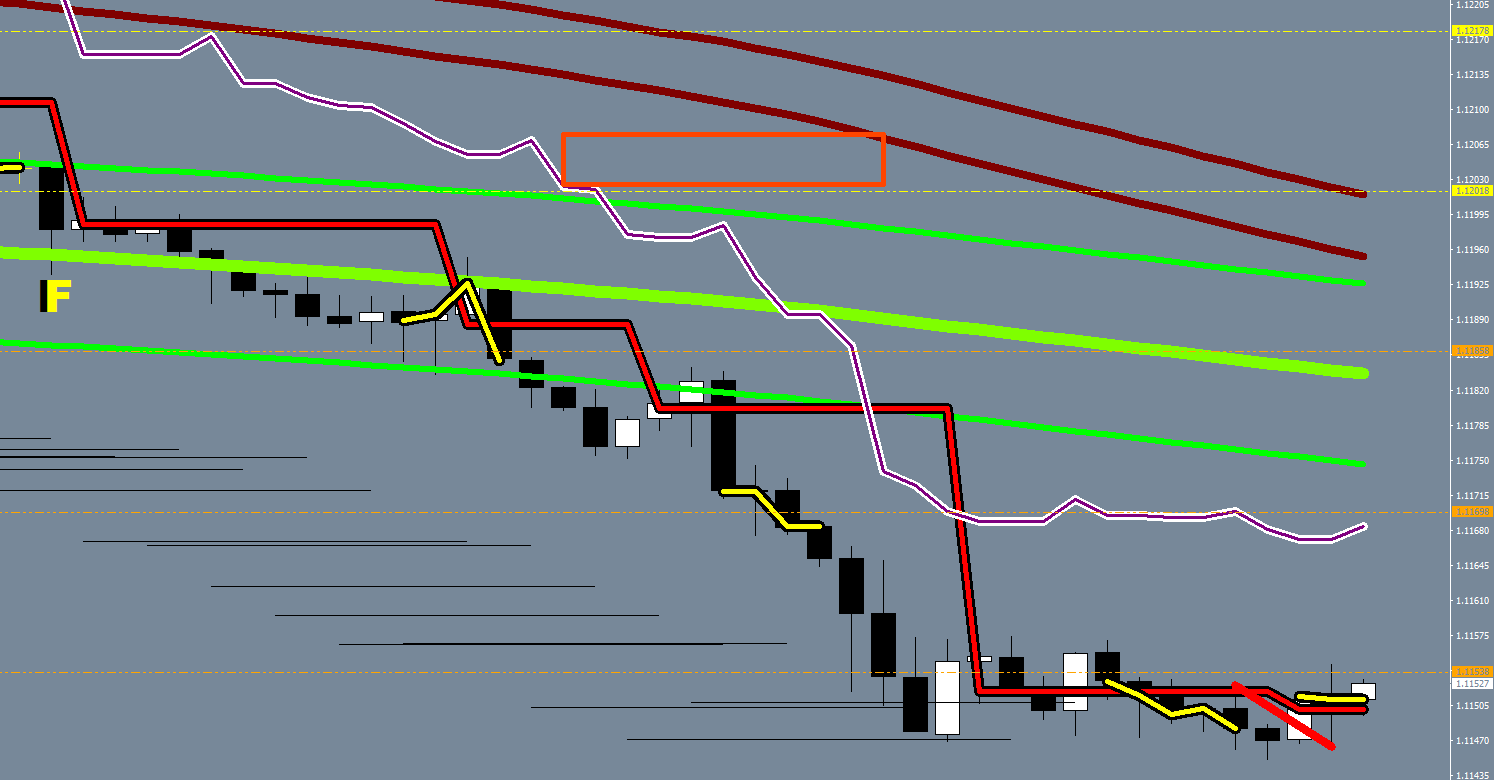
Energy bands can certainly help you with gauging the possibilities.
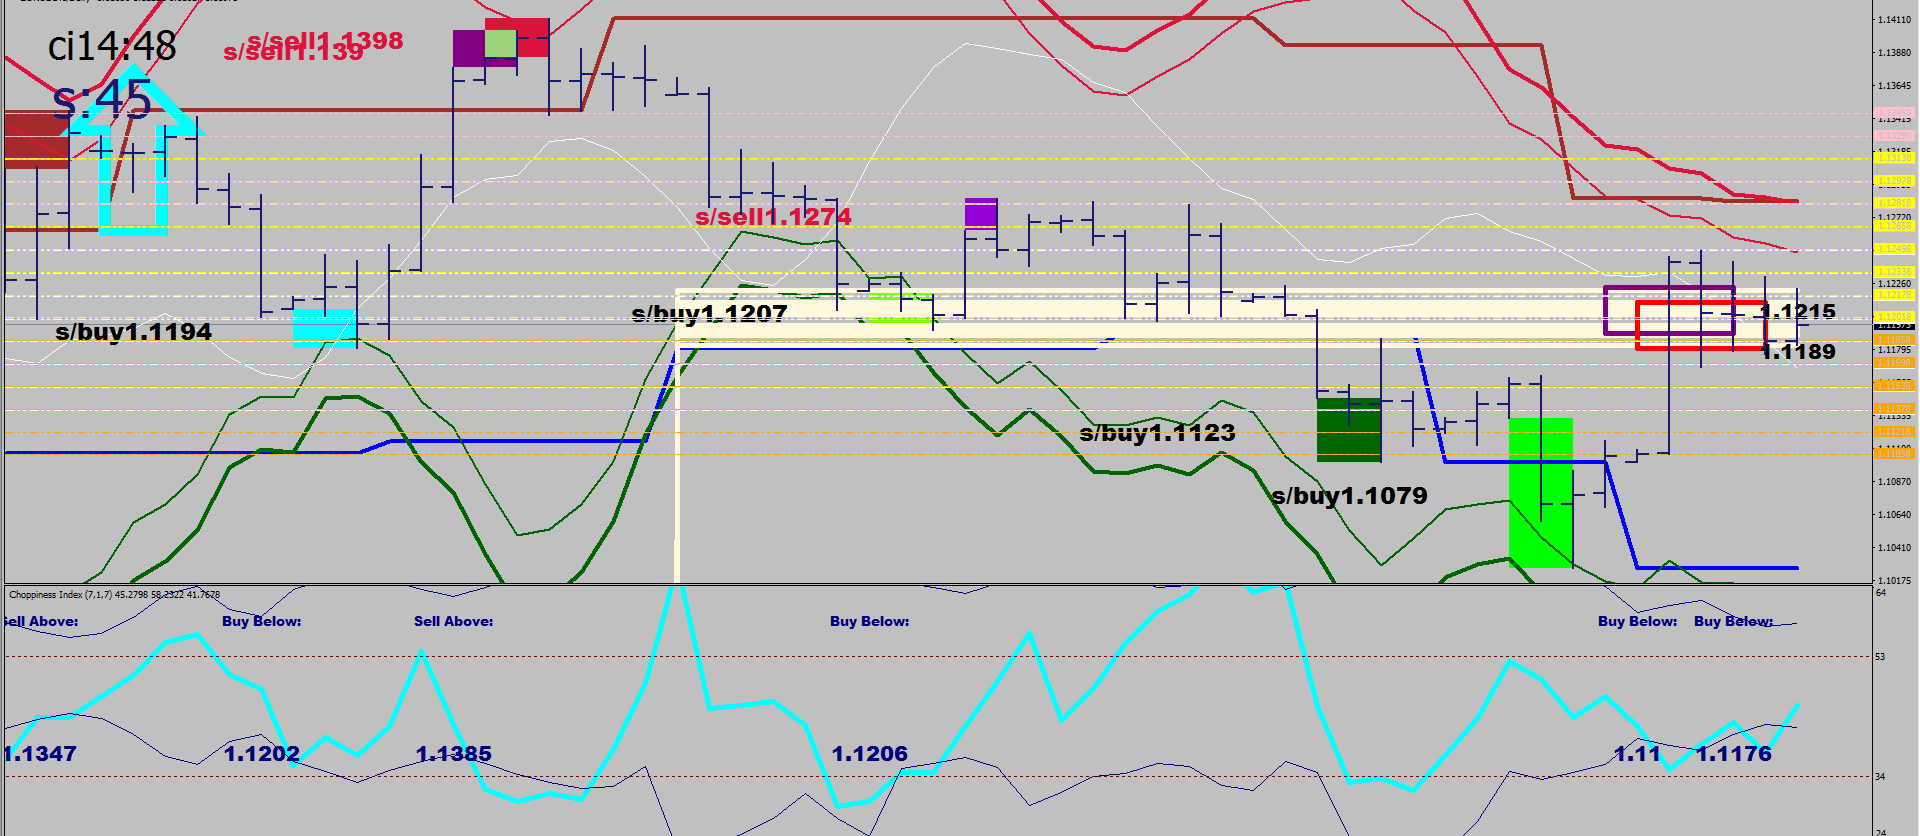
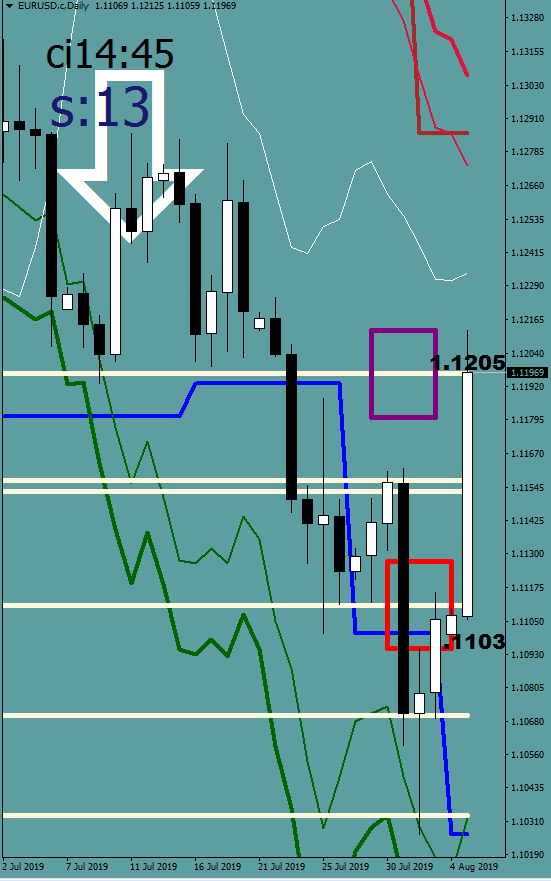
4H/ 2H dojis’ fake outs can give you targets for example for retracements (see Cornsilk lines and the two boxes with the two fake-out numbers).
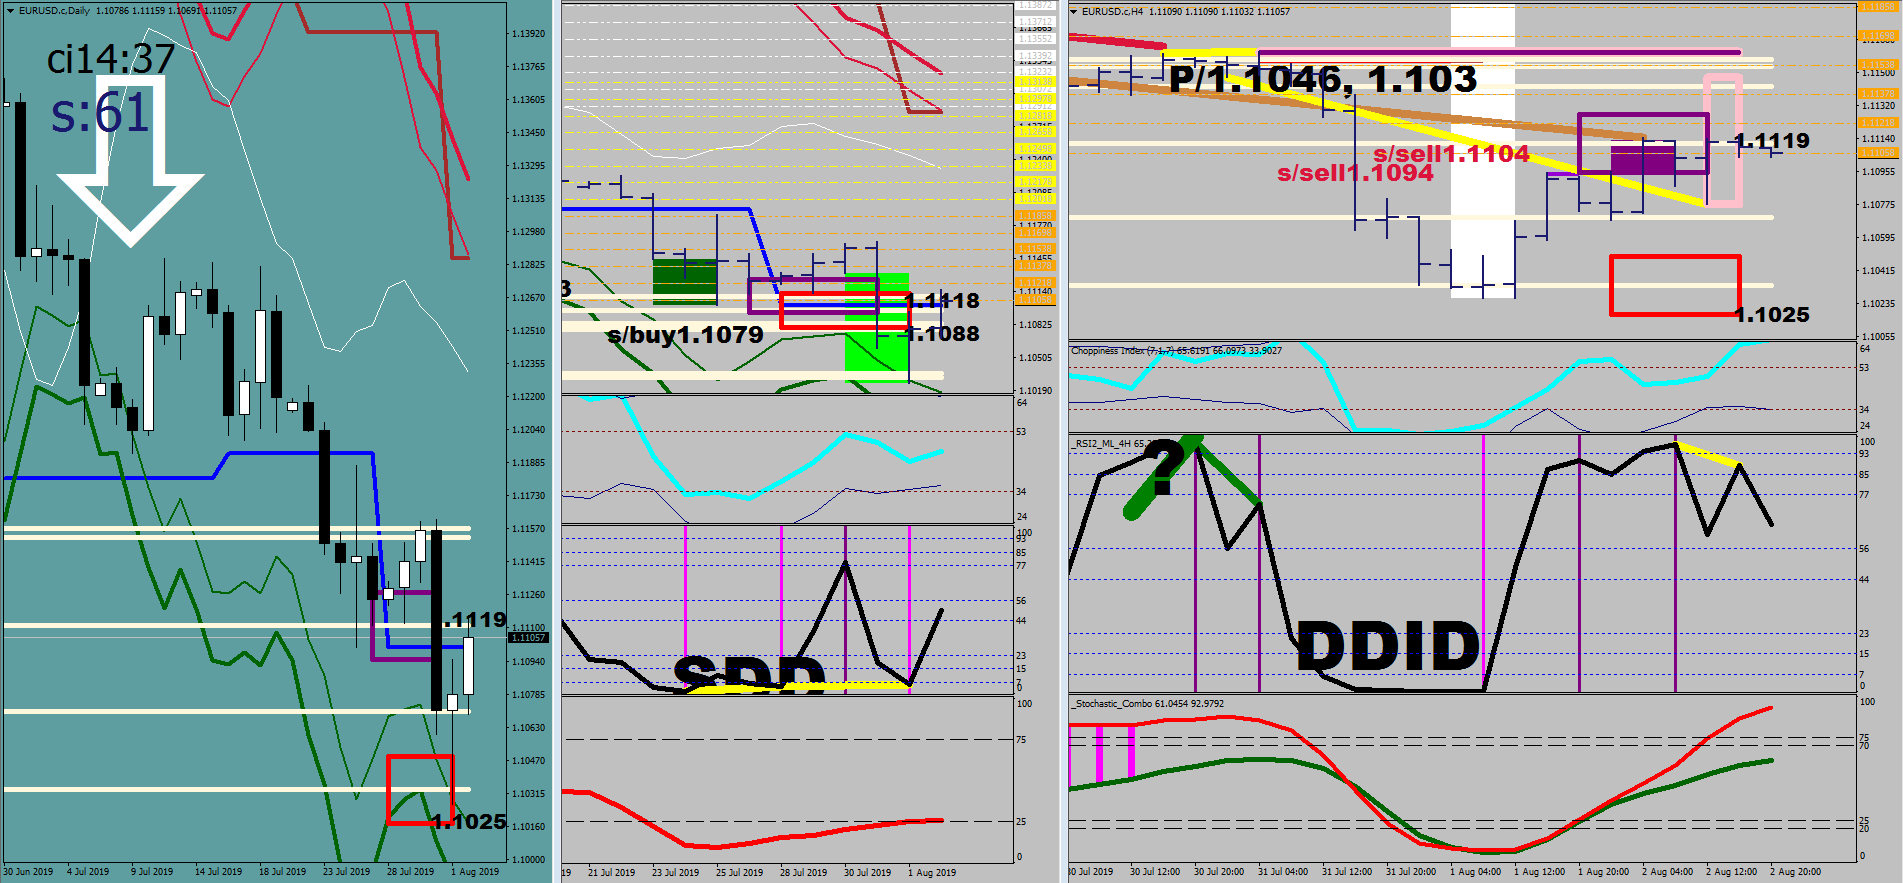
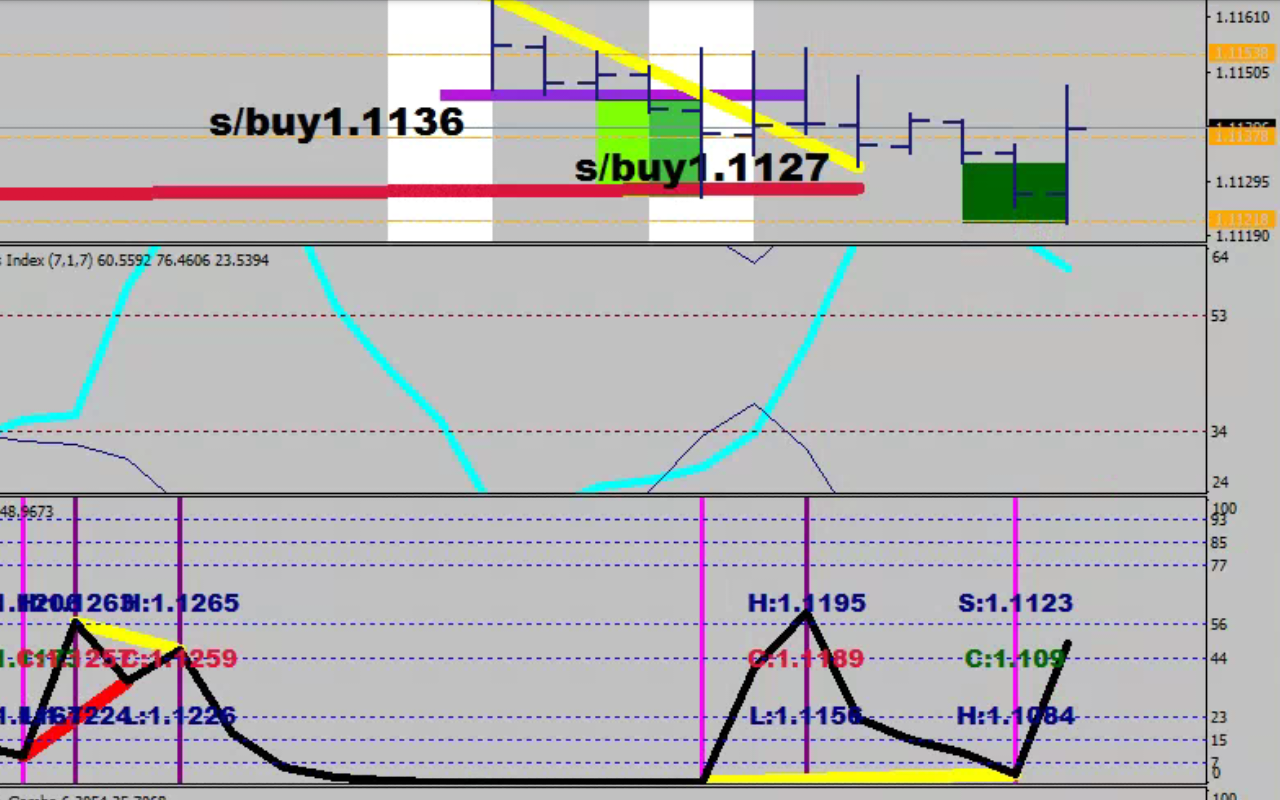
Stochastics with the right settings can help you find low risk new entries, i.e. sell the fresh 4h overbought in the daily embedded oversold (magenta stripes between the oscillator lines).
Monitoring for measuring legs and divergent legs provides you with an accurate picture of current reads. You should not be making any changes while a measuring leg is printing, exit & reverse upon a divergent leg, and only when the leg was printed entirely to prevent from false triggers.
Naming certain conditions such as I named some RSI2 sequences DDI and SD can help you remembering that a thrust is still due (with the only exception is upon having reached the end of the line – see the energy moat).
A sign of strength followed by a thrust is a peak, and you do not want to be buying until you saw 2 measuring legs printed in the opposite direction.
Invent a box with “bona fide reversal” label and put in 4h divergences with not both legs being in the overbought/oversold, and 4x 30-minute RSI2 divergences in it for starters.
The concept of the energy bands is to attribute predicting power to the current consolidation level by showing how far the price could get if it was to keep on moving in a direction – before hitting an “exhaustion”.
Since somebody had to think of this, I did.
An exhaustion would prompt a consolidation: price would have to start moving sideways, backwards or something in between.
For the last time I would mention that price cannot simply always do what it wants.
Imagine the value of these bands when you are playing options strategies, such as an iron condor. You must know where to put on your spread if you don’t want it to become a liability.
The bands are asymmetric. How did I end up with 1.27 and 1.62 multiplier on the downside and 0.9 and 1.15 on the upside and with a 4th value thrown in for good measure, is a mystery.
What matters is that these bands are dynamic, and can land you the right idea of distance possibilities.
For instance, when the high was made, did you or did you not have the maximum likely travel distance at your hand, at that very moment?
Not sure about the audience of things like these, but this is how I look at charts.
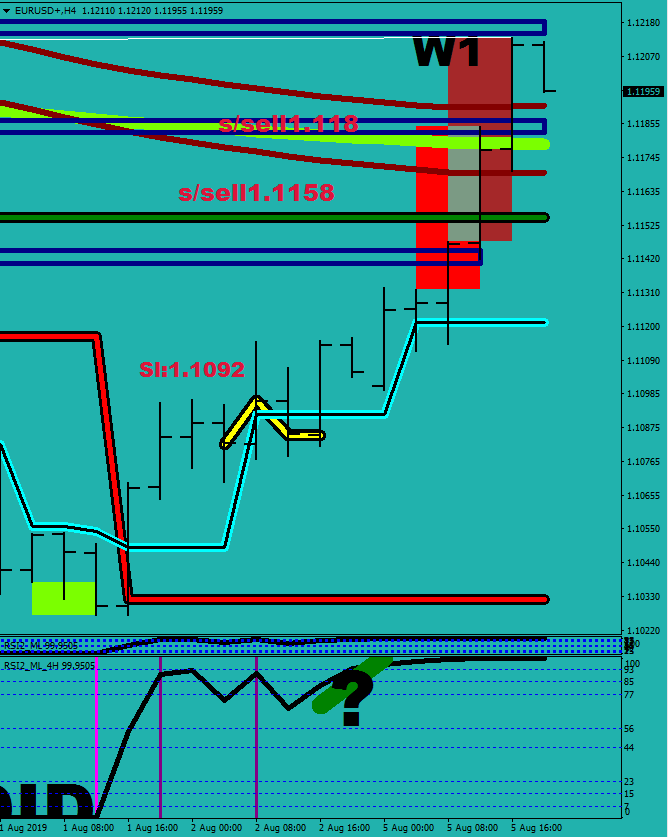
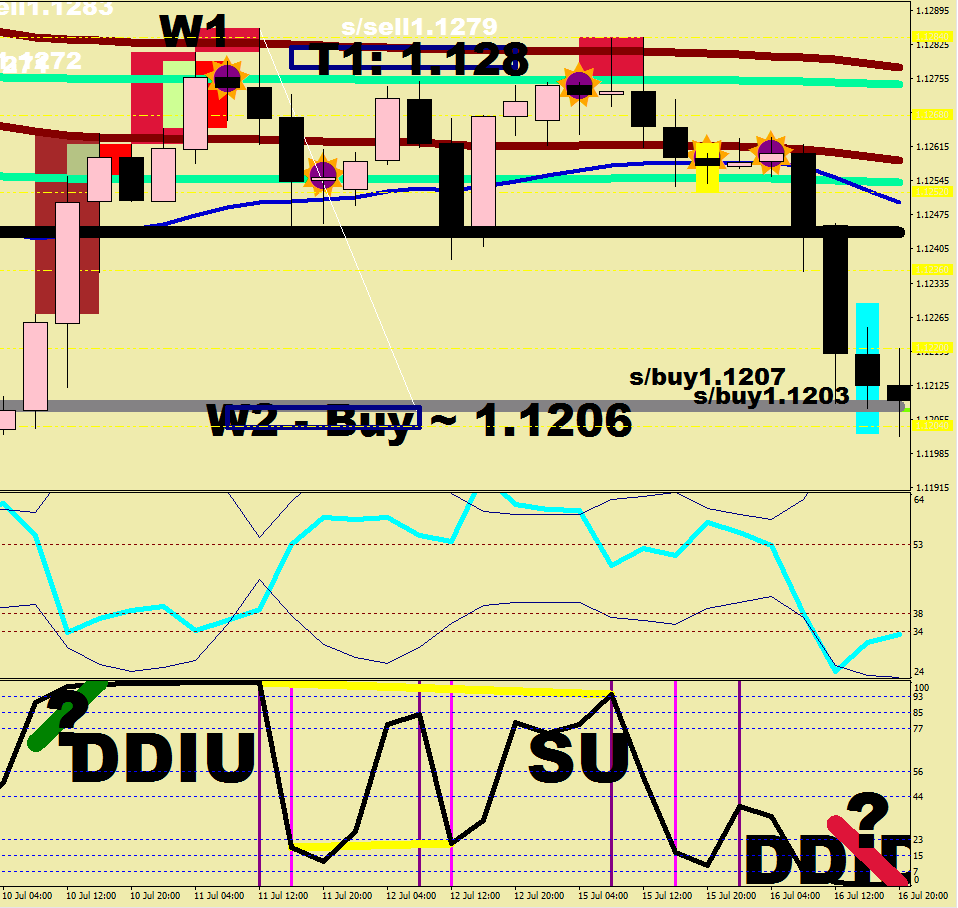
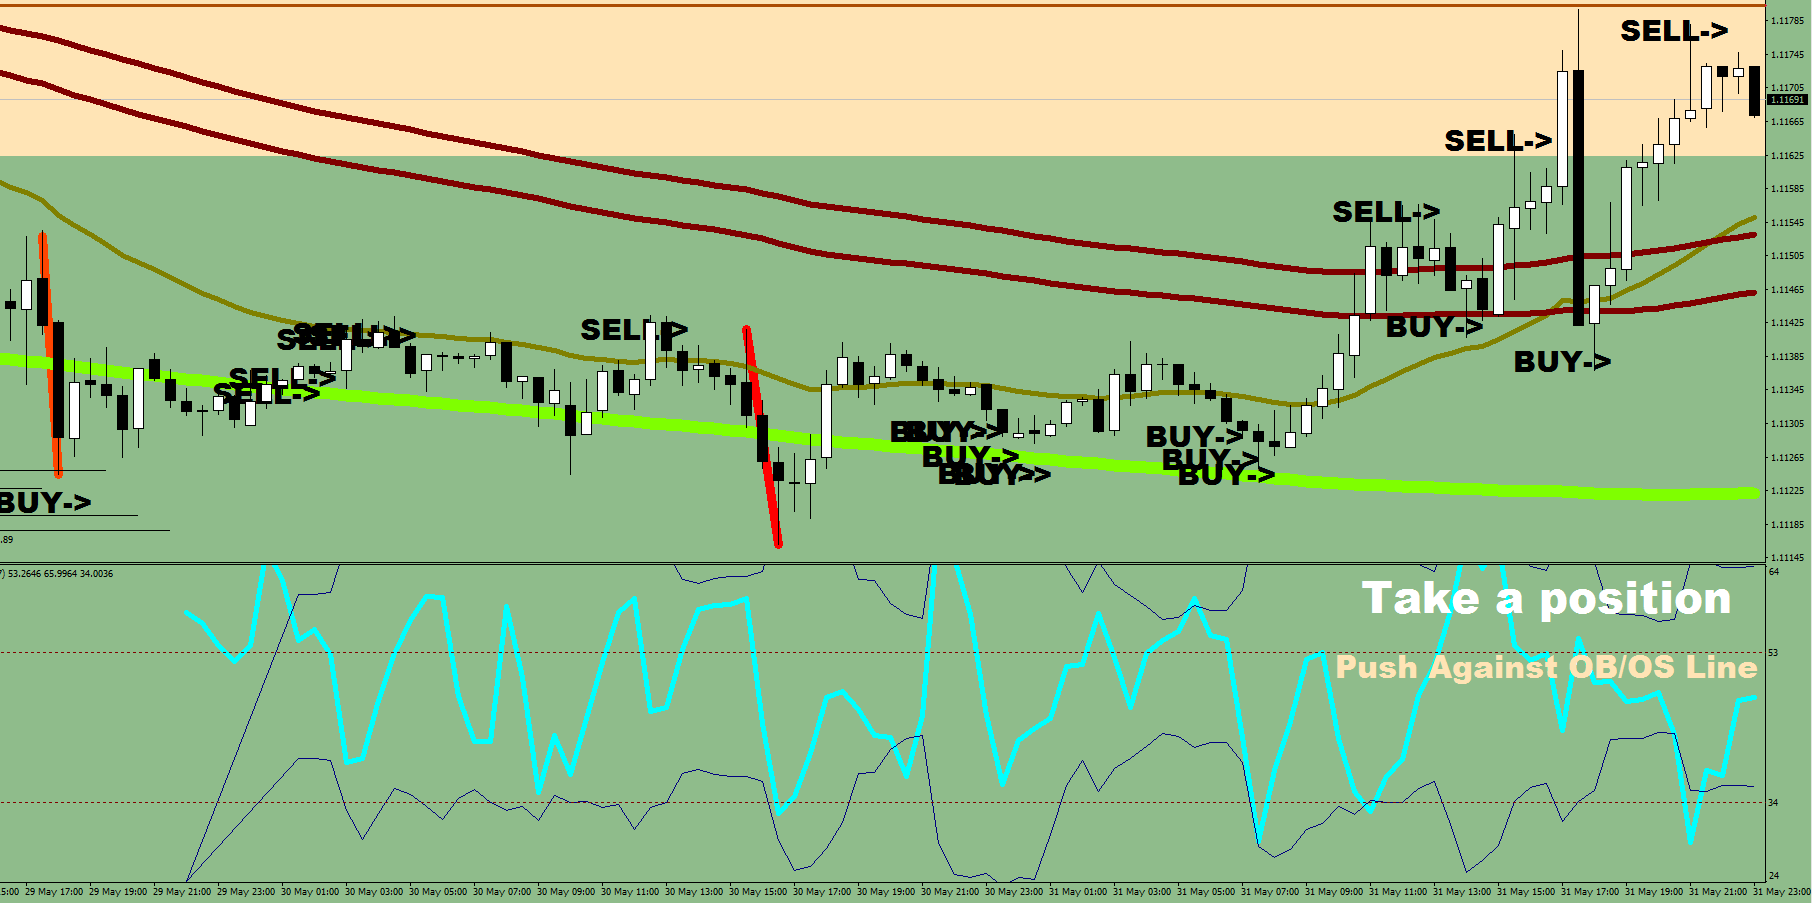
The previous up move ended in a DDIU + a thrust up
SU was the actual thrust of the DDIU registering higher than the previous one. The move started from the other side of Mr. Maroon 4H. The thrust’s end point fell short of the DDIU high – relative weakness.
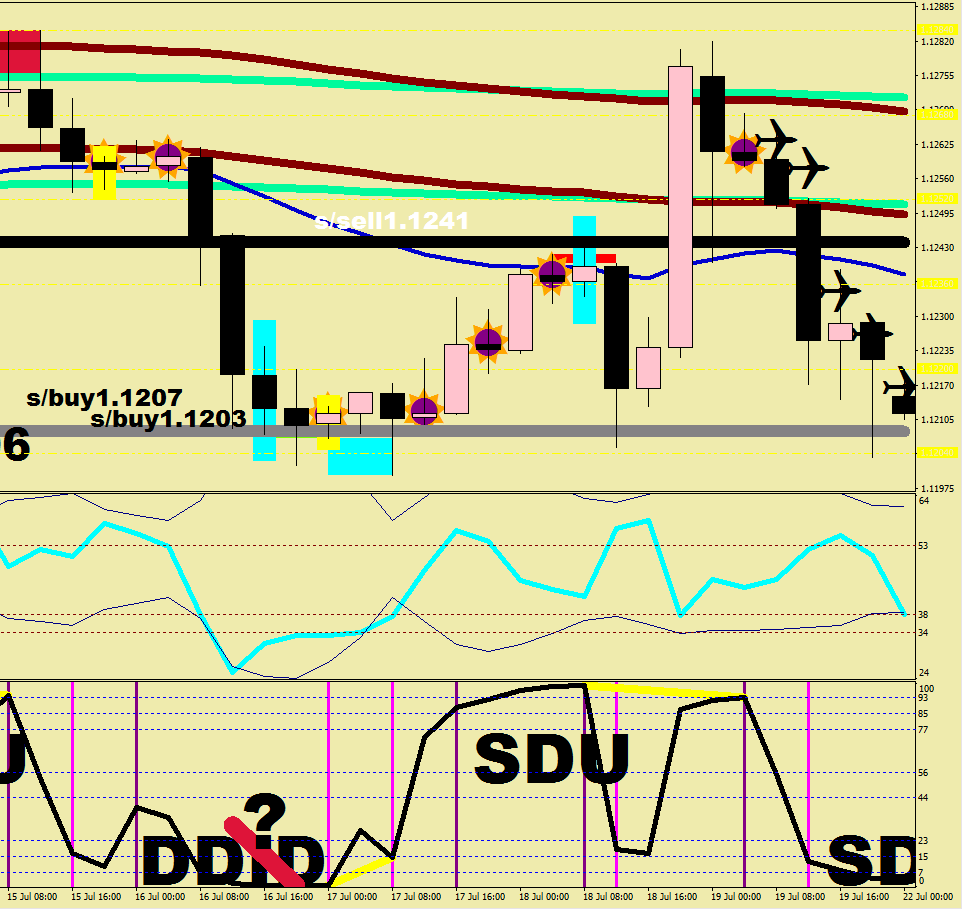
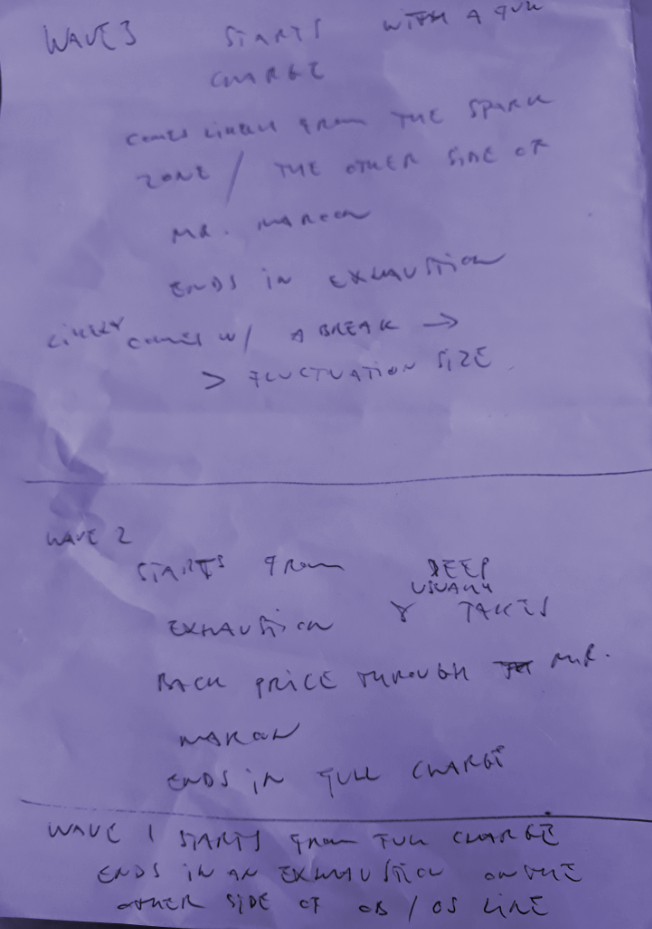
The current down move started with a DDID + thrust down = wave 1
DDID was brief, thrust came soon after – the yellow divergence resulted in a slight undercut cca 2 pips.
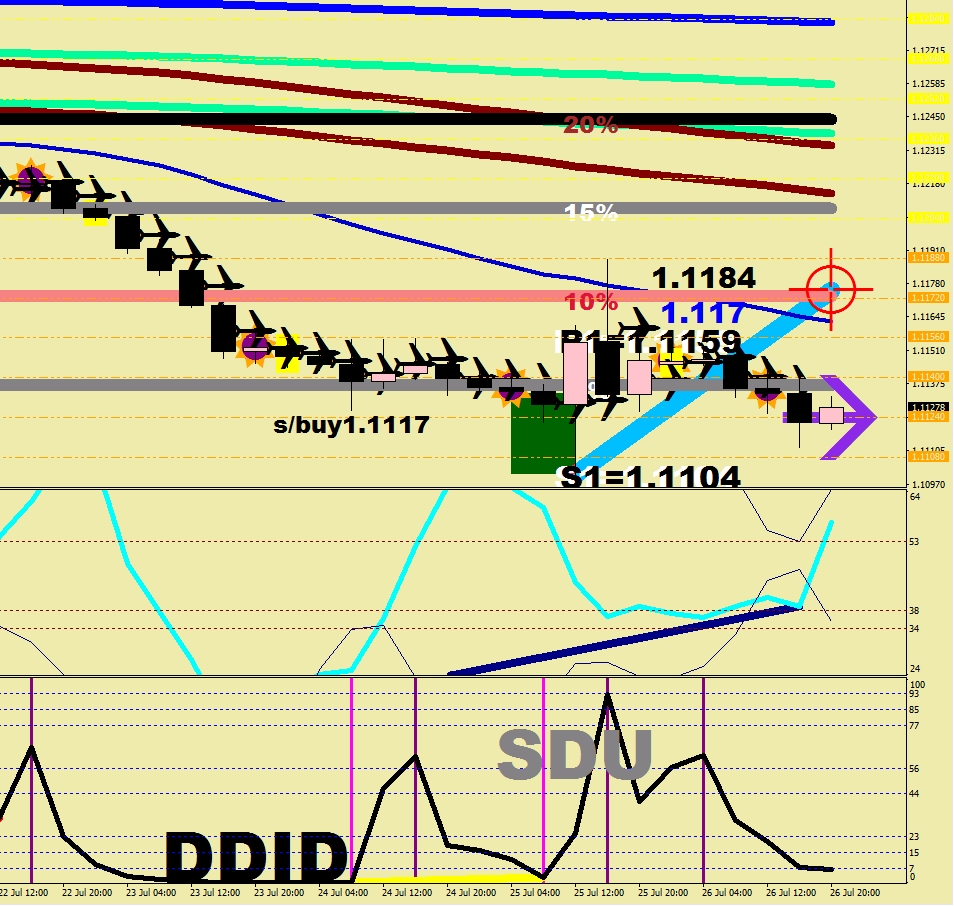
…and ended with a DDID + thrust down = wave 3
this undercut made it to 25 pips ~= 3/4 fluctuation size
A daytime job is perfect to be able to dedicate enough brain cells to figuring out how things work.
Read the following:
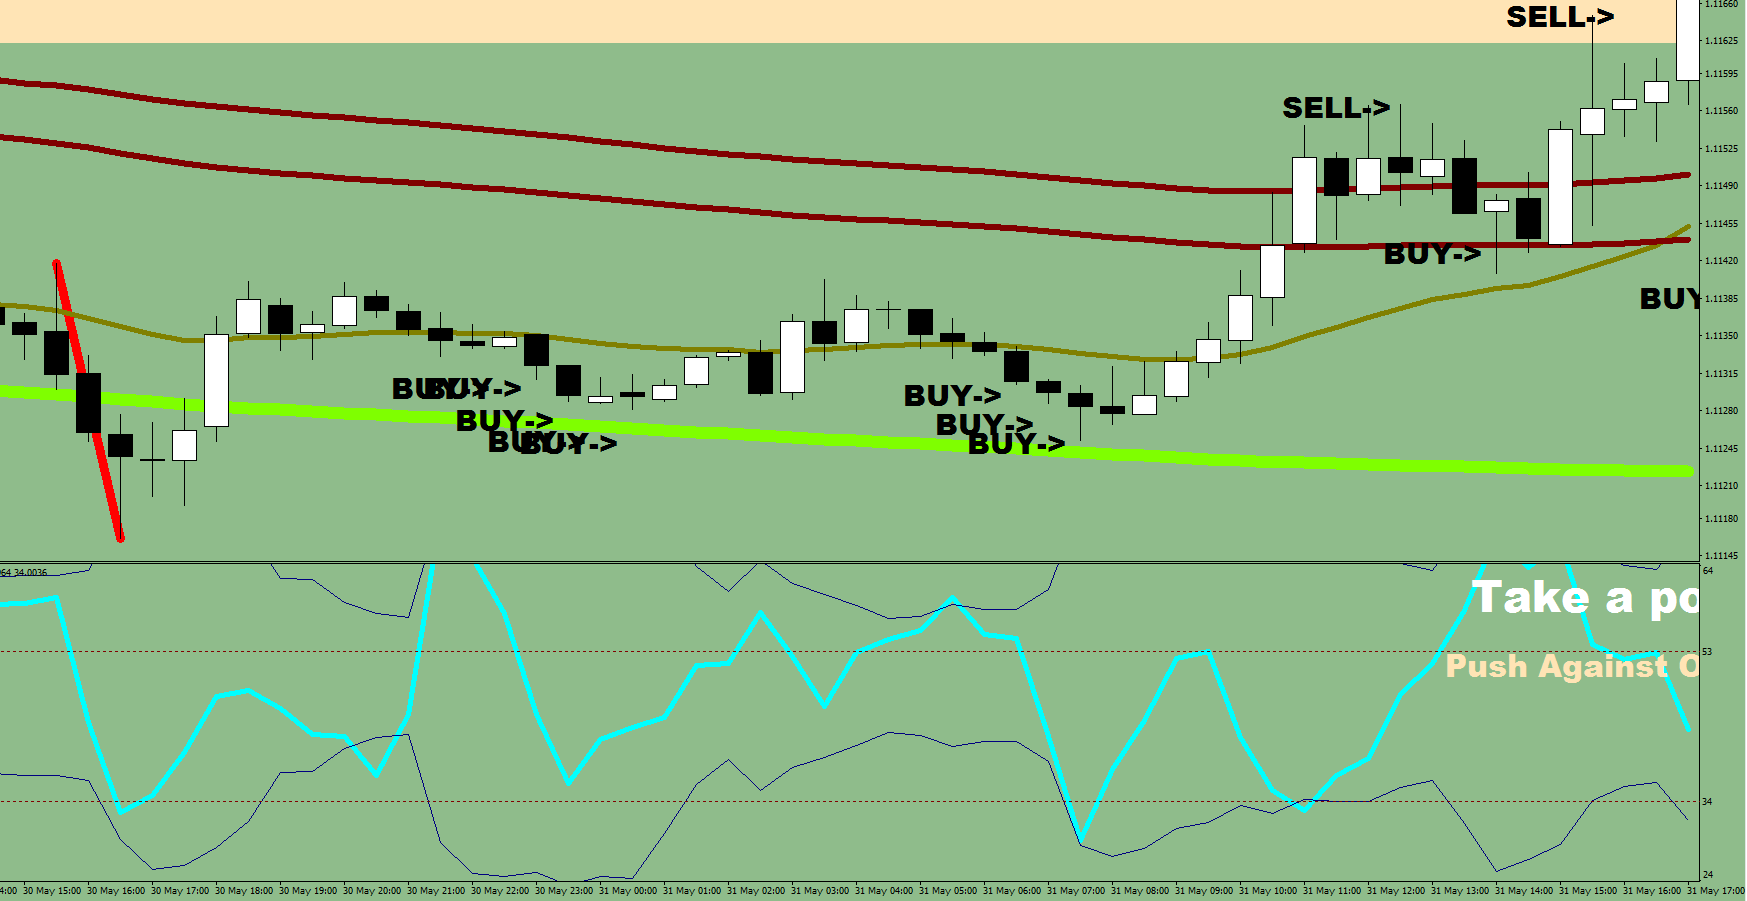
Now, please show wave 1 on the following image:
The red tail was an exhaustion terminal tail. If your drawing is any different from the following, then you probably suffer from the handicapp of E.W. wanting to call everything that happens on the chart a wave.
The part between the red tail and the starting, full charge doji was merely fluctuation in the downward channel (which was parellel with the Green River).
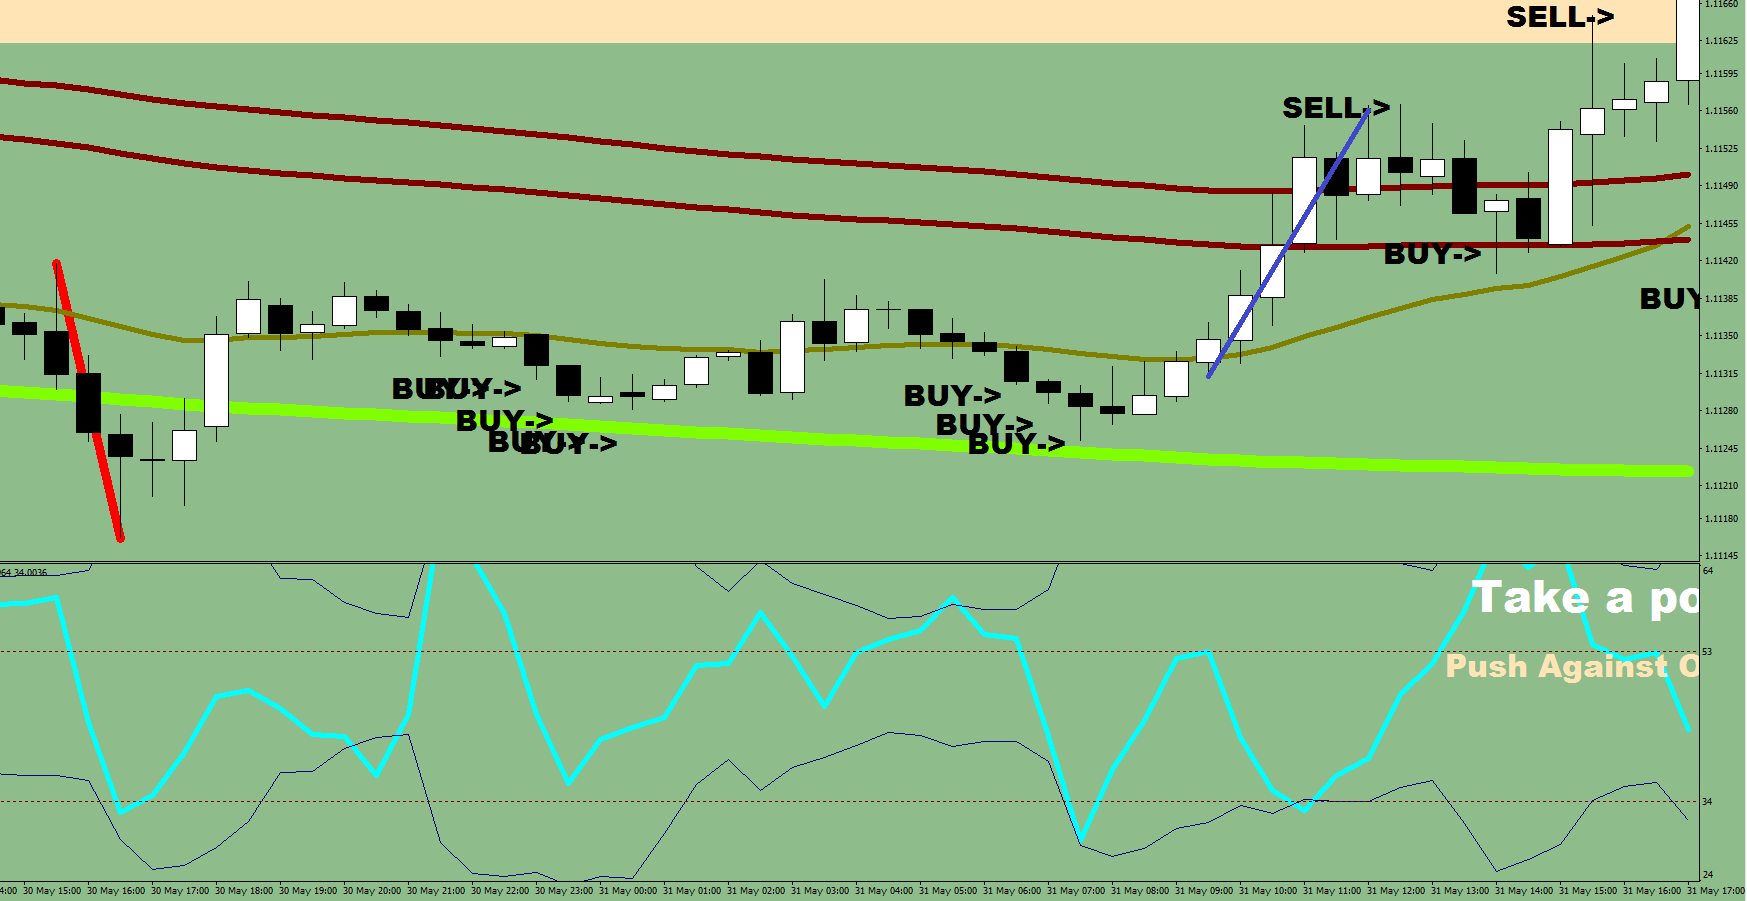
Wave 2 was easy enough, it recharged the energy by making a cross back down through MR. Maroon. The only thing noteworthy about wave 2 is that it took out its own high point while pushing lower.
Wave 3 would show an exhaustion, and this would be new to you, but most terminal moves end in the zone between 45-41.
I would put wave 3 like that. Again, not touching wave 2 and not ending at the high point, but rather the exhaustion point.
Funny? It gets funnier. One of the returning features of a wave 4 is the beat of the ending point of wave 3.
Wave 4 recharged the energy again, and ended shy of the wick – which by the way would not exist according to E.W. for “wave 1 and wave 4 cannot overlap”. The heck they can’t.
So there you have it, wave 4 in red down and wave 5 in blue with the highlighted exhaustion tail, that took 2 hours to develop this time.
(from the notes of Wave 5)
One question that might be shaping in your head if you have been a reader of mine, is if this was a mean reversion.
The numbers on the Stochastic Bars DD were missed by 1-pip on the downside and 1-pip on the upside.
The horizontal line of course was the last Peak Trending Exhaustion.
It is a back test for sure. Was this a reset? What do you think?
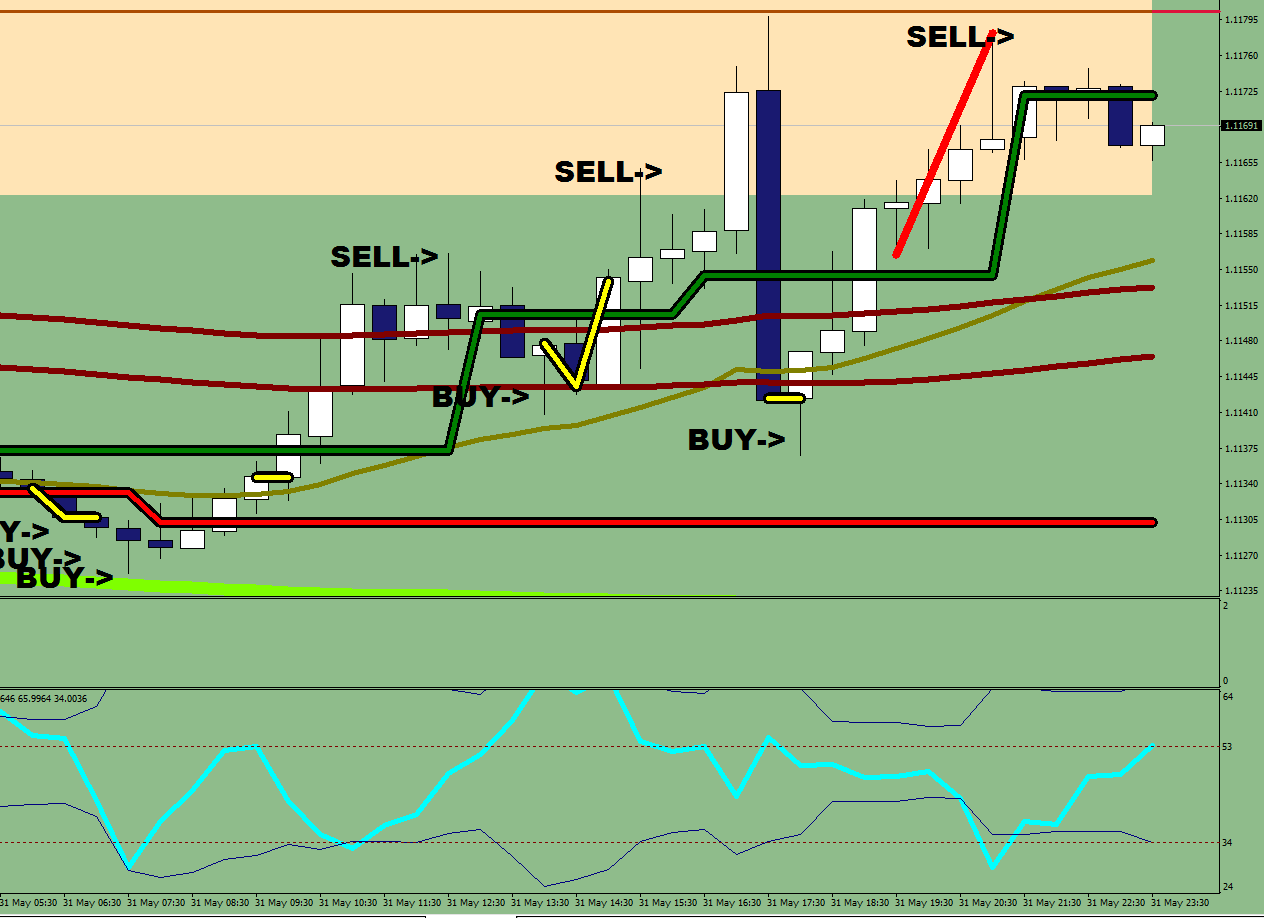
On the following image you can see the starting points of the 3 pushes: the high consolidation-level areas.
The 1st push came from an out-of-oversold condition. The direction was up from the red tail earlier.
You already know from me that the market does not turn direction without an RSI2 divergence, and also that the divergence may be between two measuring legs (wedge) or between two shoulders (H&S).
The first, obvious piece of information is this then: the answer to where is the Queen coming from is the last divergence she made.
Divergences that happened during stochastic embedding, should be eliminated.
Example 1:
Wedge turn
The wedge turn happens between two measuring legs as mentioned before.
(The measuring legs are qualifying thrusts that register in the upper/lower third on the RSI2 HL2).
The comparison should happen on the highest/lowest prices reached and the corresponding RSI2 readings. It is important to realize, that the price highs/lows do not always coincide with the RSI2 highs/lows, so go with the readings at the “fractals”.
So, as the first example shows, the second high was achieved with a much lower RSI reading.
Now, to the most sensitive part, the anticipation. Anticipation is important, for you must be prepared for the upcoming turn in order to be able to make the necessary steps.
It is one thing seeing that the move is about to run out of juice, and start dumping your holdings especially upon seeing the resistance and the change in the angle.
It is an entirely different waiting for the turn to actually transpire before going in in the opposite direction.
This second part is incredibly hard if your vocabulary has no entry under the word: discipline. Males are by nature breachers, and bankers are doubly so.
You need to start putting yourself on the clock: knowing what time it is means to be present at the last 4h candle finishing and the new one starting to print.
So when did the turn take place in our example?
It did not happen until you had a 4h candle closing below 50% of its length after the print of the divergence.
The best entry would had been after that doji candle, on the 4h open at 1.1260 and on the 6 extra pips kick back there was an opportunity to add to the position to improve on the cost basis.
After this print the Queen’s direction was turned down.
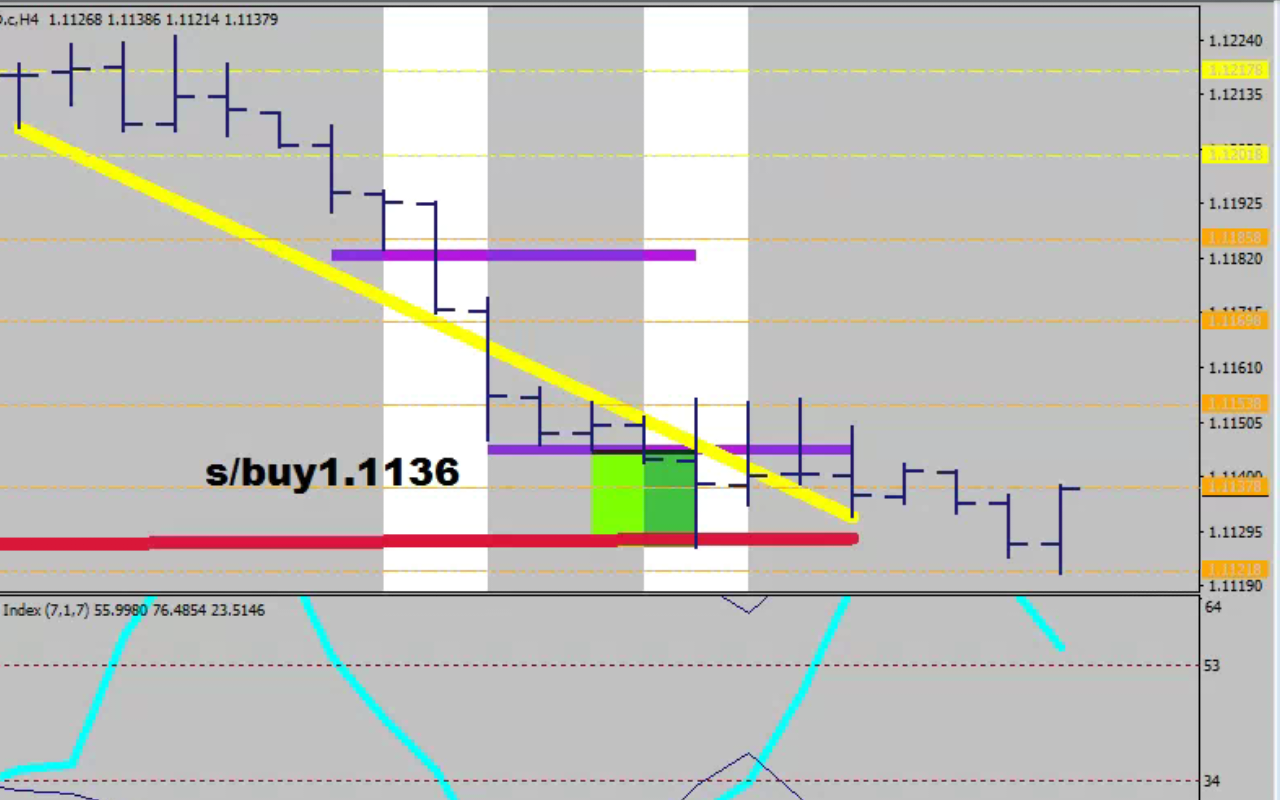
As for some actuality:
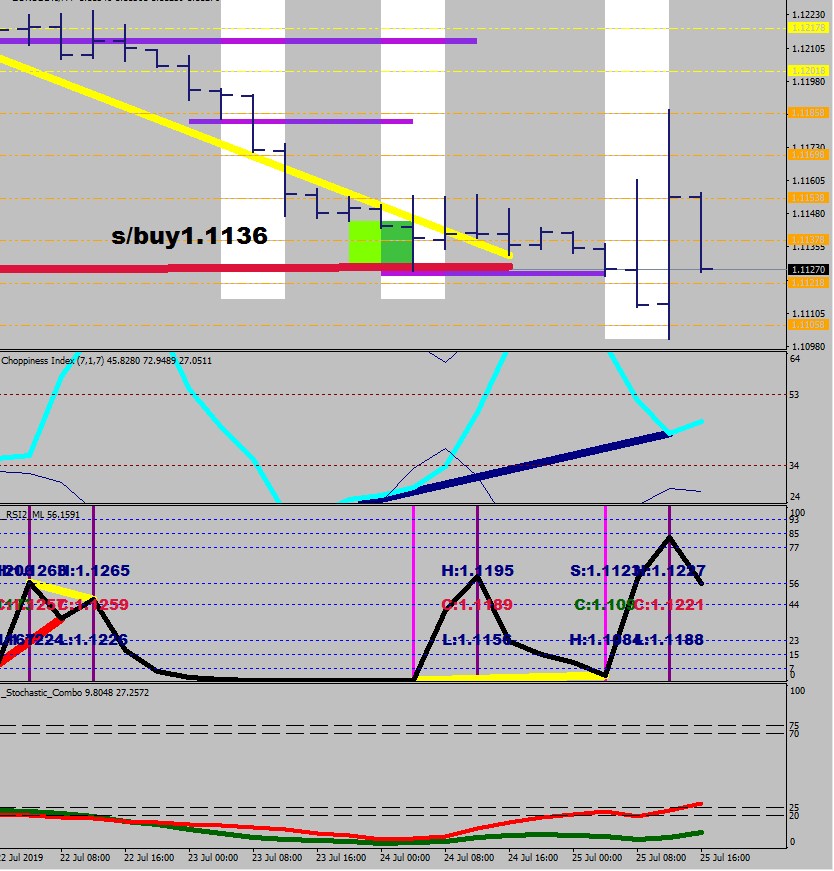
The Queen has found a problem. Her solution might just be buying starting at 1.1136.
In conclusion, if you know what the Queen is doing, you know everything.
Learn to make good (compromise) This involves taking losses voluntarily at times. I.e. for the last 2 days I could had closed out my open positions for at least 5 times for a tiny loss: the 1,500 balance would had dropped to 1,300+, but the prise would had been definitely worth it: no open positions = no drag in any direction. The next day may prompt you with a very different situation. Appreciate the value of a clean slate.
Build equity: take small trades (by distance / time duration) to be able to better the equity / balance ratio and extend on your margin rope. The lower the spread, the higher the leverage, the more edges you have. Small profits can really add up, and the 10x$10=$100 is certainly scalable.
Money management is just as hard as the other part:
Get the reading right
The main thing to concentrate on is understanding the Queens desires. An example for misinterpretation of a divergence: The lower low with the higher RSI2 is disqualified by the embedding: the Queen being perma oversold.
That steep rising yellow was with oversold stoch D and so I would change the colour later; breaking it was an excellent continuation entry.
Try to grasp the concept of measuring legs and divergent ones.
When the market is “supposed to be” doing something, and it does not do it, something is up, and you better put on a hedge until you figureit out or it shows you what.
A volume signal (30m) is not a signal on its own: a high print is definitely showing for some interaction, but it may be only partial unload of the holdings, and as such may not be the actual reversal point.
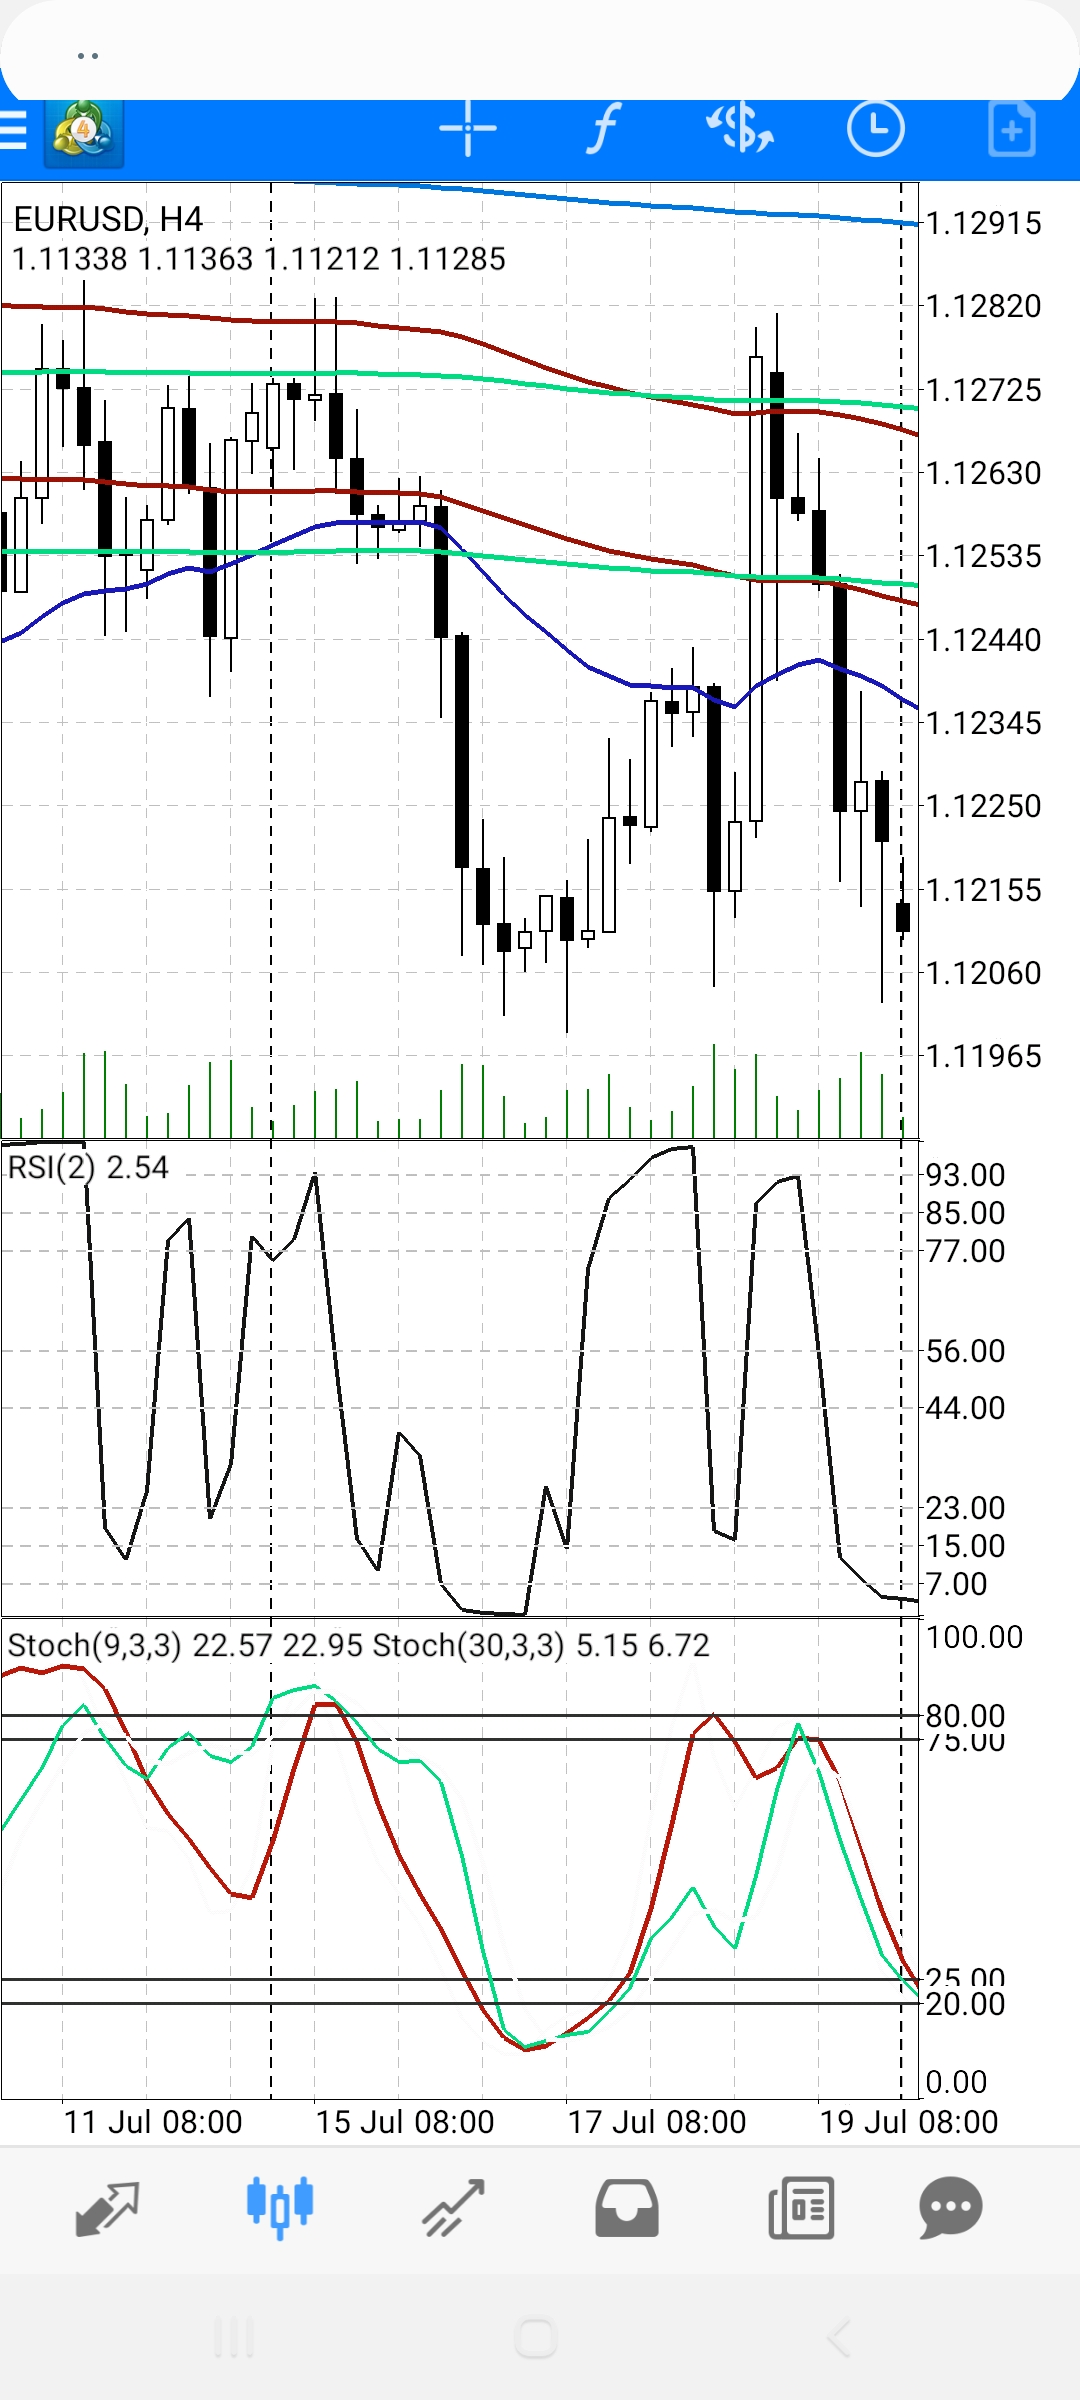
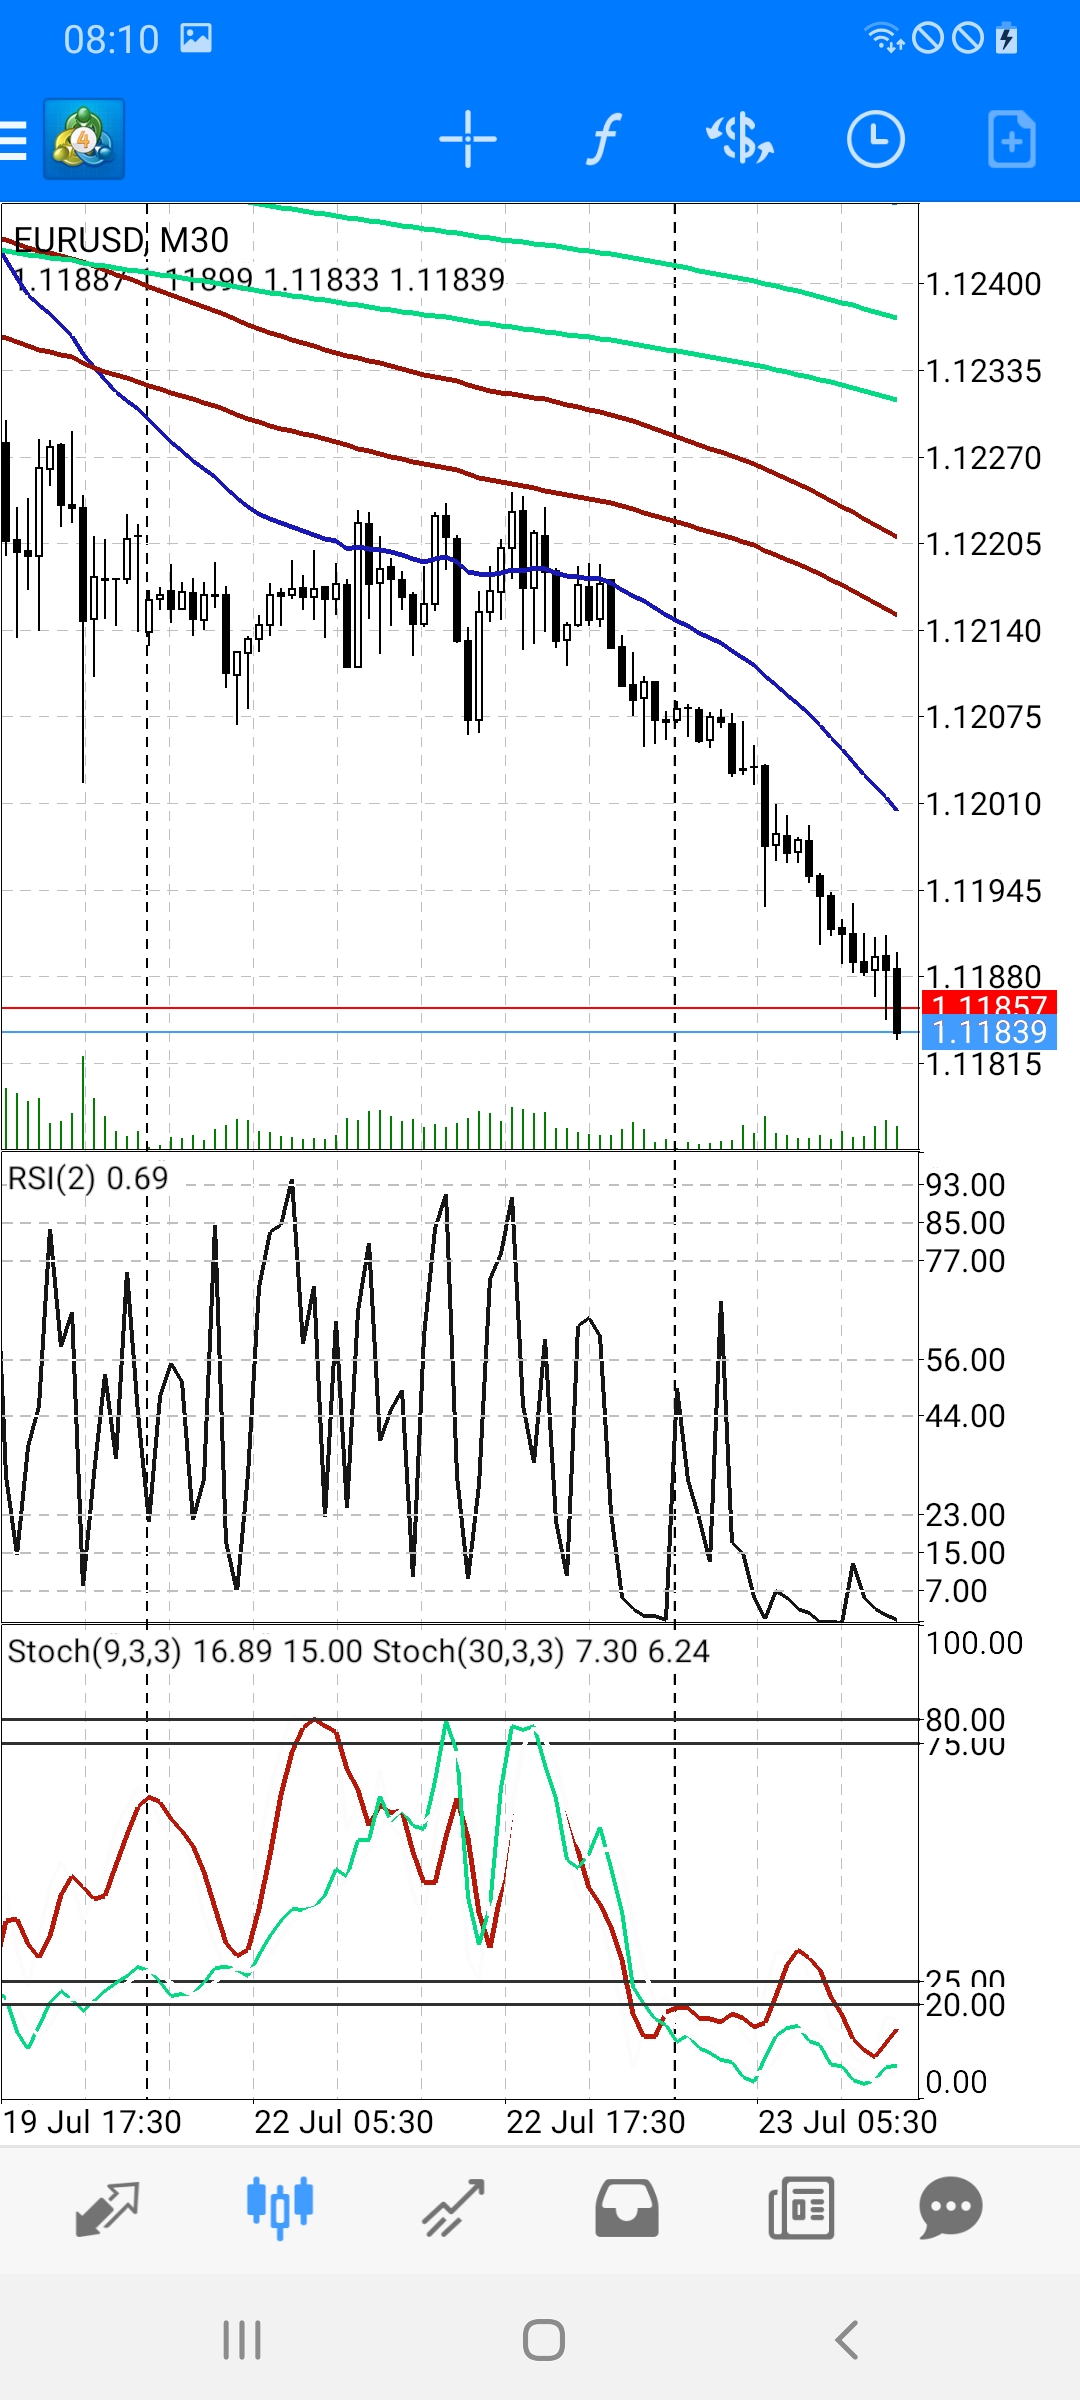
Volume is much more usable on a cell phone screen. The spike on the left did not reverse the price for good.
Keep an eye out for flags
Continuation patterns can keep you on the right side of the trade.
The last wave can go on forever, so if you see a 30-m doji printing after a 9-sample separation from the water line, you better go back in until a new higher high/lower low with a 4H exhaustion and look for a 30-minute red tail (which tends to appear in Bear Zone 1 / Bull Zone 1).
4H on the rampage check list
Is the 4h energy exhausted? (CI 7 sample < 37)
Have we seen a red tail? (2-4 sample 30-min burn – 3 sample mostly)
Have the Infantry (30 min) put up fights 3 consecutive times (RSI2 divergences)?
Has there been a 40-sample (30 min) lower low / higher high?
Has the daily fuel limit been reached? (3-day average ATR)
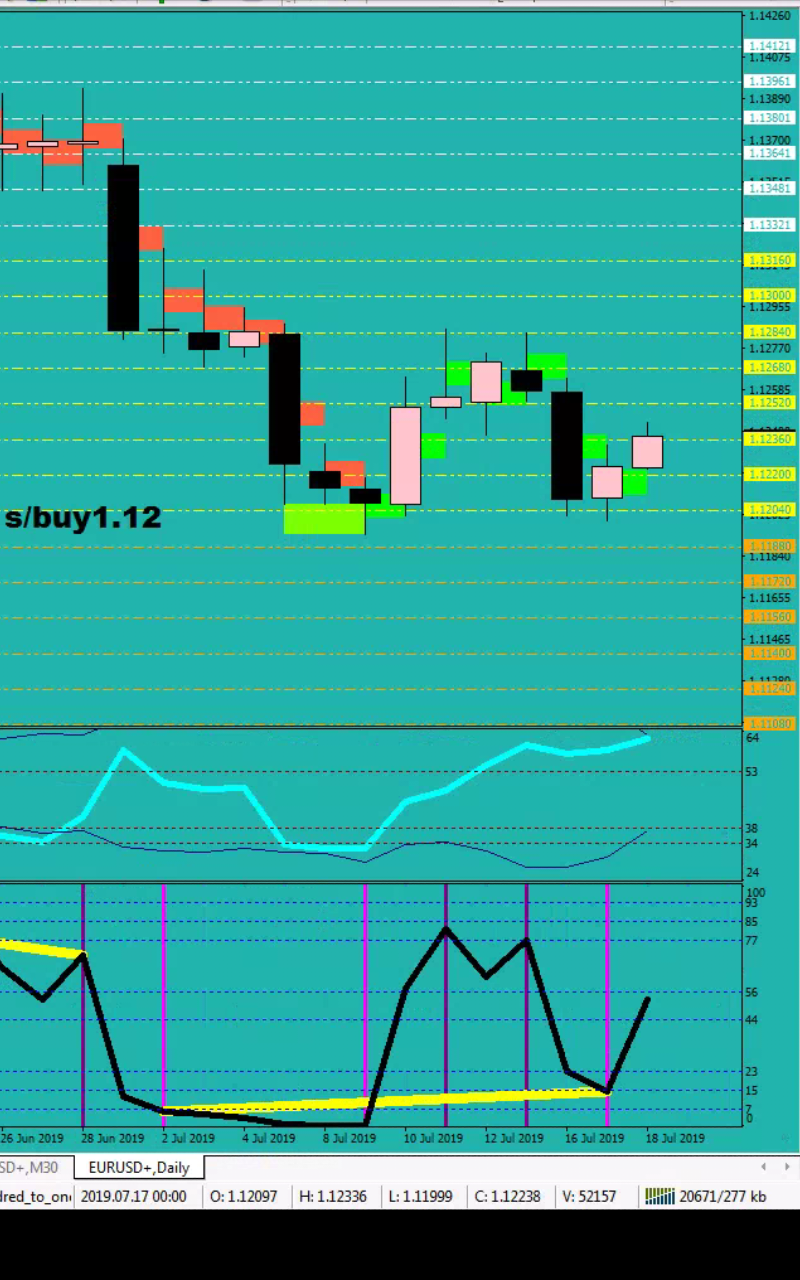
King is the will. The King has found a solution: purchasing 1.12.
He wants to find a problem now – a problem that isn’t of marital but martial nature (external).
The Queen is the deed. The Queen defied the King by going against his will.
Your bet should be that the Queen would get her way against anything the King does. Her way is the high way, the divergent way. They reconciled ultimately after the last fight, and now they are both looking forward to what lies (up) ahead.
Yet, there is also the Infantry. They can rebel, there might be an upheaval, and with their numbers they can overpower even the Queen by the Peasants building a fortress out of divergences.
Now the Peasants are fed up with marching and started building their strong hold by the bank of the Green River.
They are weary, in a rebellious mood and want to utilize the spark zone between Mr. Maroon and the Green River to make a statement.
One possible outcome is to win the sympathy of the Queen and with her will, they can take the King on another ride. For this, a divergent higher high would be needed from the Queen for a consent.
The other possibility is to let the Peasants have their own way and show what they can do for a bit, until the Queen manages to raise a new army where she found supporters before to eradicate all progress made by the Rebellious Infantry.
The third possibility is that the Queen manages to push back the stronghold to where she herself defied the King before. Although she is made of a female, this irrational deed would be the least likely outcome, for the memory of that fight may turn the King out, and this would not be a risk worth taking.
A little literature light here for a closure.
Kings’ Cross
A letter arrived, an ultimatum. It surprised the wise old man. I bet this is serious now – he wondered. Vi king is about to take over our property. I have to get some help – Thin king was thinking. Later he visited Wor king. “I’m busy at the moment!” – he claimed. Thin king went on. Wal king wasn’t at home. He only left a message: sorry for not being here, I’ll be back sometime, I may be in the garden. What could Thin king do? He went to the garden too. He didn’t find Wal king, but a boy who was juggling with apples. “Hi there, I’m Star king, the son of Jonathan the third – he introduced himself. – Want a bite?” He explained that though he had never left the apple garden, he was willing to help defend the property, and so he signed up. Meanwhile Vi king got help from the mighty becoming experienced veteran, Attac king. Things were more serious. Thin king and Star king sought for more potential help. When they met Duc king, “I have to take diving lessons today…” – he excused himself and disappeared under the waterline. Smo king signed up himself. “I don’t know if my lungs will hold on, but I’m willing to help.” “We’ll fight!” Said the three, and so they declared war. It turned out to be bloody, and lasting. Though Wa king sent them a message right after he’d gotten up, he never arrived. Smo king died by senile decay. Thin king followed him: he died of old age. Star king could barely hold on himself, but certain sounds just in time brought him hope. The noisy Knoc king arrived accompanied by Hac king, who had just arrived back from the mountains and had picked up Hi king on his way back home, who was hitch-hiking by the road. So now there were four kings on the right side. “Poker!” – they said. And so they won. The happy ending of the story is the party the Queen of Hearts gave them, as her personal gift for defending the property. But the last dance was given away – how sad – to Roc king.