You are not a human being, are you – asked my coworker from me today.
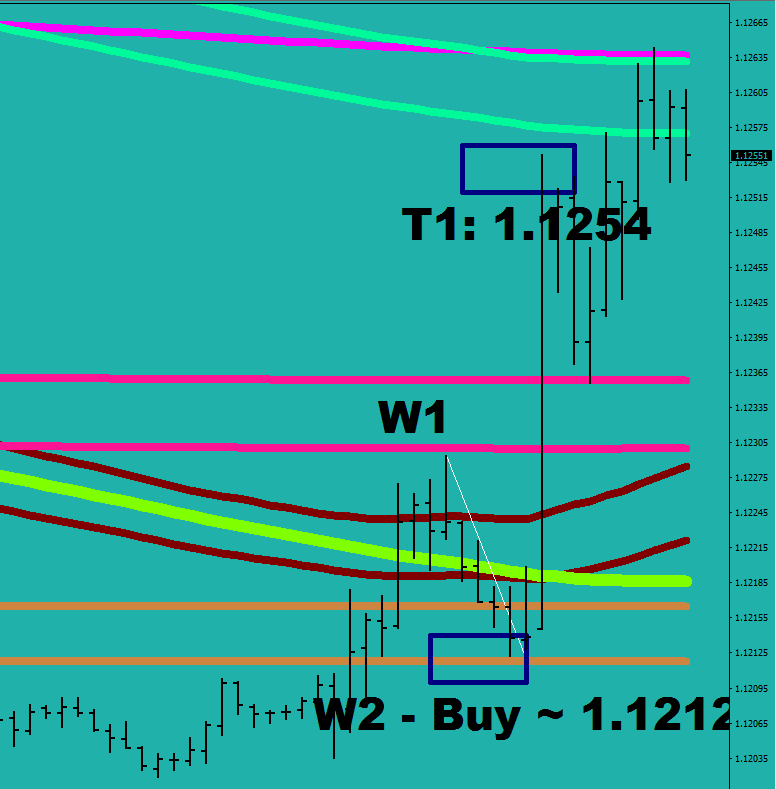
No, but I know how to double an account in under 30 minutes – was my response.
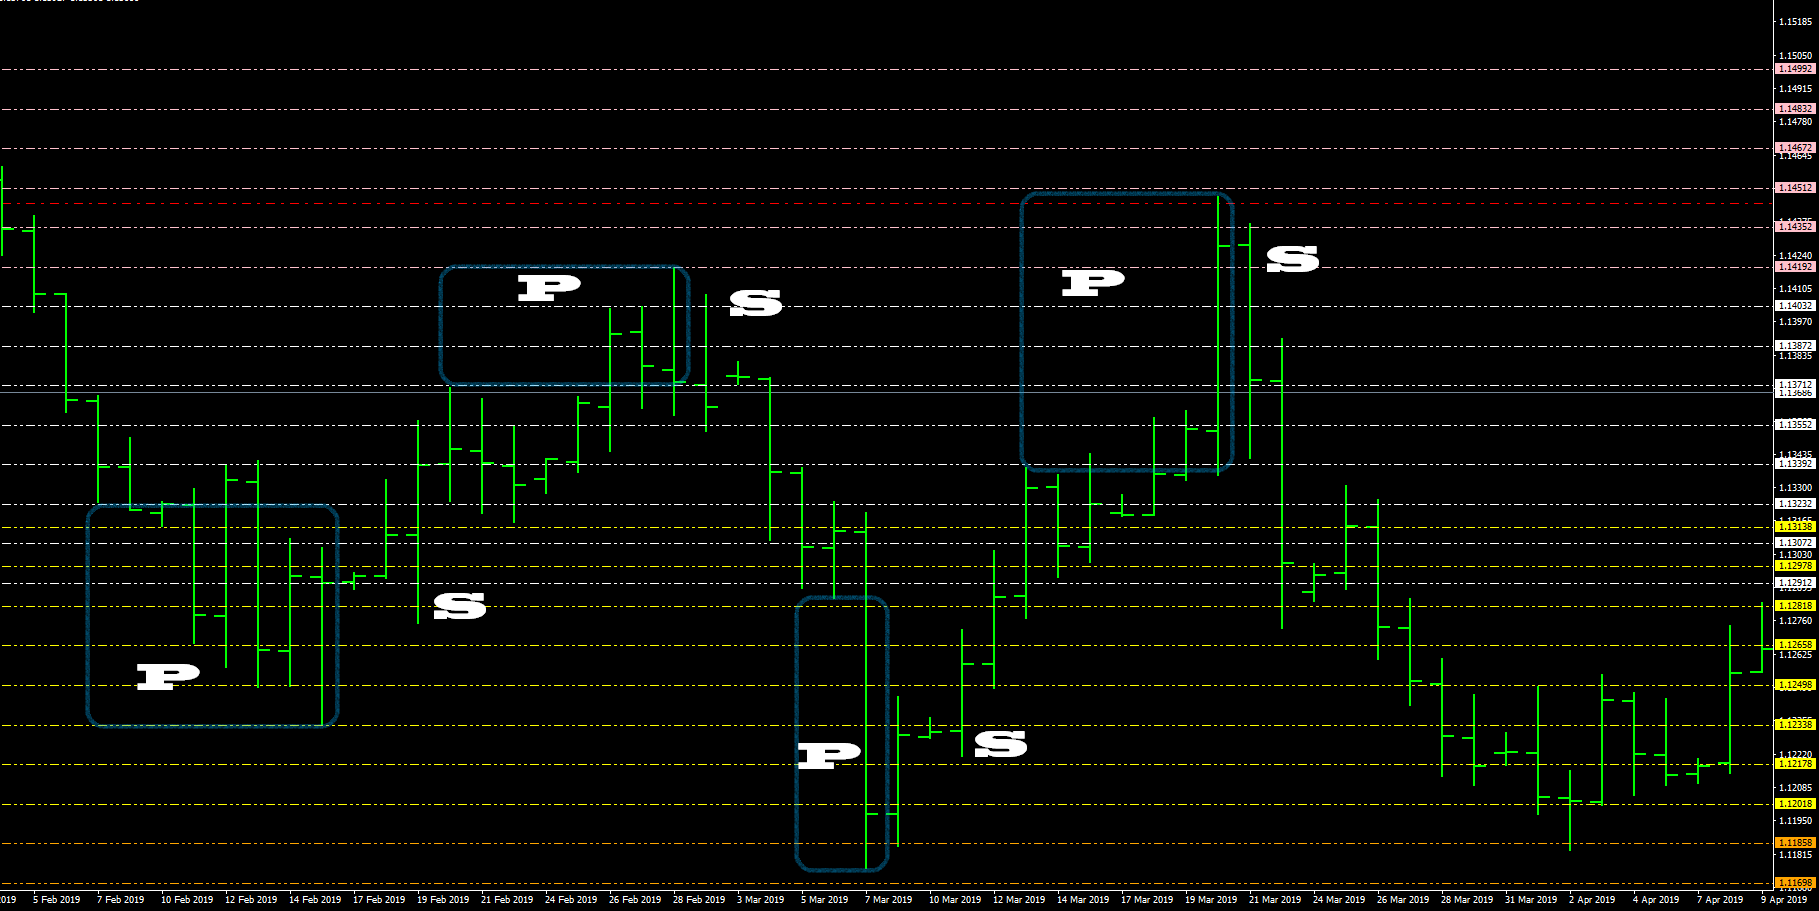
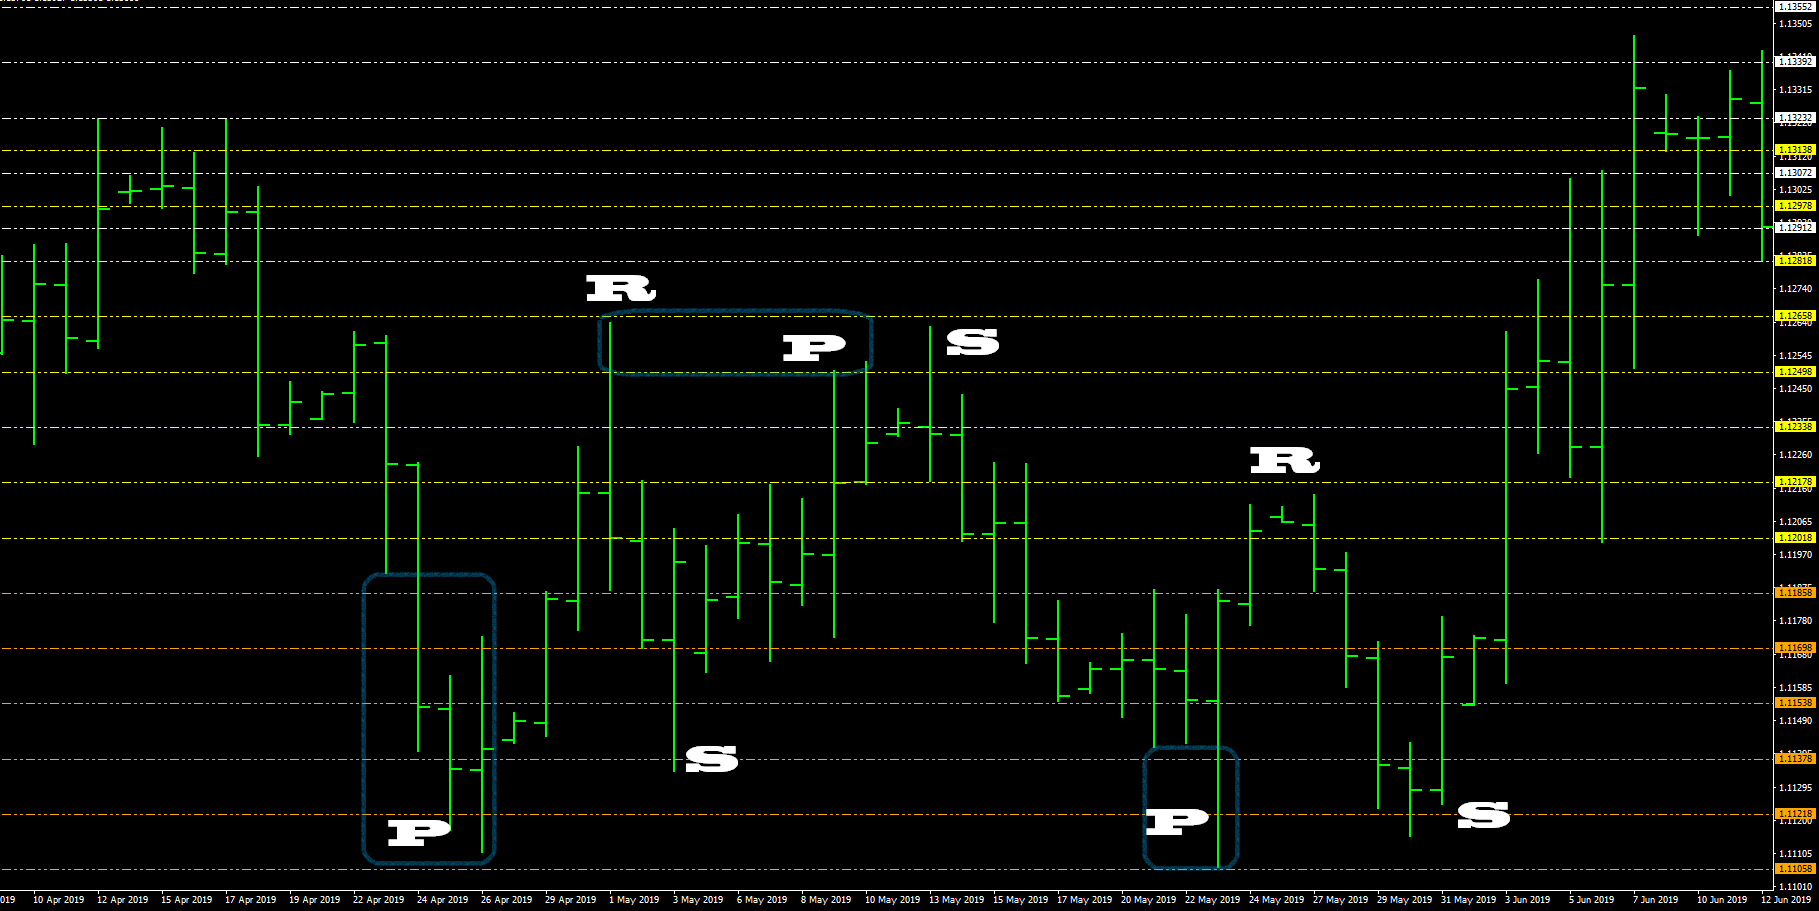
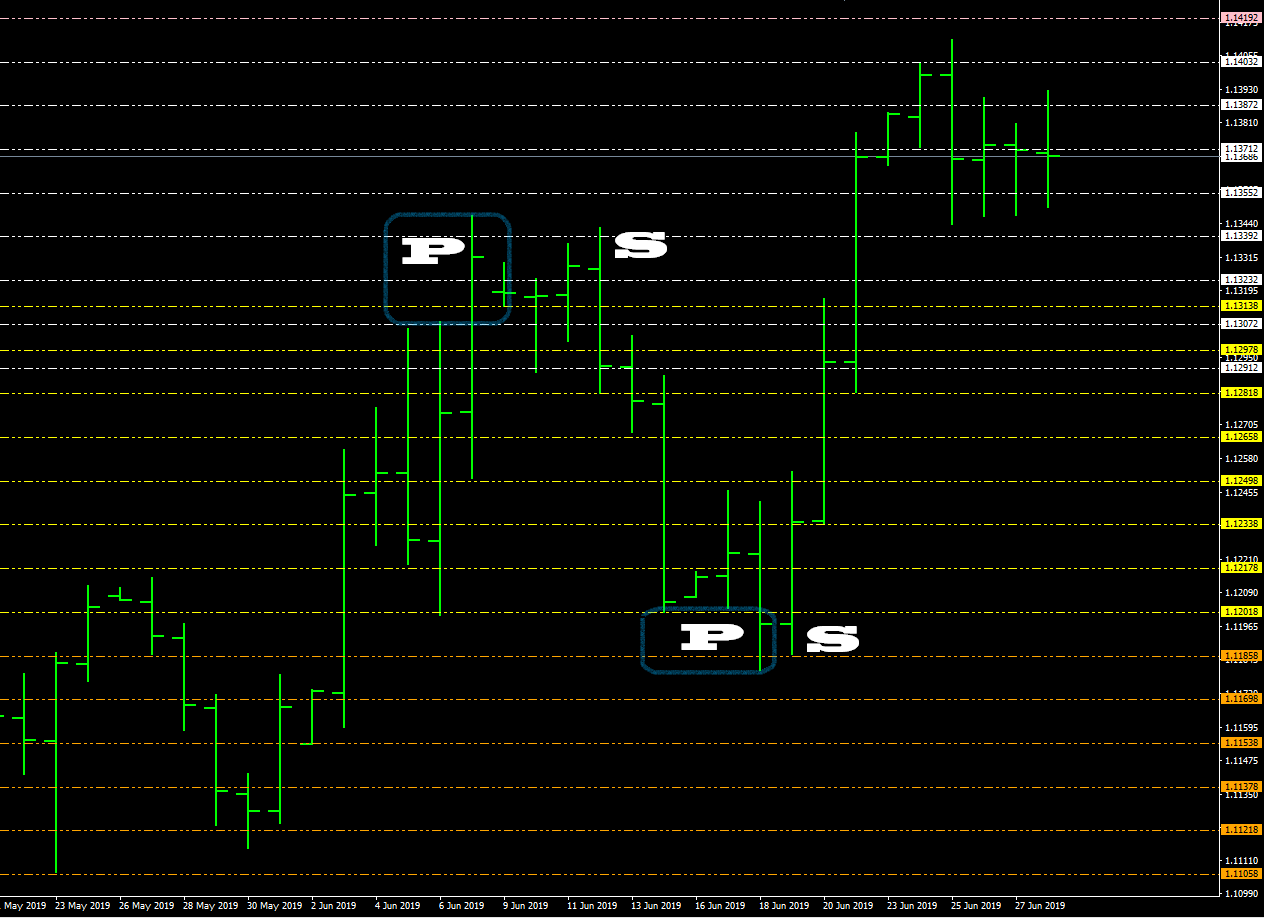
The Wave 2 finder is a real thing, I coded it this evening. It kind of gives unfair advantages to the holder of the routine, and so the Power Trading competition becomes almost meaningless with this dope.
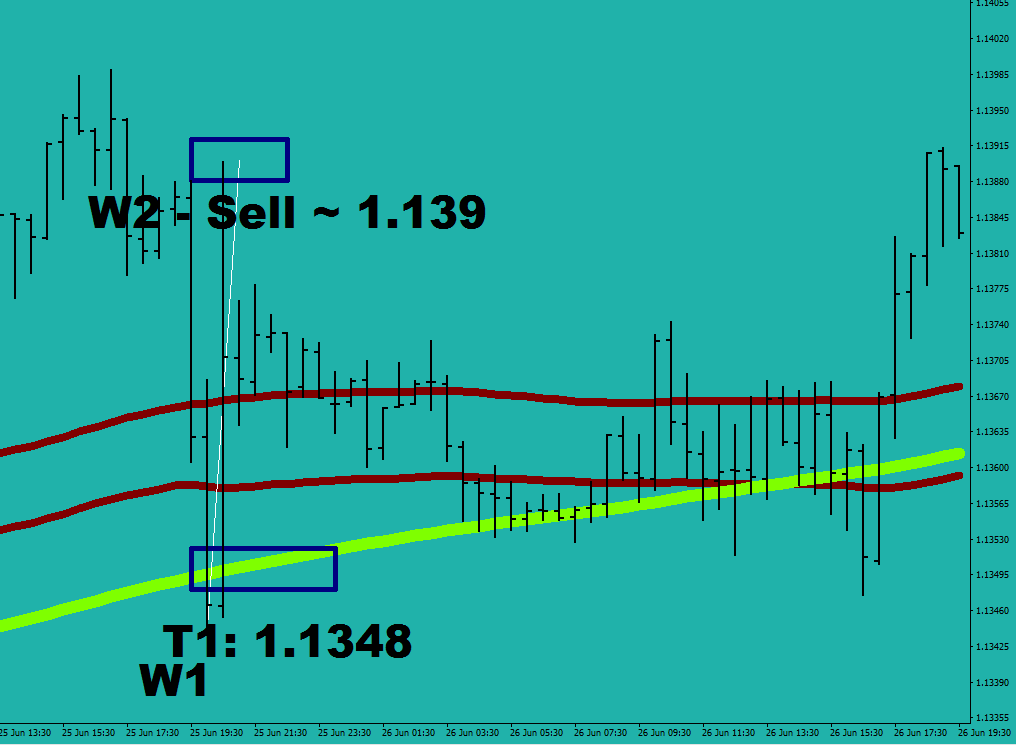
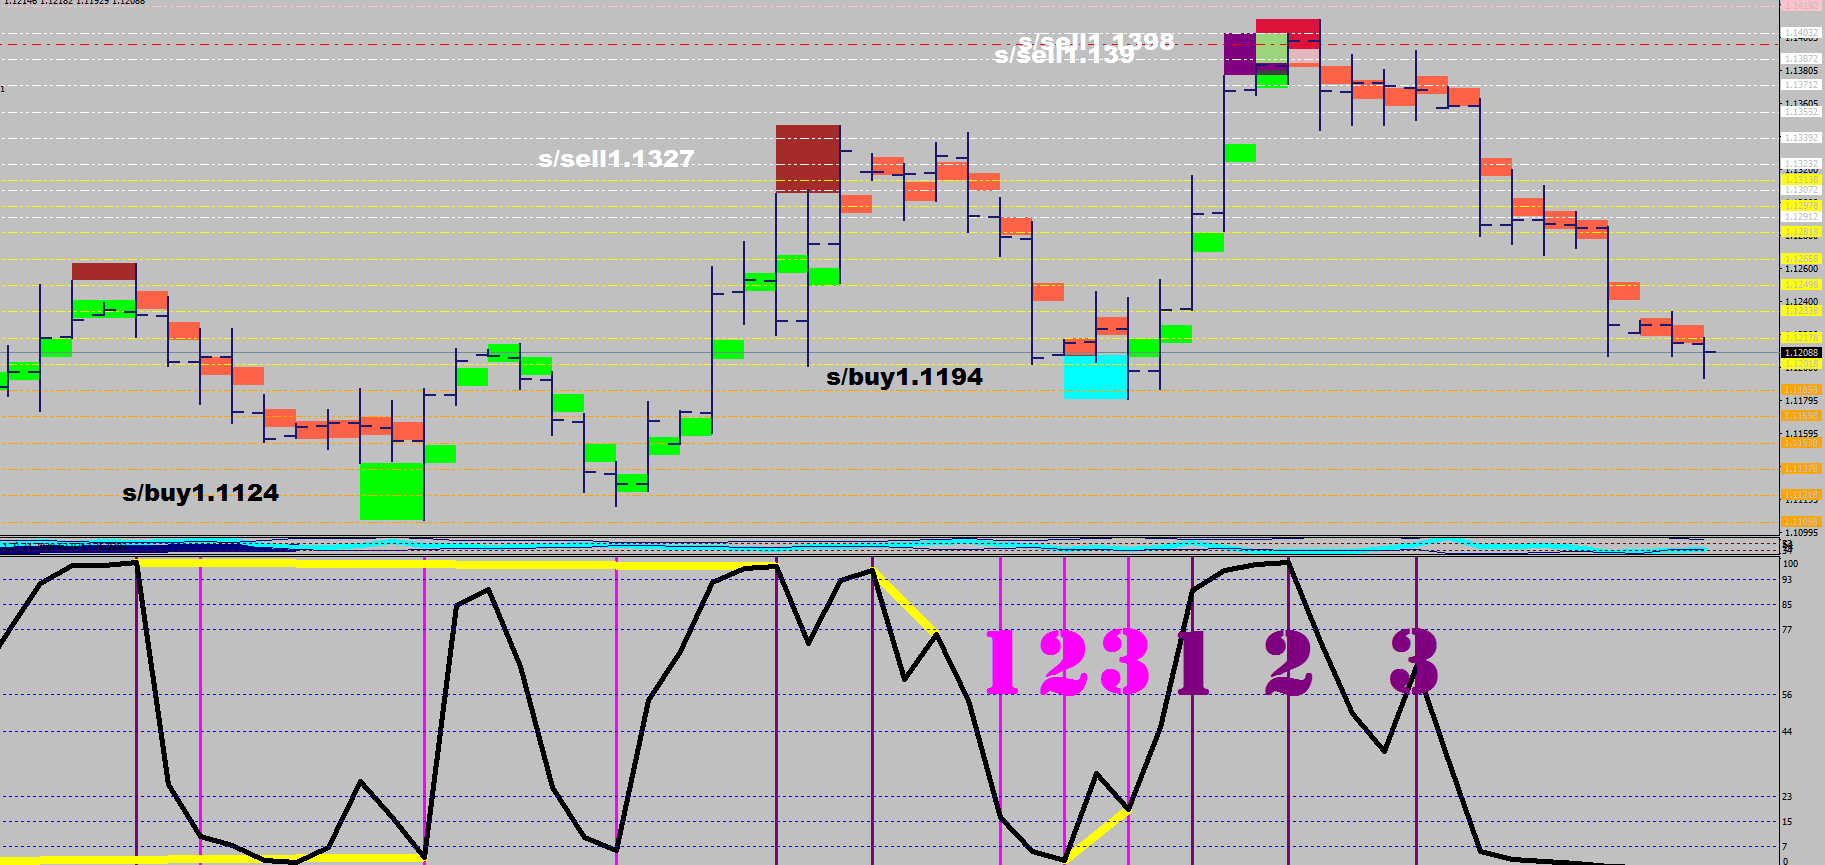
If you burden up a 1:500 leveraged account until the margin level dips just below 200, it is guaranteed that you are going to double the account on the upcoming 40+ guaranteed pips.
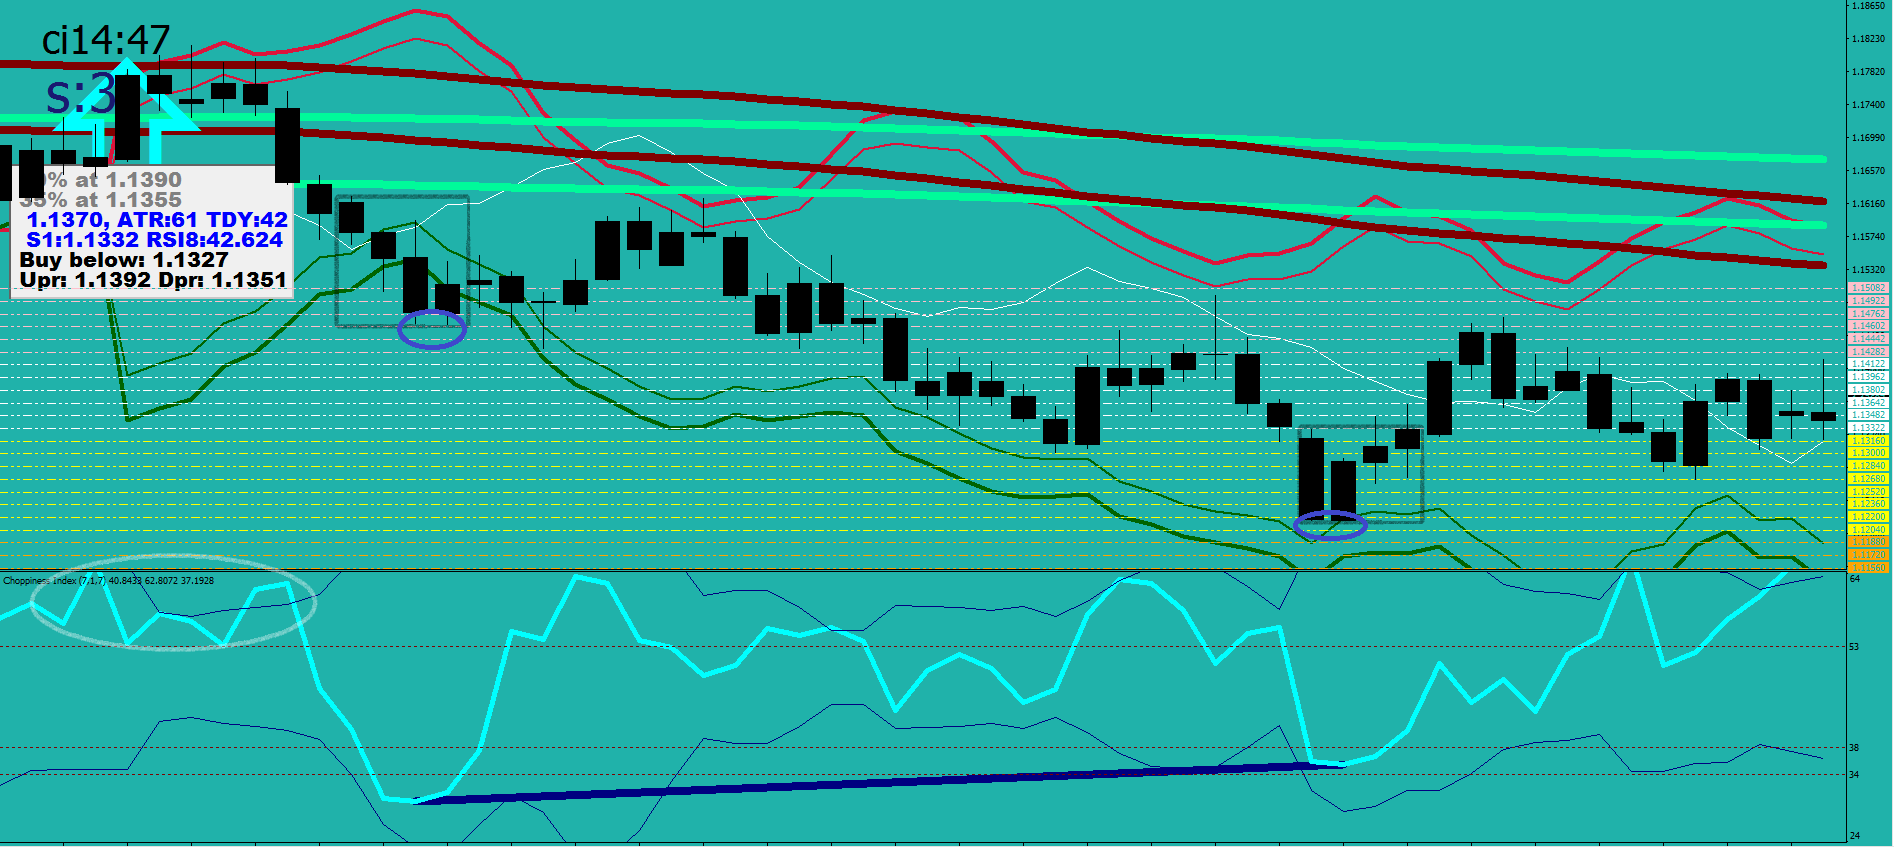
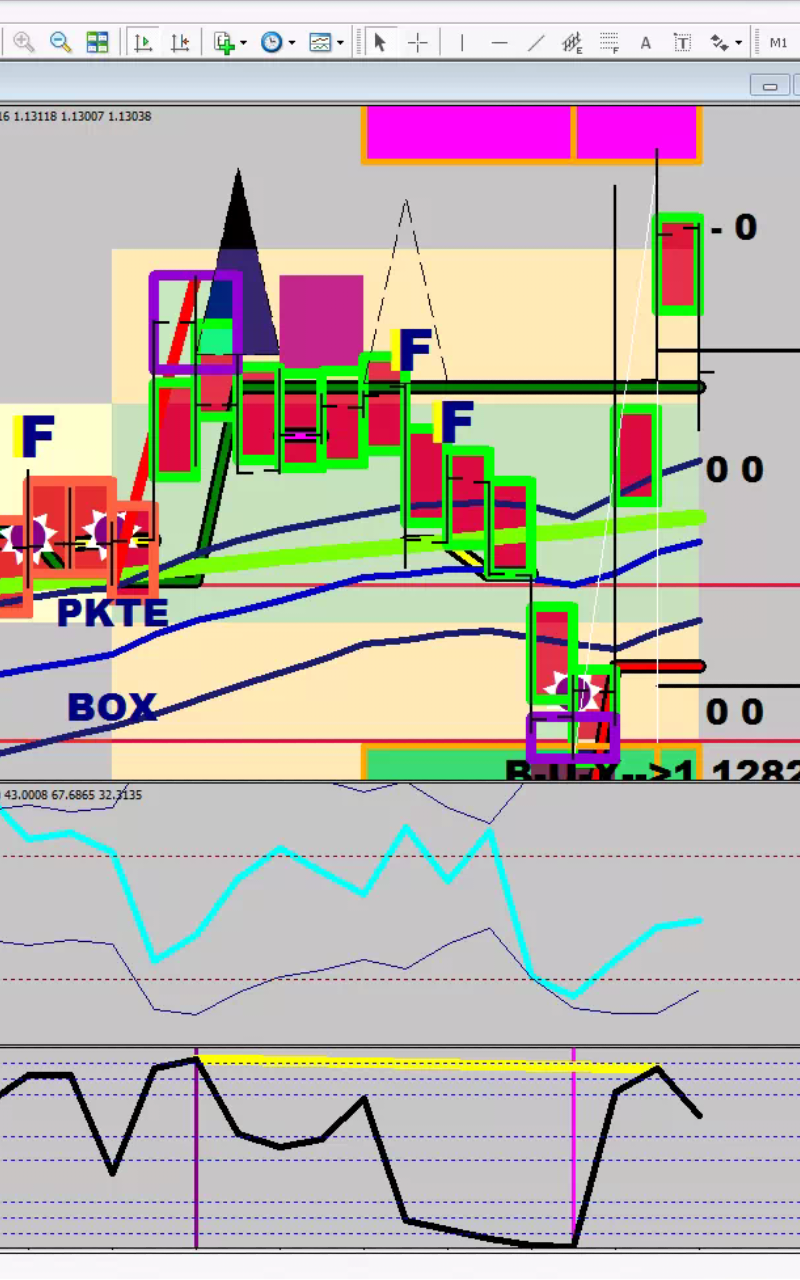
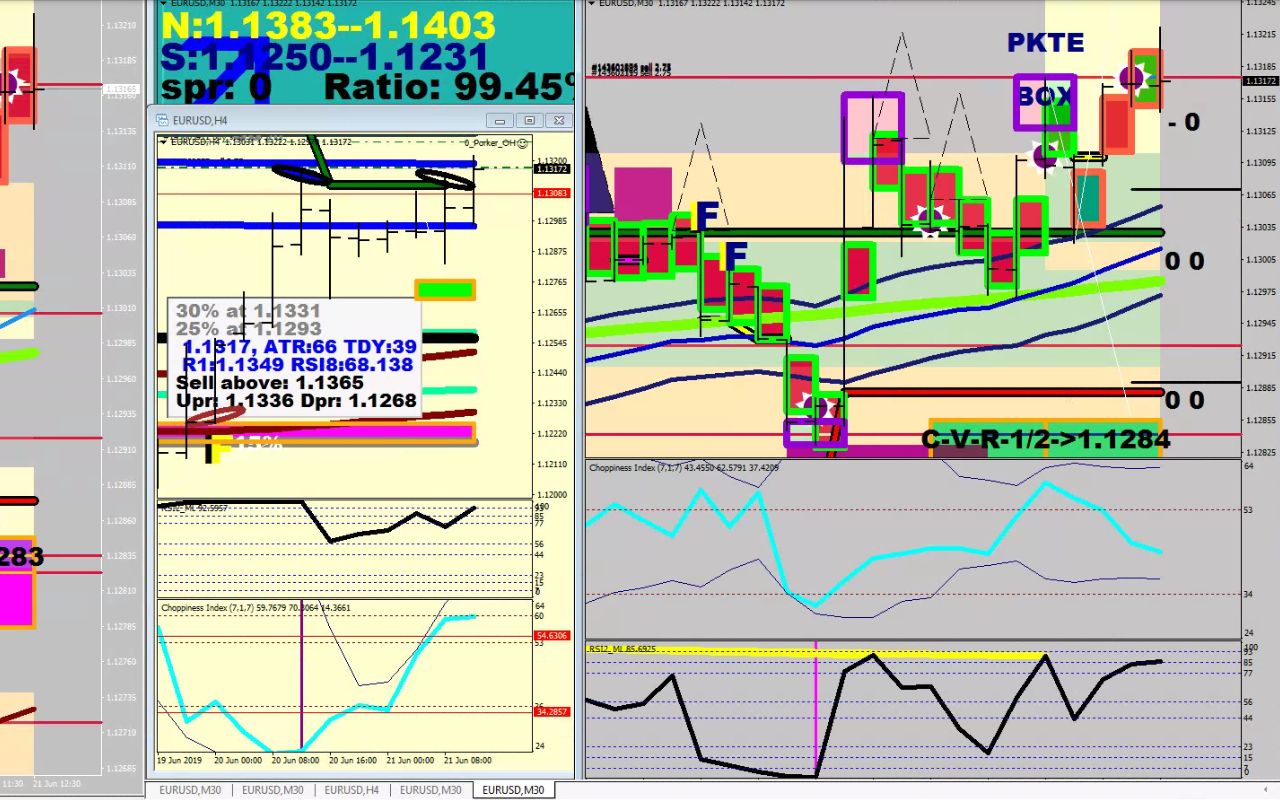
As the first example shows, this may not take a full hour.
Reminds me of some broker making up some Asian name to claim that one of their client made 27% that month.
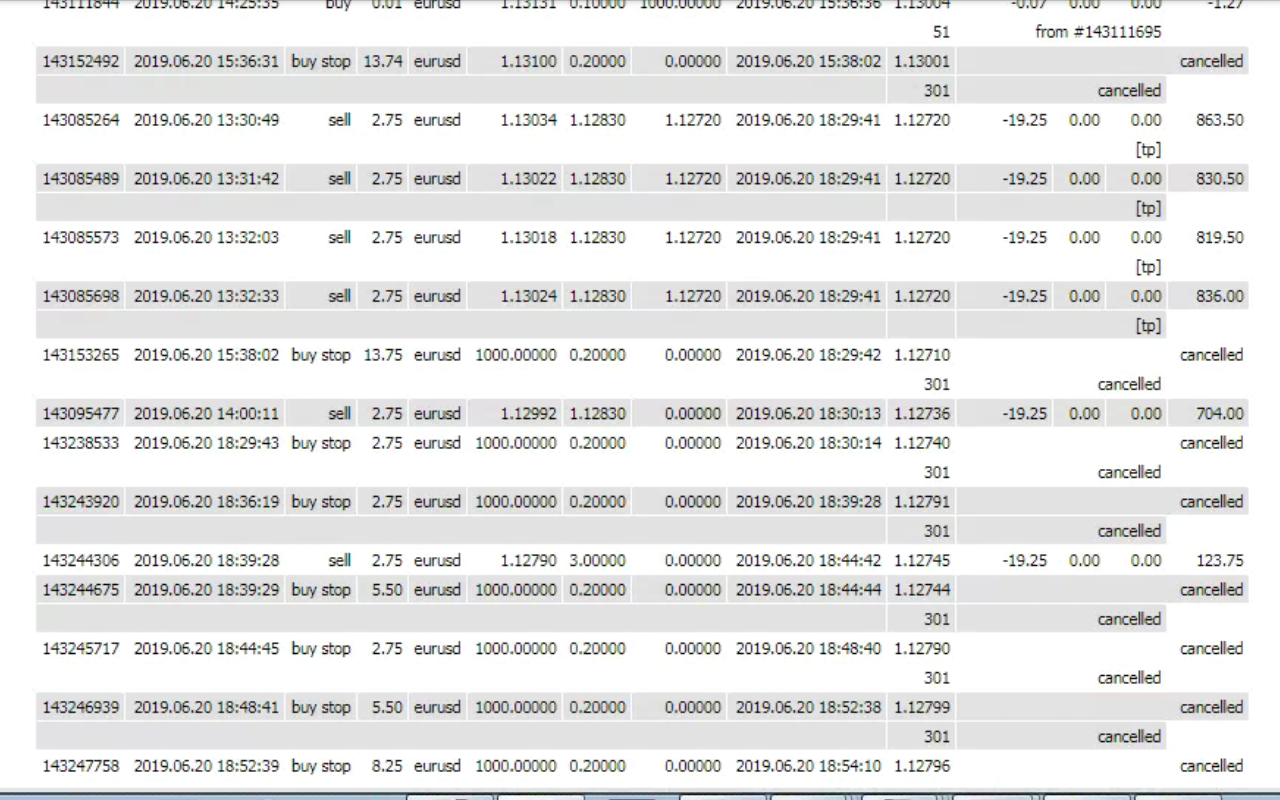
These two trades, namely the one on the 25th of June and the one on the 10th of July would had yielded you 100% twice, a total of 300% compounded gains in 15 days, with a total of 20+1 hours of holding time. Do compare.
You may officially refer to me as Mr. Wave 2 effective today.
Trading is an ability to count to two… and sometimes to three.
You do not need artificial intelligence for this.
But there is a field for AI, and that field is probability derived from statistics and projection of possible outcomes.
AI could chip in by licking through lots and lots of data and bringing your accuracy up by not only saying buy here and don’t buy here, but would be able to associate a percentage of probability to this strike being a buyable 2 or that strike being a rather pass on two. AI ultimately could make predictions based on similar sequences and how they played out in the past.
Although all disclaimers always make an effort in discrediting what transpired, the only way forward is to remember every little thing, every combination that has happened. Being a human clearly isn’t enough to do this.
Plotting a grid of 1/2 fluctuation sized steps can yield the idea of halftime drums, or DubStep hedging.
You open a position with the utmost consideration for being in accordance, in harmony with the direction of progression.
Yet, the market starts moving against your holding, what should you do?
know the instrument = be conscious of the fluctuation size
do nothing until 1/4 of fluctuation size pressure from your open plus a little slack
open a hedge that is 25% greater than the position to be hedged with the following conditions: a) have a target for the hedge position at 68.75% of 1/4 fluctuation size b) get your strictest trail stop involved with the right launch codes to protect any gains made by the hedge-trade c) repeat the same thing for 10, 1/2 fluctuation size steps out
there should be a target setting logic in place that would adopt to motion in the opposite direction, meaning, it would not always just aim further out, but could retract as long as it is still happening in gains
The size increase is to make up for some lost ground between the steps.
This hedge-trade may be called in multiple times, each time yielding you something.
The whole manouver would only make sense on an ECN, low raw spread account where the commission is not very high and high leverage is always a handy thing.
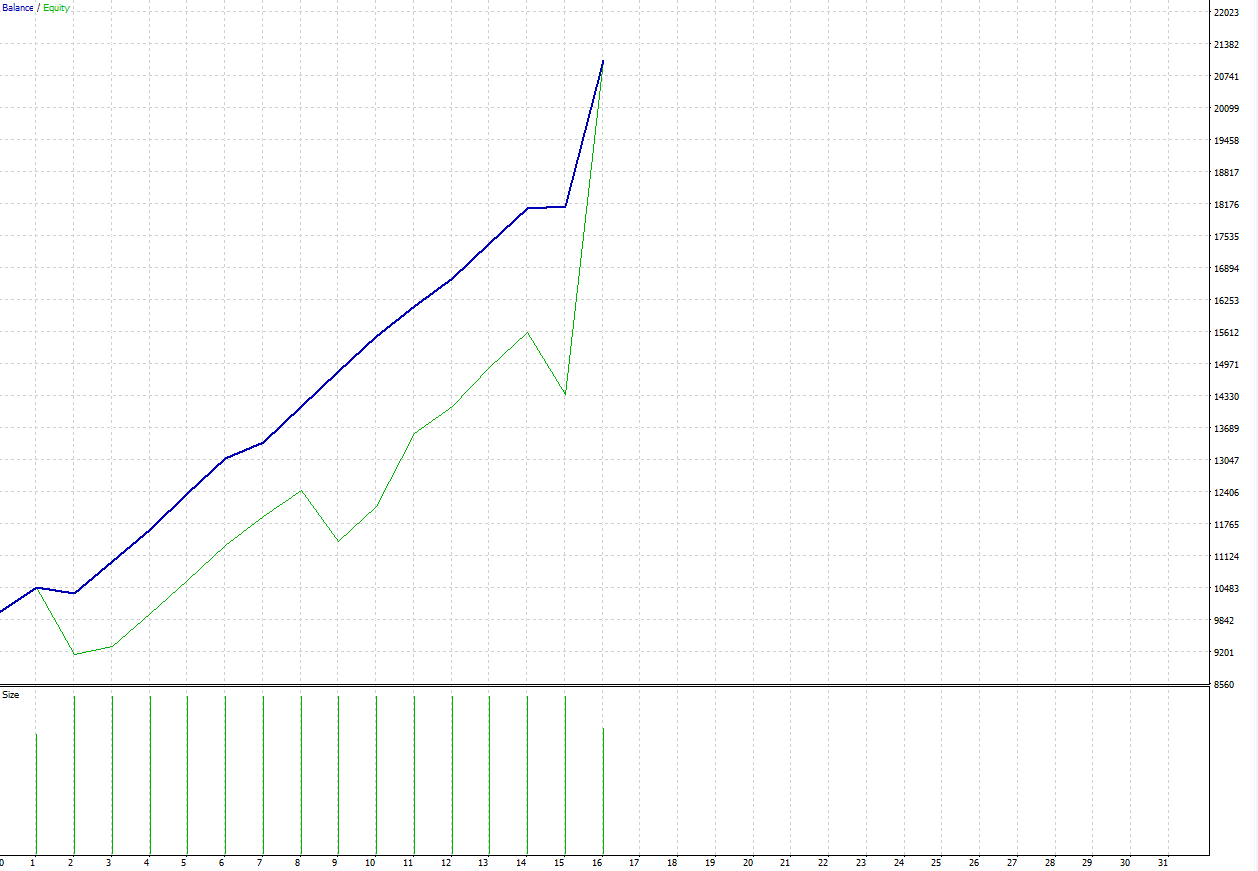
How does it look like?
The green equity line separating from the blue balance line shows the presence of a hedge-trade. When the green gains on the blue, a hedge-trade gets closed out. At the meeting point the account has no open positions.
What is so great about this type of hedging? That it takes a back seat, it only steps in when something is really off, and it puts on a fight for a good size section, going into war as many times as needed be.
Remember that hedges can give you relief, but may ultimately become an over sized counter weight that can sink your ship, this is why my current thinking is that hedging should be precise, powerful and predictable.
What is the very first reason why you should never expect that you can simply buy an auto trading EA and that would produce money for you eternally, like they said it would?
The difference of the data among brokers.
Where is the difference coming from?
Server time difference
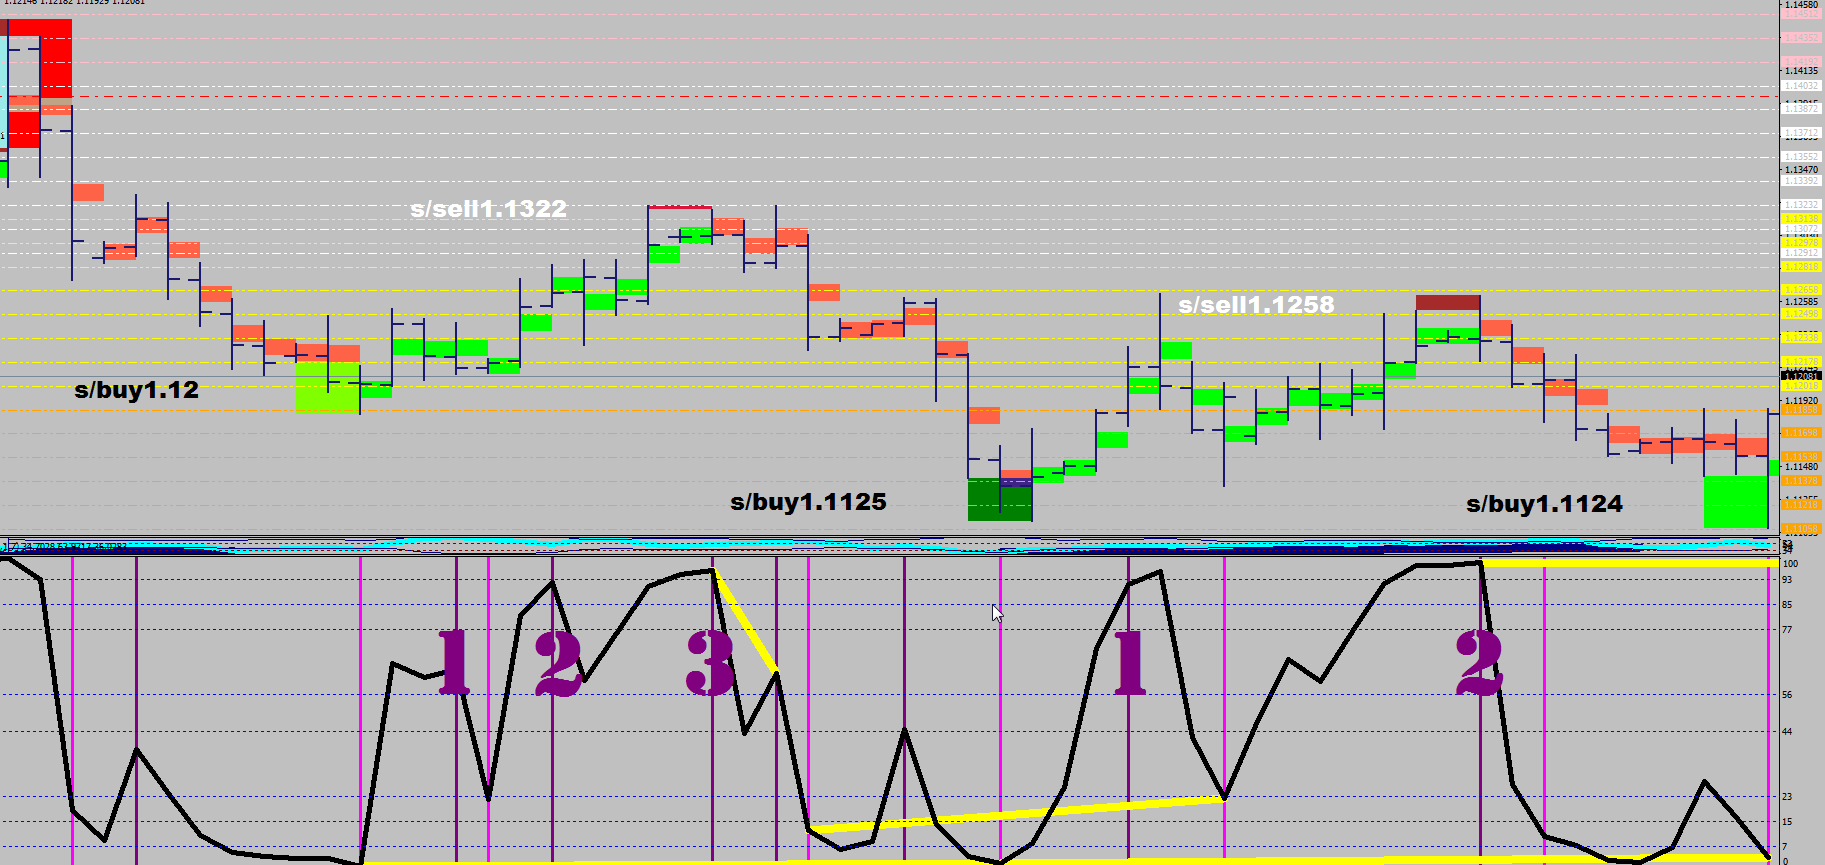
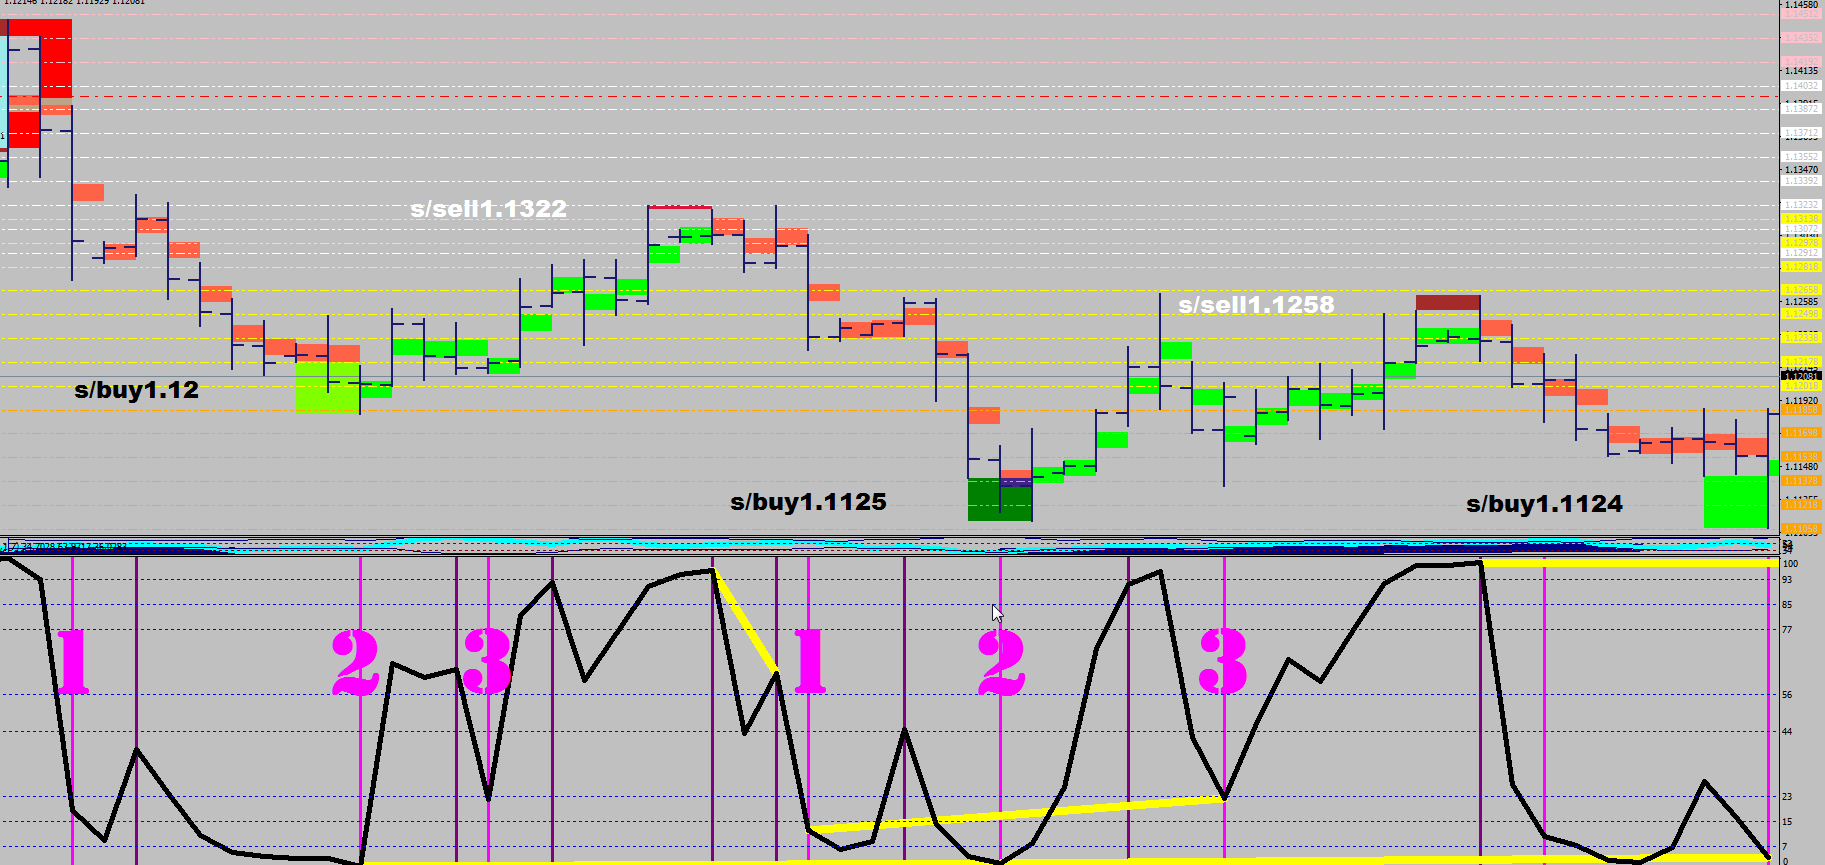
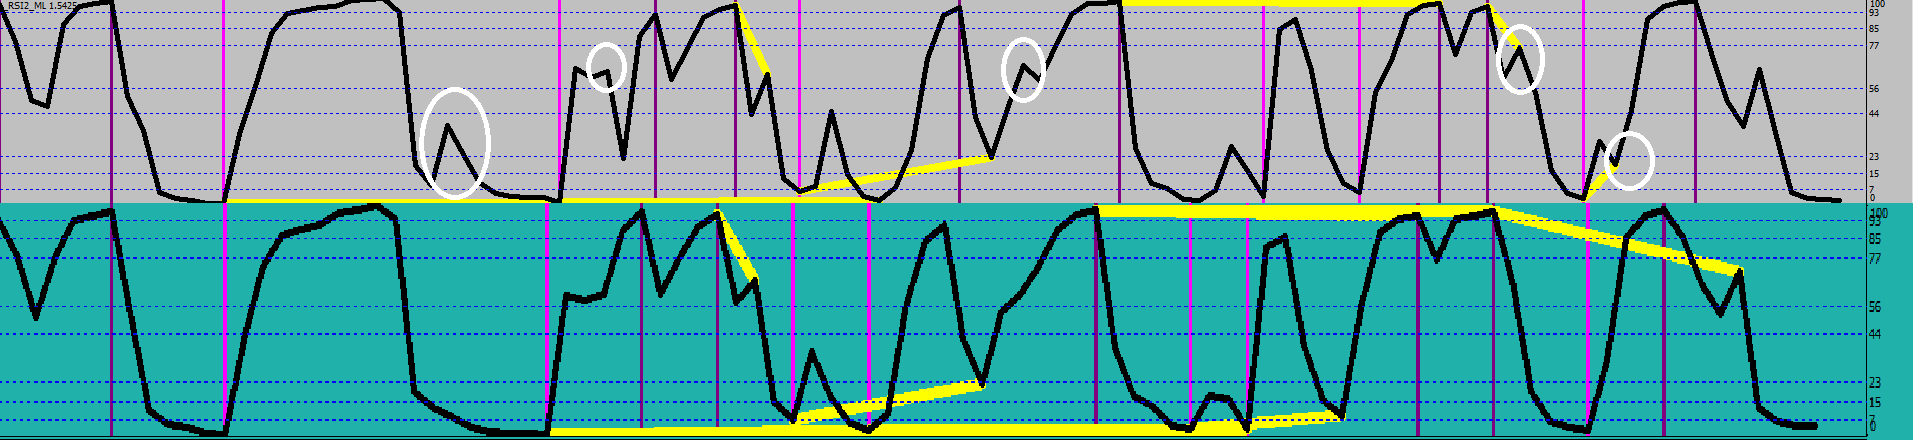
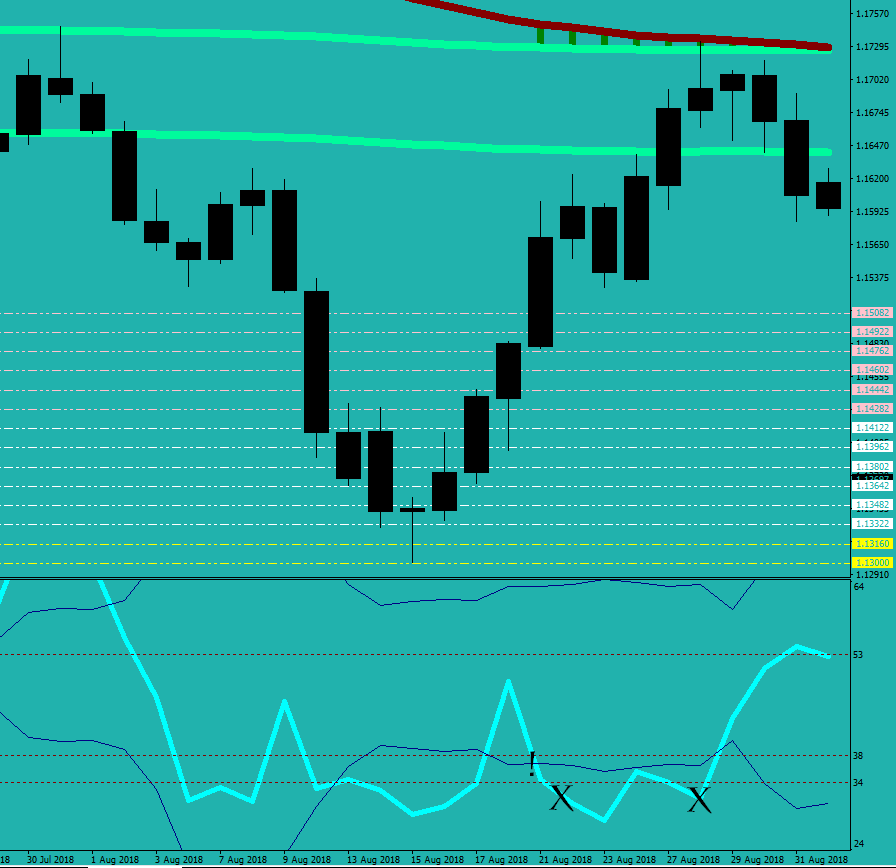
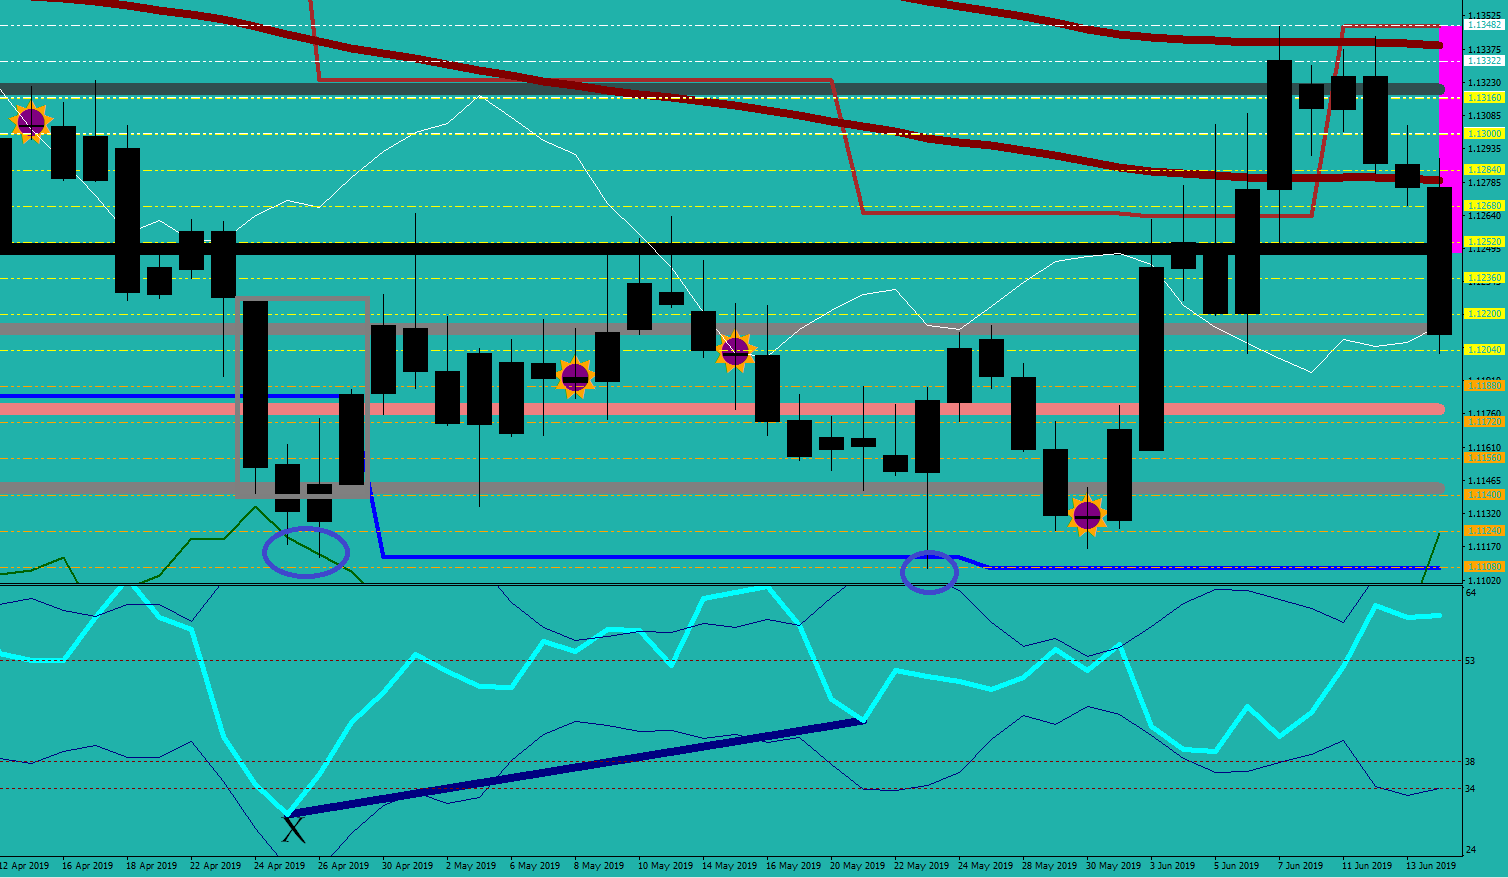
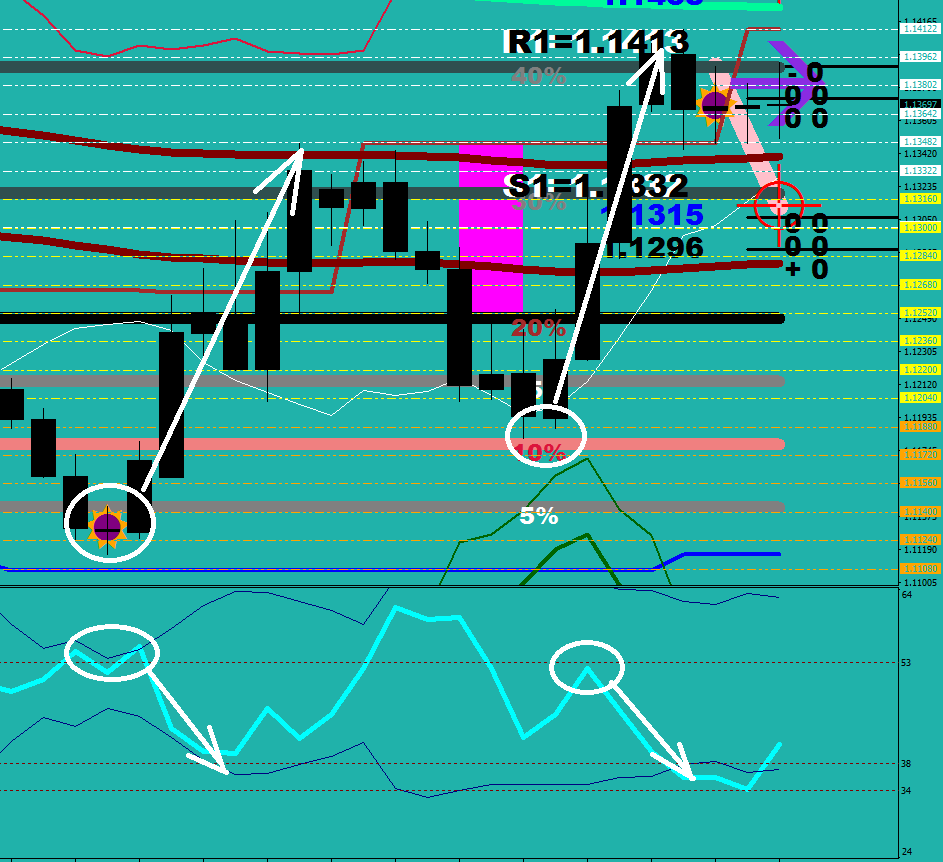
The image above shows the same iRSI(symbol,0,2,PRICE_MEDIAN,i) expression, yet the outcomes on the two different brokers are drastically different. White circles are only some high lights.
Since one broker is right on GMT +1 hour, their daily candles start at midnight, thus a week is made of exactly 5 candles.
The other broker is on GMT -1 hour, it opens 2 hours earlier, so there is a 2-hour long daily candle on Sunday and therefore the total number of candles in a week is 6.
Imagine that the automated trading routine utilizes RSI2 divergences as opening signals. The program was made with the Gray background broker – so for instance, on the first image, the last 2 white circles should result in opening positions. On yours, these events simply do not occur.
Conclusion: every value derived from daily candle groupings would be different, therefore you cannot use a different broker and expect the routine to perform the same way.
Every oscillator (not just a 2-sample size one) would end up showing different values at almost every reading. One may have the stochastic level below 18, the other at 35. One would be considered oversold while the other isn’t. I had the same routine opening a long on one account and a short on another because of such an uncertain divider.
When it comes to 4-hour candles, the differences are even more pronounced. One of these brokers started the current 4-hour print more than 3 hours ago, while the has only been under plotting for the last hour and change.
One shows a doji for the last 4-hour candle, the other – thanks to the different grouping – do not have this.
I probably don’t need to tell you in detail that a 3, 4, x sample high or low aren’t necessarily going be identical either.
Let’s only mention here vaguely that the brokers do not open and close at the same time.
If I write a scalper that cuts an EUR/USD position at 1-pip gain after reaching 4 pips in my favor (as a protection mechanism) and this would yield me 0.2-0.3 pip gains after commission and spread, while you have an 1.7 pip “fixed” spread at your broker, then the trade that gave me some profits lost you at least 0.7 pips.
The slippage values, the overnight swap, the commission are all different at every single broker.
If my broker allows for 0.2 pips slippage, then I can put out a pending order rather close, but your broker with the 2-pips slippage would deny placing the same order.
I hope you are beginning to get the sense of why trade copying cannot work either.
If my broker only cranks up the spread to 2-pips overnight, while yours pushes it beyond 4-pips, this can easily make the difference between receiving a stop out or not, or triggering a hedge position vs not.
Let’s only vaguely mention the margin calls that would be the outcome of different margin call percentage values despite of having the same leverage.
Let’s faintly mention other values such as maximum lot size, that are also unique to a broker.
So, how do you overcome all this? You can’t.
You can only develop and optimize for the broker you are trading with.
Your auto trading routine (EA) won’t behave the same way with any other broker, not even with different privileges when using the same broker.
People, you need to stop looking for substitutes and single pill fixes all solutions and invest in what I’ve been investing in: understanding how trading works – for real.
There are lessons to be had, especially on fractal energies – but since everyone seems to be out of class, and the market seems to have its own “bird” mind, we’ll talk when everyone is back at the feeding house.
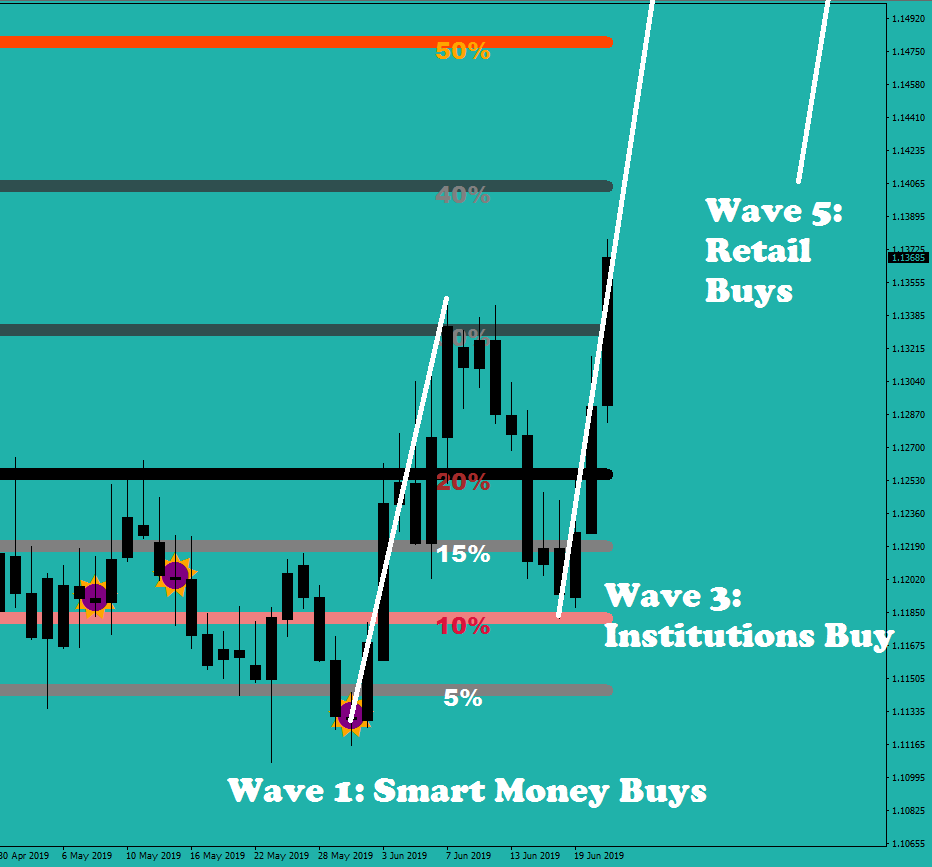
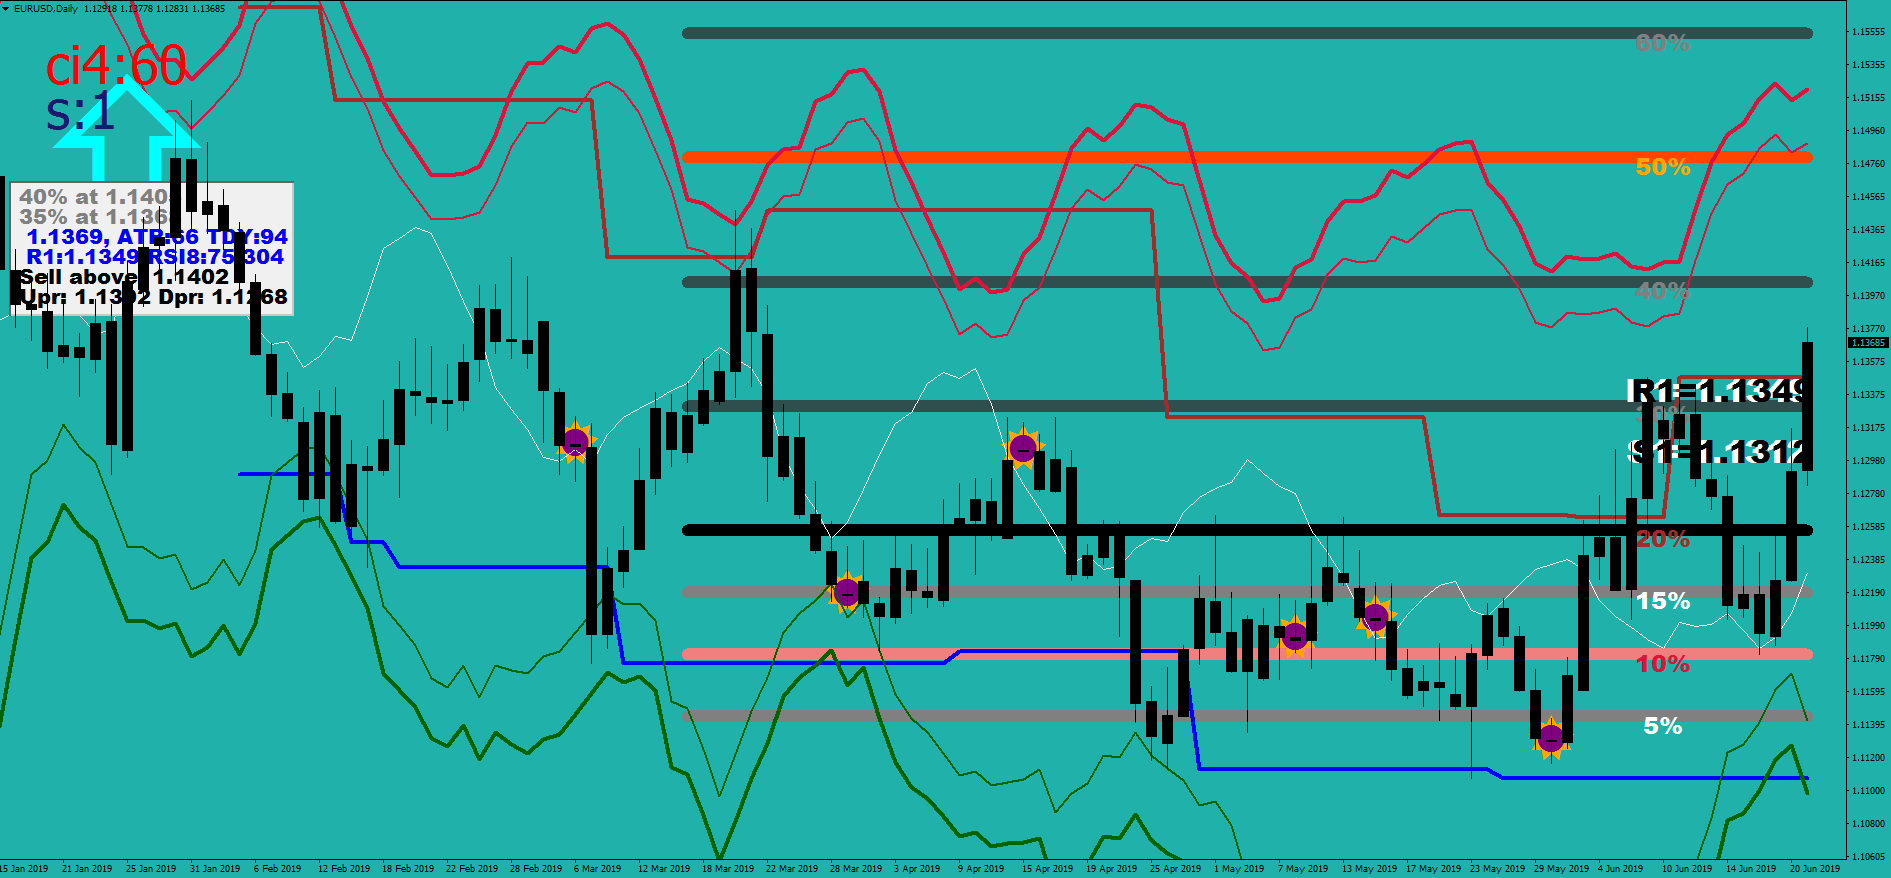
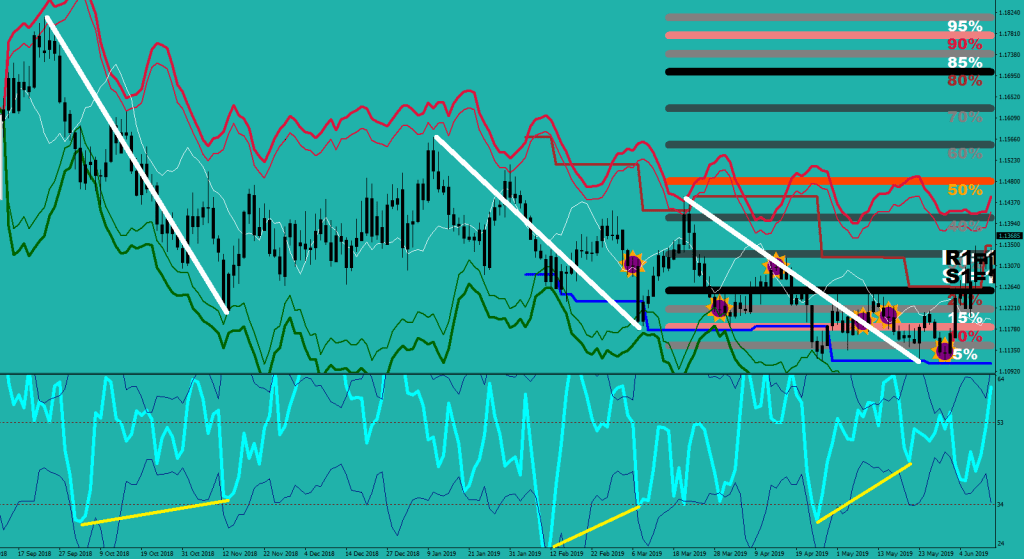
The context: institutions bought at 90% discount – refer to my article about “If You Were an Institution”.
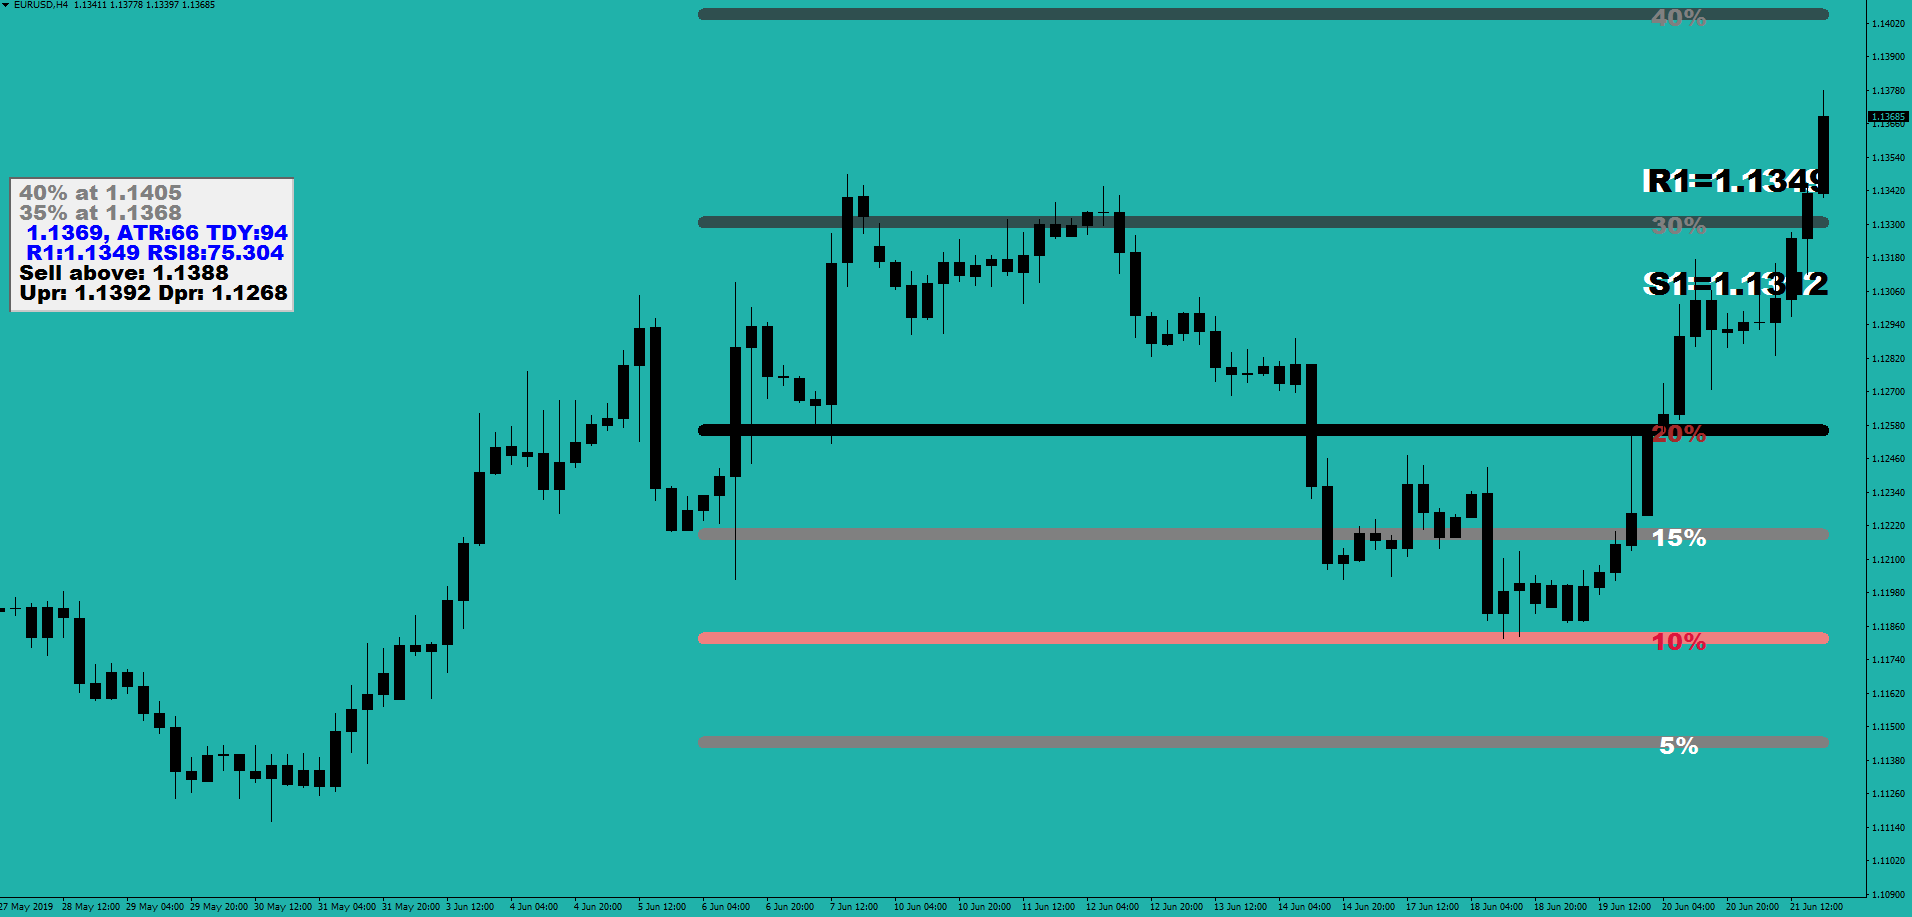
This happened after a show of strength: first price left the long term over oversold black marker.
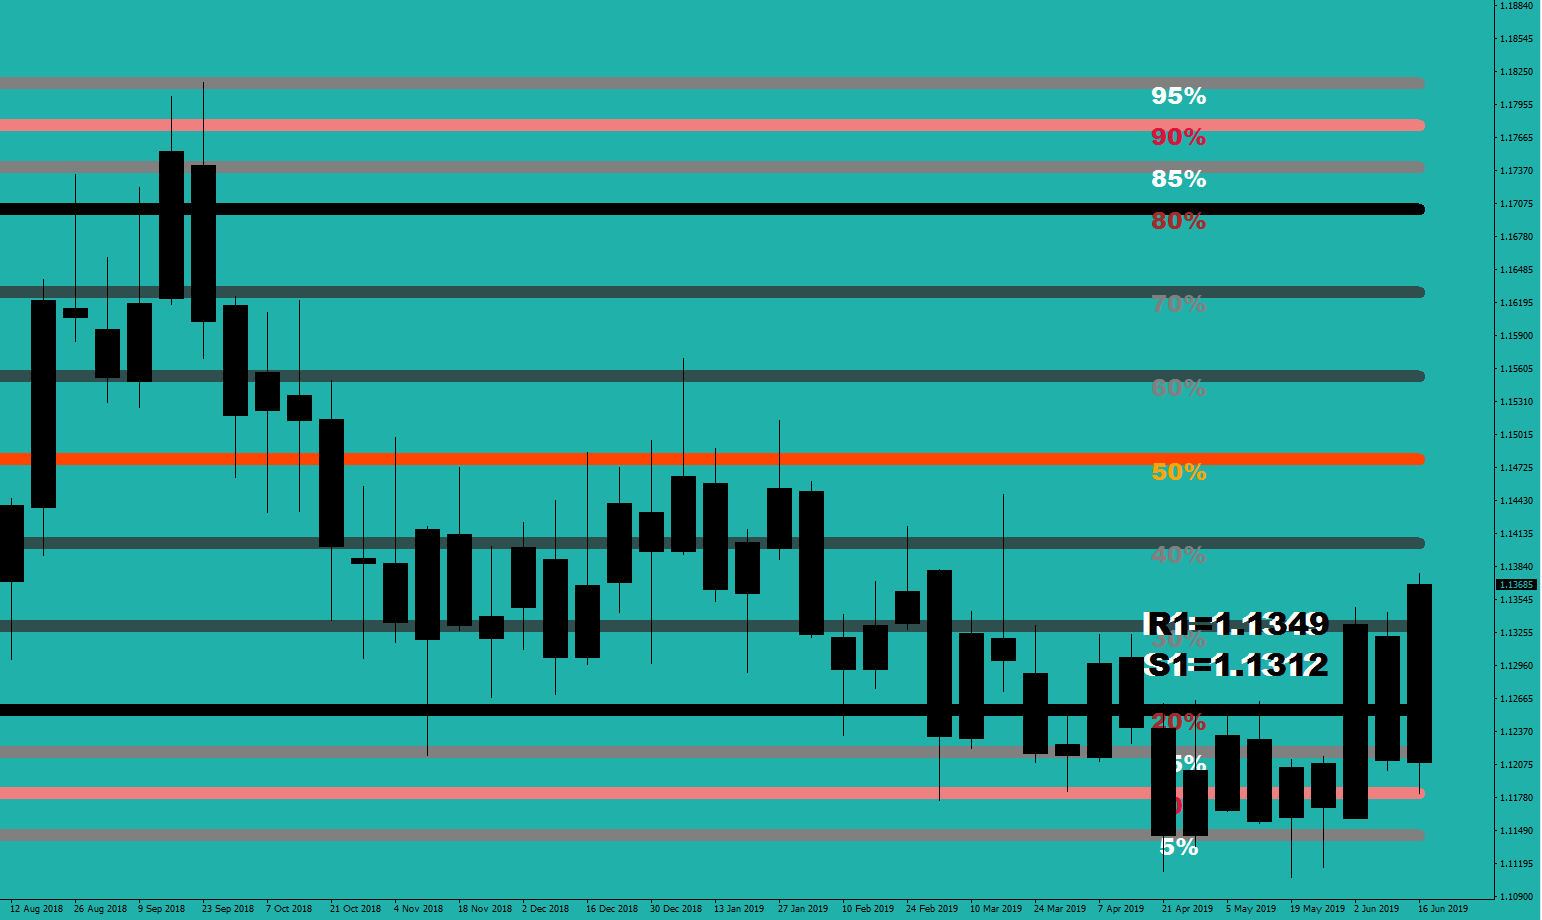
What target they have in mind is anyone’s guess, but the usual, stand out suspects are the 50% line and the 80%+ area.
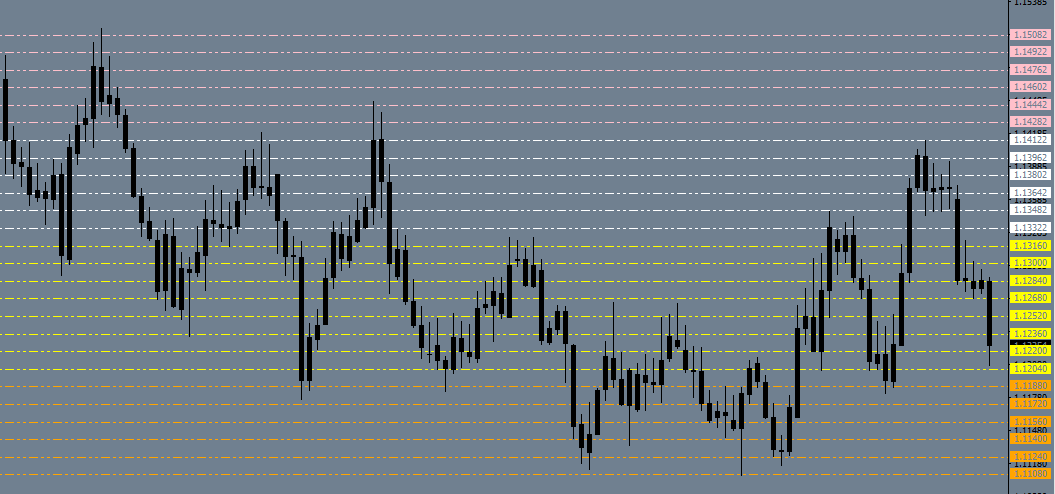
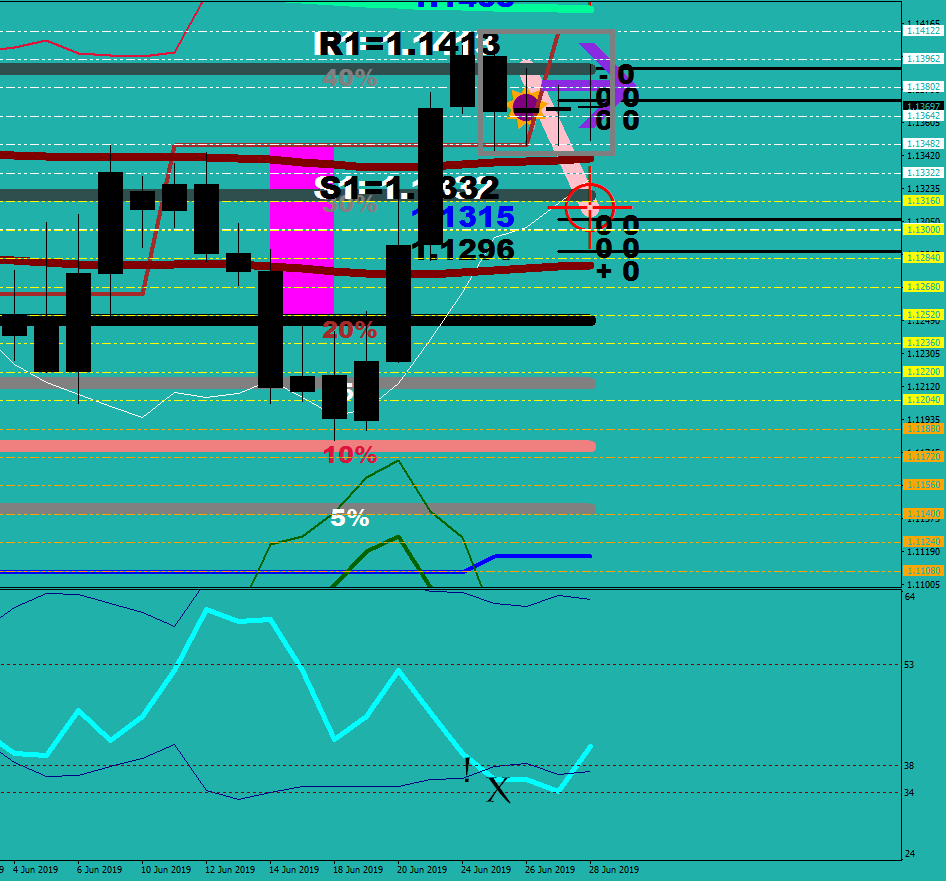
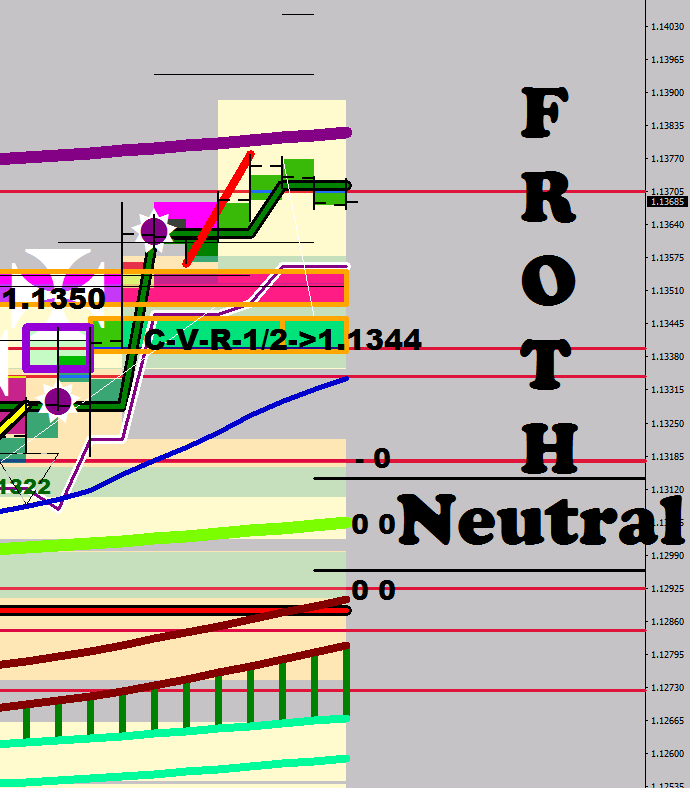
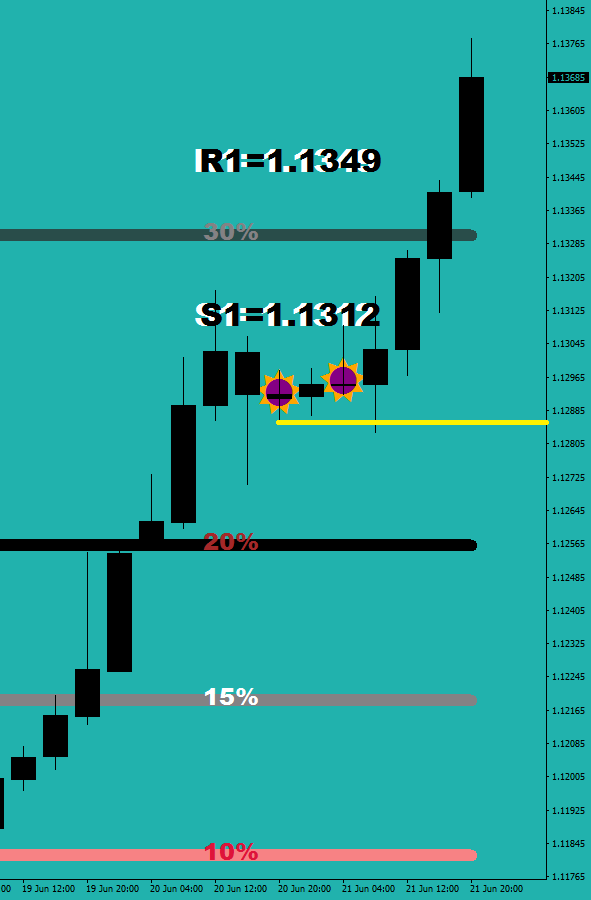
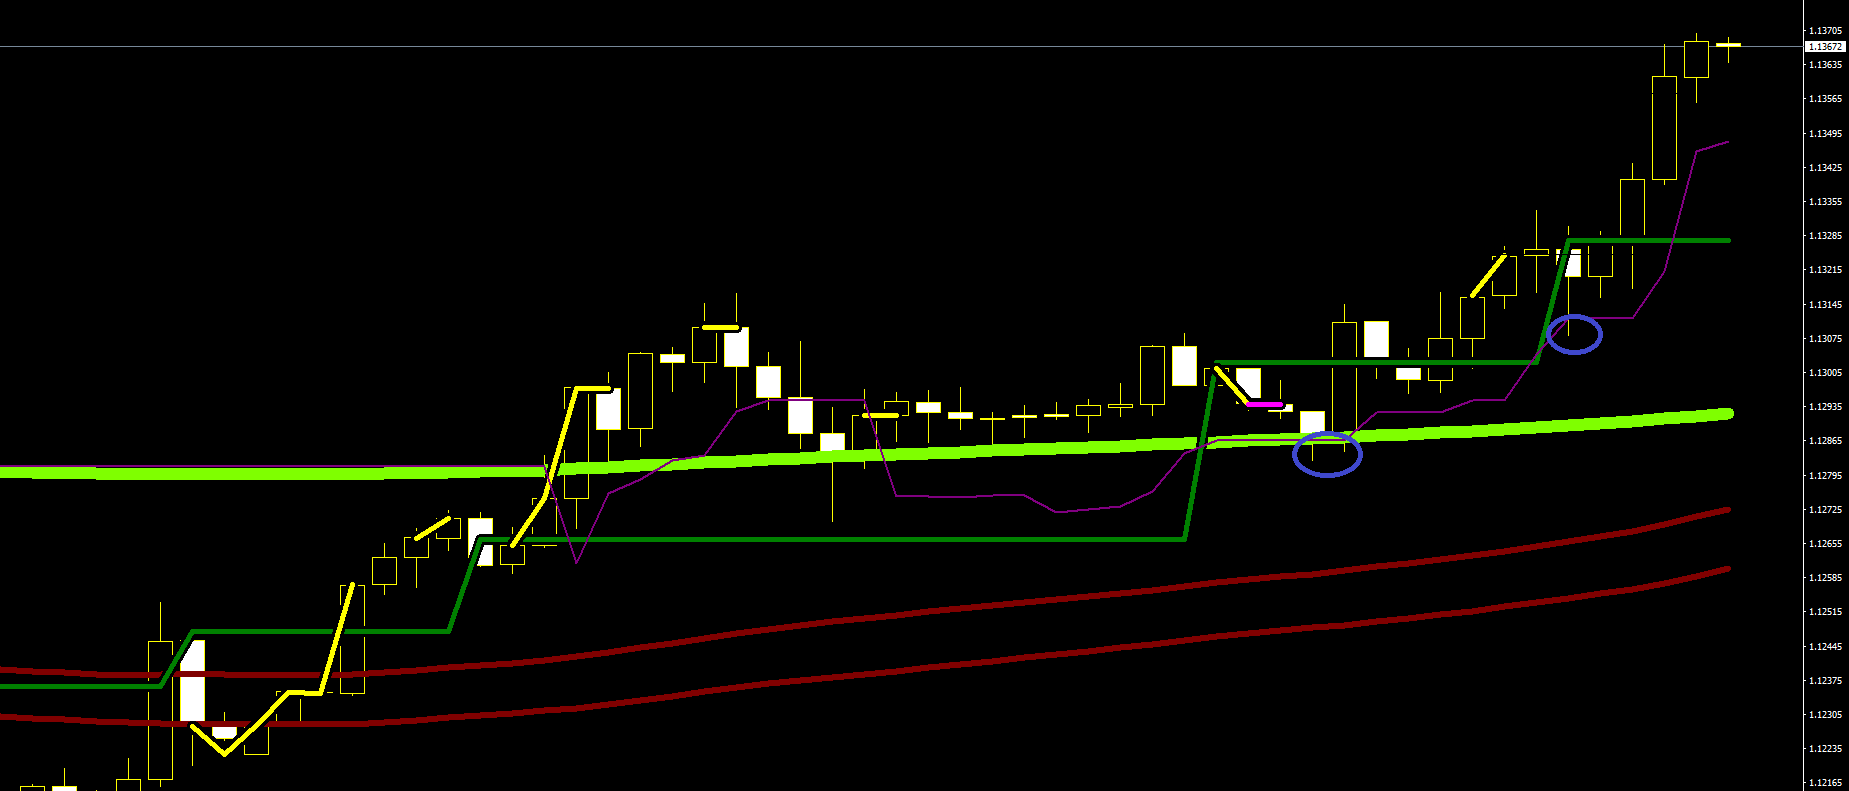
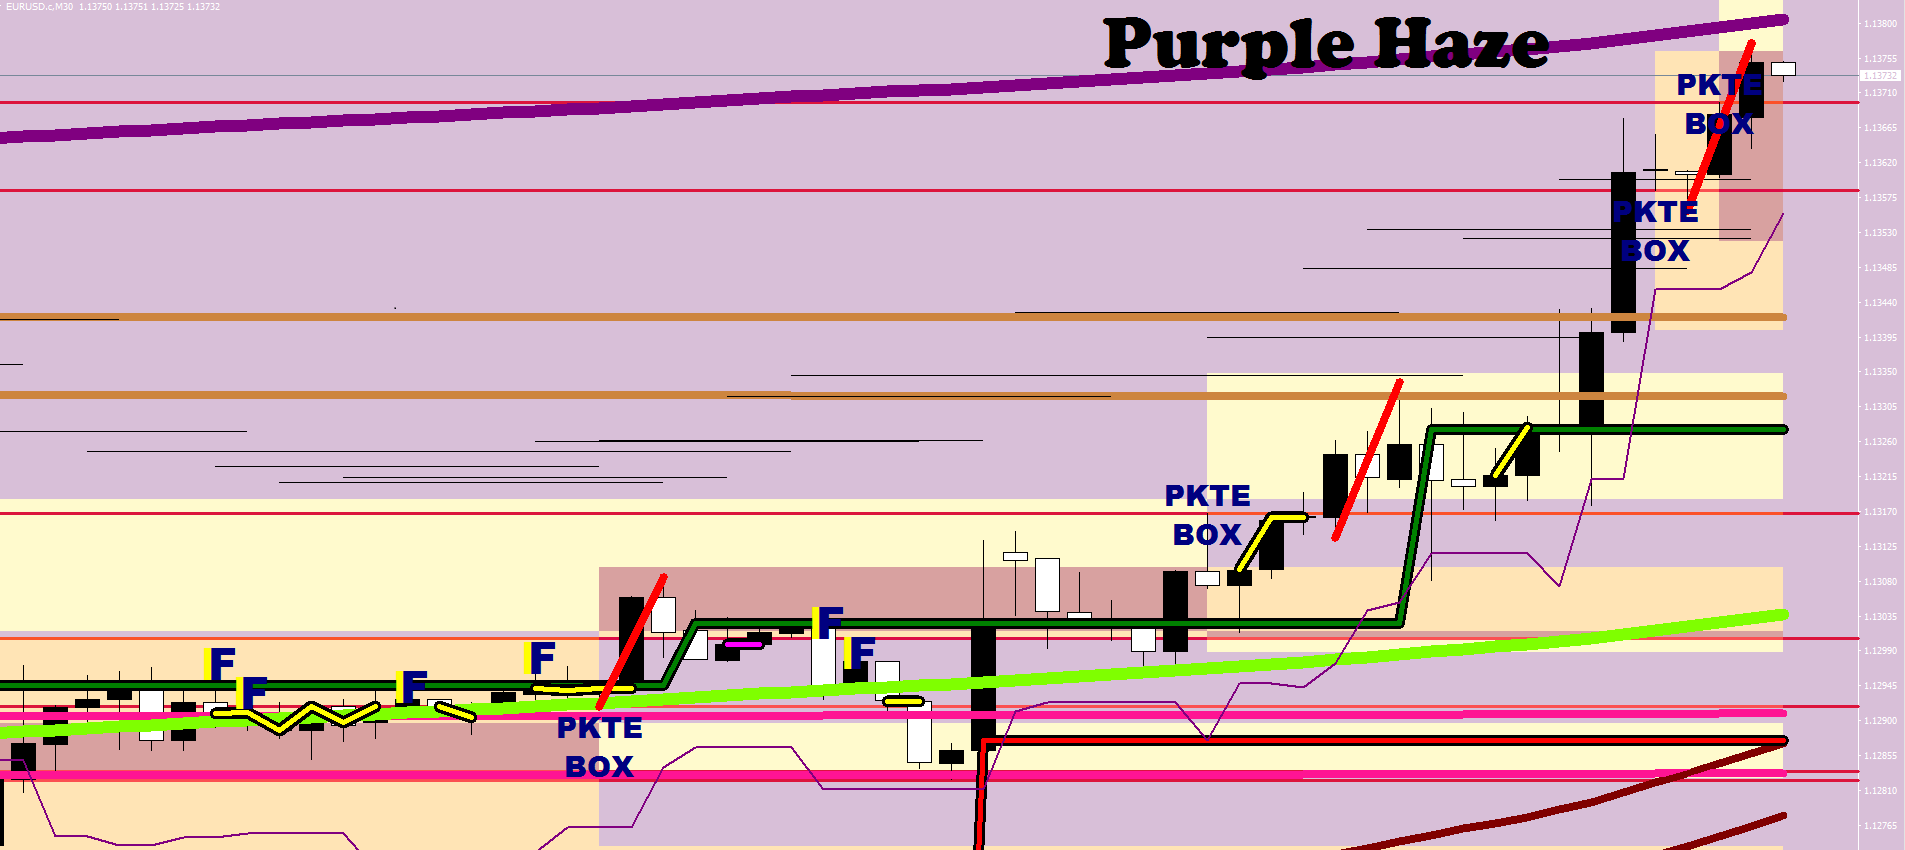
The last measuring low was 1.1281 – until that gets violated, the uptrend remains (a divergent violation should be discounted). On Friday they goosed up the price to the Purple Haze line which is a 3x stretch from the mean. A correction is very likely here: they would have to give a discount to get enough bears interested.
Given the steep incline of Mr. Maroon, as my first thought, I would not expect the correction to get to 1.13. The neutral zone around the upper guard rail is currently at 1.1313 and rising.
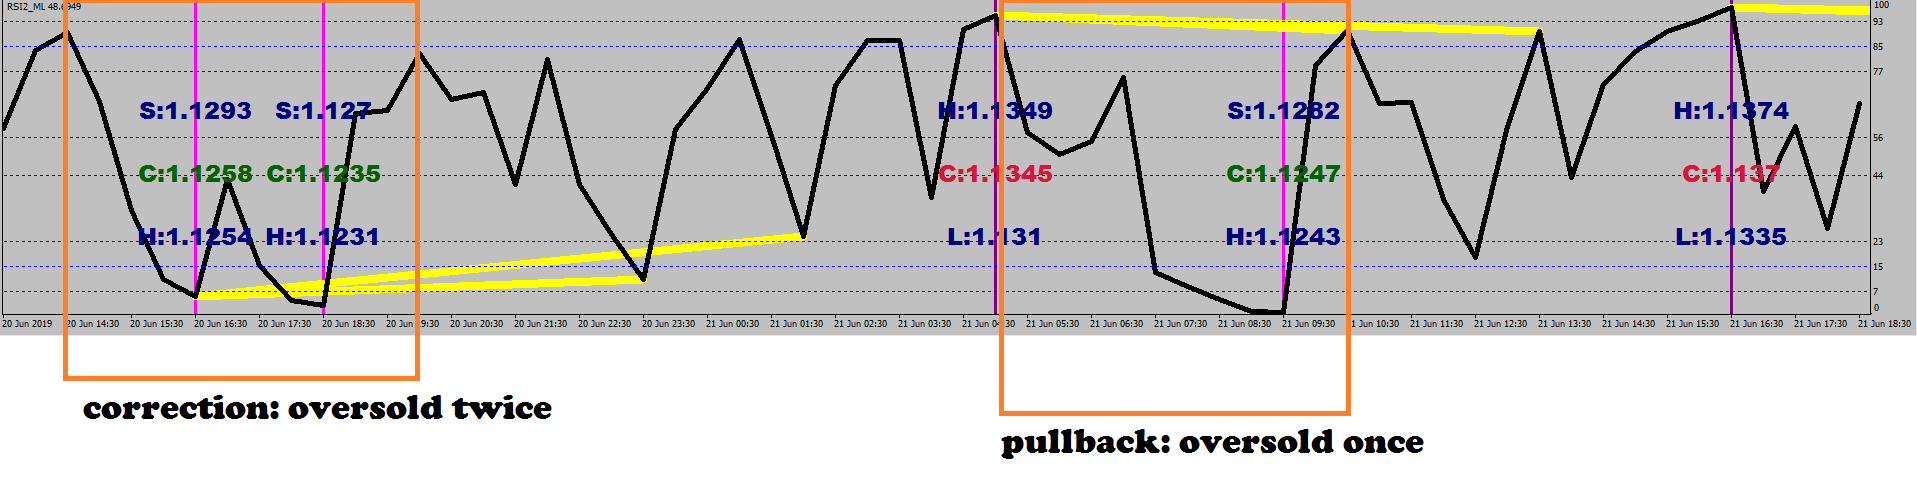
About the upcoming correction: it would go oversold twice = there would be 2 measuring legs down, and the second one would ultimately adjust the channel low.
The deepest correction currently possible would fake out the 2nd 4H doji.
1.1288-1.1285 would certainly do the trick.
This would coincide with the spark zone between Mr. Maroon and the Green River by the time price gets there.
The prospect is a start of a daily wave 3 to the upside. Scary, huh?
Behold the Energy Bands (the moat)
Don’t forget to mention about them in my Wikipedia article please.
To participate in power trading, you would need high leverage.
1:500 would do.
Scaling in can help you witha good average price.
I would normally not trust more than 7.5 lots on an auto-trading routine (given a 5k account), but under exceptional circumstances, like for the sake of this maximum achievement – power play competition, I may open 11 lots and on rare occasions a little more.
With the above mentioned account leverage, after maxing out the account, you should be able to double the balance on a 40-pip move (on a 1:1000 account you would need even less travel). This would normally mean a wave 3, for your target exceeds the Fluctuation Maximum.
I do realize that at some point someone would set the record below 30 minutes; when the stars align right, this becomes possible.
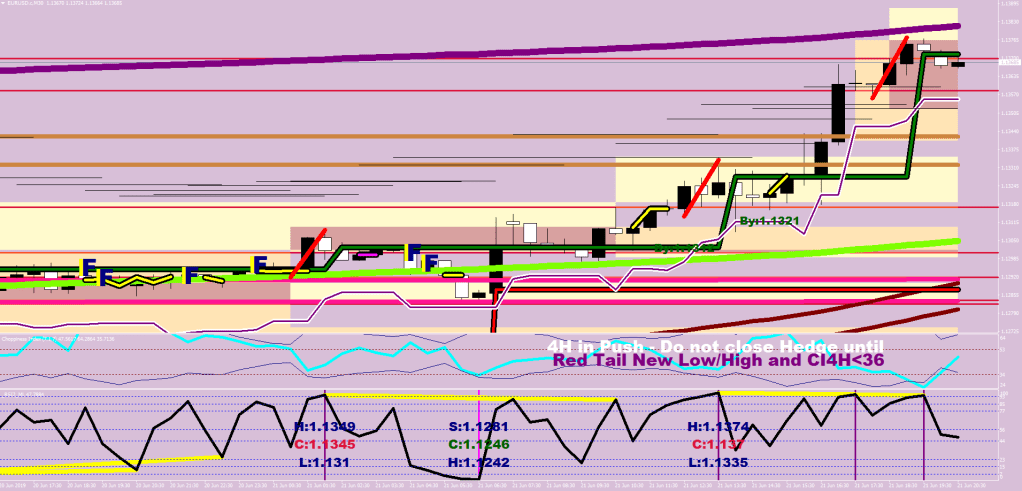
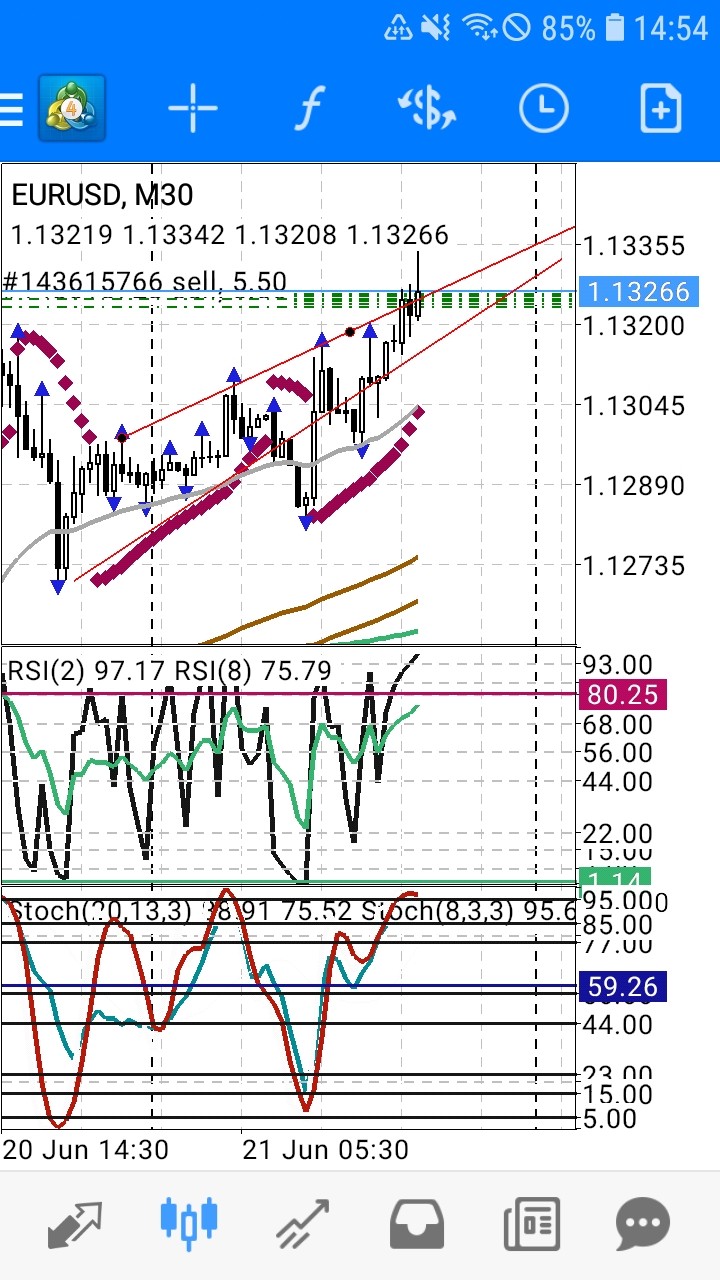
Here is a 31-pip travel in 5 hours generating 81% returns from yesterday.
What you would need for this sport first and foremost is the ability of interpreting what the market is doing currently with high accuracy.
The rest of this post would be the article I started typing under the title
To catch a mocking turn
In order not to bleed out on a turning progress and not to be hedged in the worst possible place, you need to be conscious of what and how can happen to have a trading blue print at hand.
1st step is learn where and under what circumpstances the market is prone to turn around.
Have a checklist and know it by heart.
Since wave 5 isn’t over till it’s over, it is possible to see multiple red tails showing up and additional higher highs / lower lows until the music is on.
The right thinking?
Know your total maximum size, and how many chunks you are willing to cut it up to.
Know the instrument’s fluctuation maximum. Placace a protective hedge stop order Fluctuation Maximum + a little away from the end of the last red tail.
EUR/USD: 38+4 = 42 pips out.
Divide the Fluctuation Maximum by your maximum position number to arrive at the pacing you would have to maintain between the opens.
38 / 6 = 6 pips distance
Your maximum size divided by the maximum position number = individual opening size.
5k account, 1:500 leverage, max overdirve 14 lots – open 2.25 lot sizes.
Open the first position 1 pip beyond the red tail, and put out the rest of the stack with your spacing size in between.
Ripe conditions for a price reversal
1. Sufficient stretch from the Mean
2. 4H is strong trending / exhaustion
3. Red tail event
4. 26-sample new low / 46-sample new high
Squaring:
It could come in handy to plot exhaustion levels: closing out your positions in gains may turn out to be fruitful in obtaining a weight further out (and yield some extra cash). The squaring levels are the exhaustion highs / lows and the ends of the red tails. (Red horizontal lines on the image).
Footnotes:
There is no wave 1 until the price manages to cross to the other side of Mr. Maroon. Therefore after wave 5 of wave 5, you either get mere structureless fluctuation or an ABC correction that would ultimately fall short of Mr. Maroon’s dark side.
An example for an ABC correction that went as far as it was possible: just shy of Mr. Maroon’s dark side (wave 4 of wave 5)
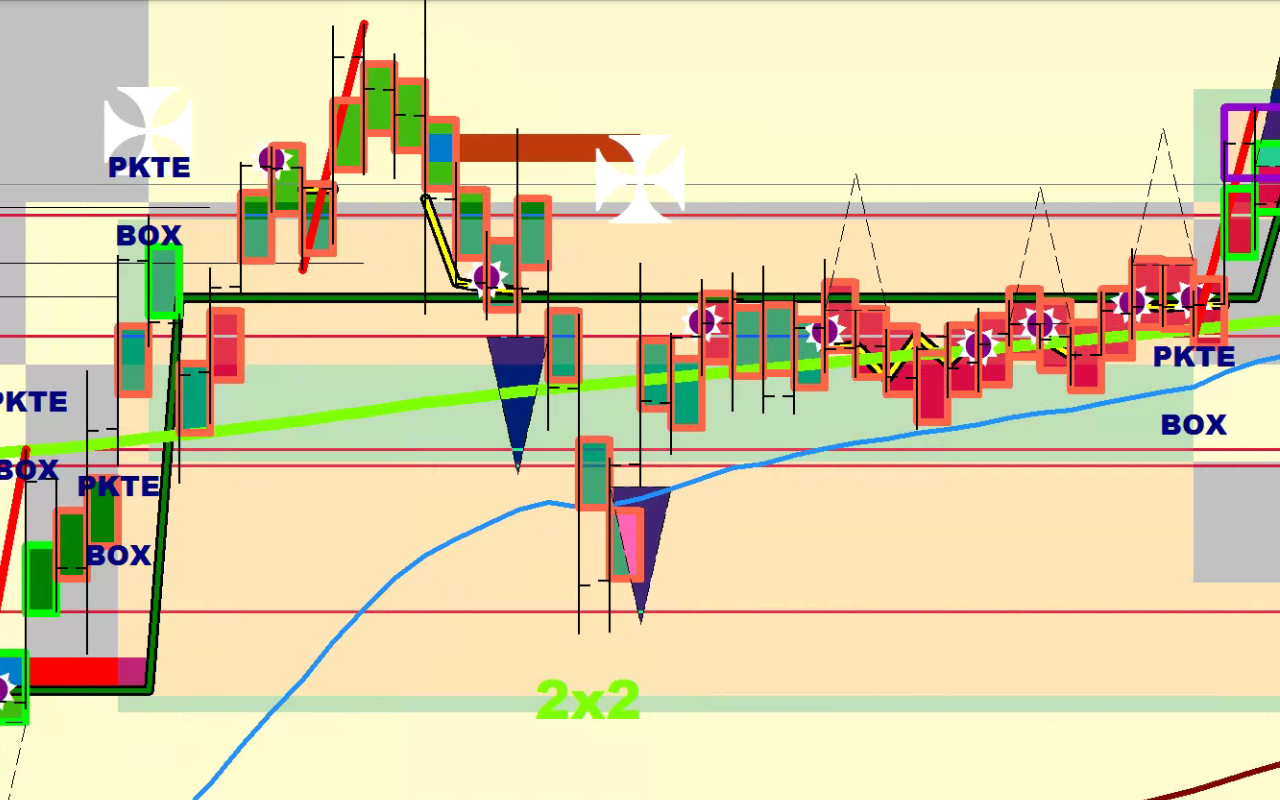
A wave B ends in an RSI2 divergence. On the image below the purple thin line shows the measuring leg that is connected to the divergent leg by the yellow line.
…and a couple more of those divergences = rising wedge; let’s not forget about this possibility
So what is happening in these B waves that makes them go on seemingly forever? More than anything this has to do with the price location: in Bull Zone 1 the bull is trading with the other bull, half of them are covering upon realizing that they won’t get paid here, the other half is going long even more. This is not the place to forge a rally from.
Other than getting the exit value perfect on the mentioned 80% run I sucked balls all along.
I happen to be my own worst student, and so I do need to read things out loud for myself. This blog is a selfish thing as such.
Now I need to figure an unrecognized server name issue on my phone.
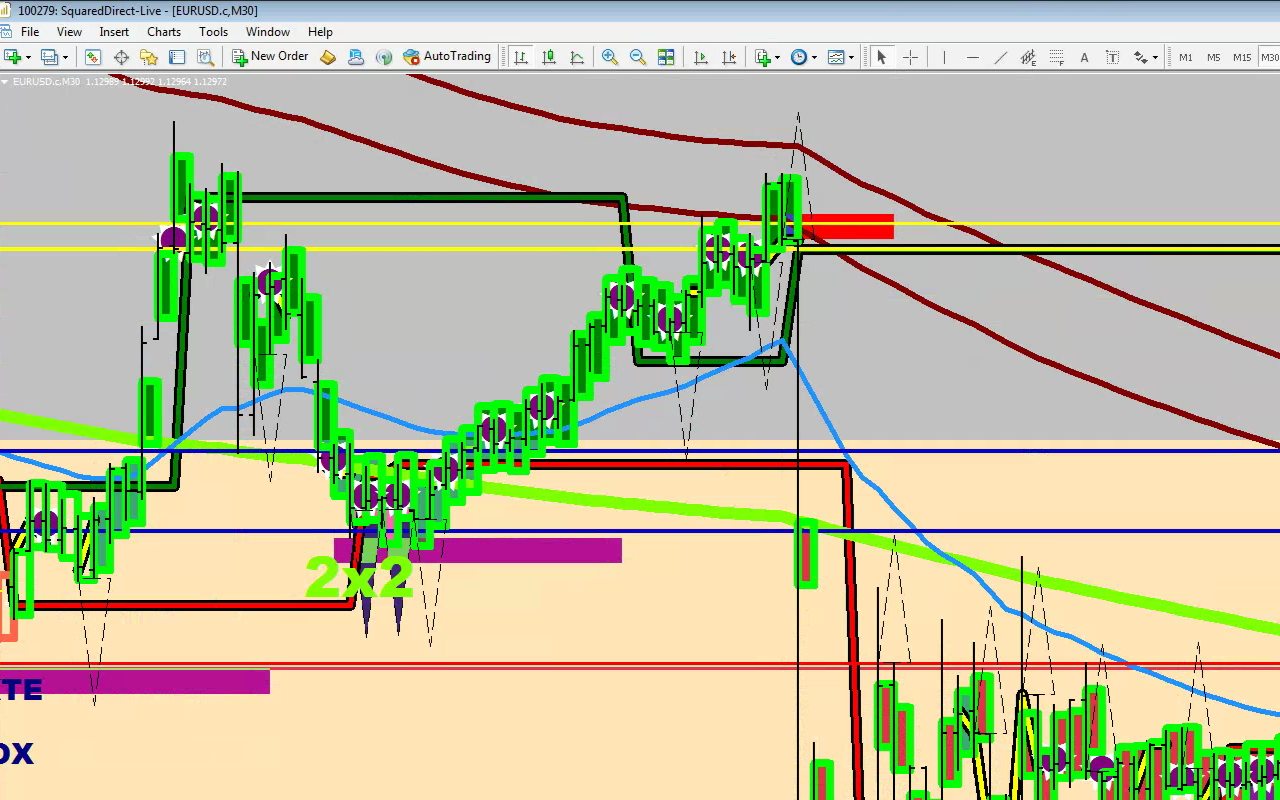
Picture: Wave B wedge breaking in the wrong direction first (hitting a liquidity void)
In addition to the above:
Looks like the break was merely a wave 4, not an A. There is always a possibility that you are looking at a wave 4 when the market pulls back to the Water Line.
When price has exceeded the upper guard rail, and is in the Bull Zone 1, there is a new game called Catch 22 that can goose the price to the next mile stone, the Purple Haze.
Every time the price dips 22 pips from the most recent high, there is an opportunity to make or break the market. Habet or non habet.
It is a relatively low cost way to inflicting additional pain, kind of like throwing a log on the embers.
Achilles saw that what he was doing was good and so the Power Trading was born…
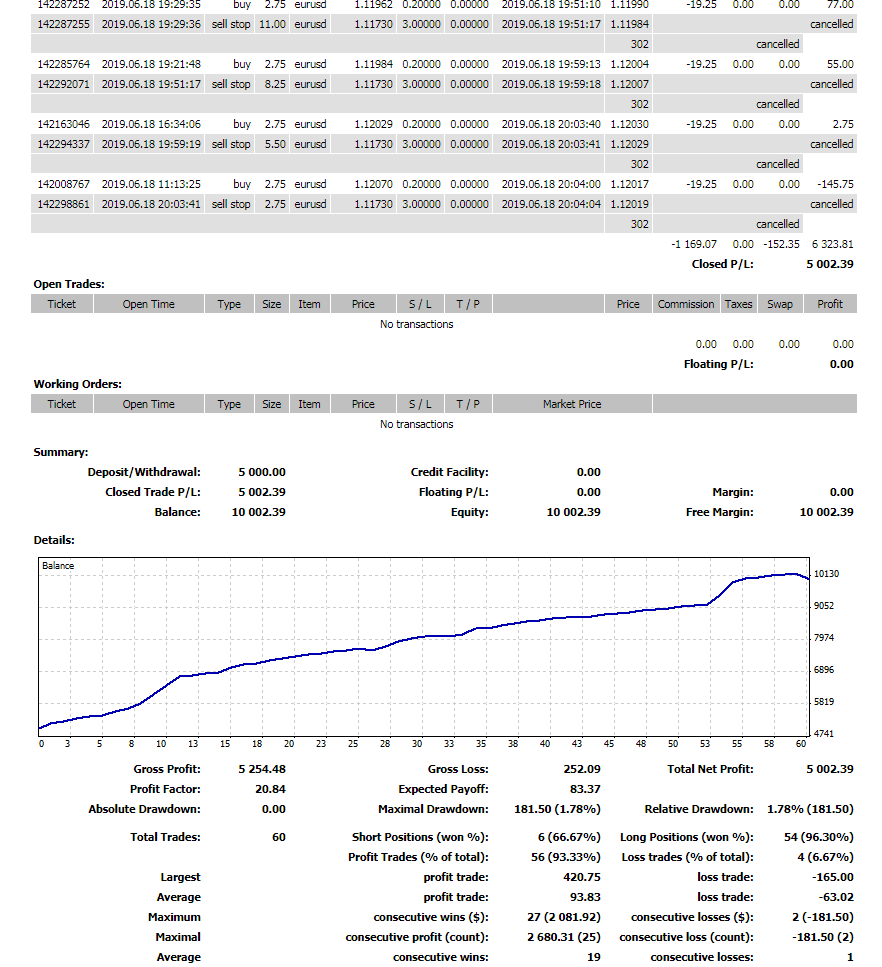
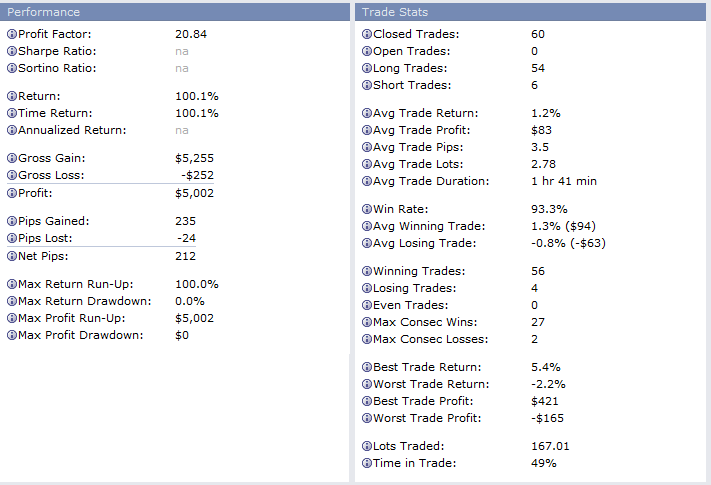
The game is simple: try to make 100% gains in the fewest number of trading hours possible.
Here is a qualifier run:
First trade placed: 14/6/19 at 20:13 server time
Last trade closed: 18/6/19 at 20:04 server time
That comes to less than 48 hours since on Saturday and Sunday there was no trading.
(The first four trades placed)
Yes, I closed the last trade at a loss for the 100% target was reached.
Do you still believe in compounding? Not in Forex, I don’t.
Why? Because every dog would have its day.
By taking out the gains, you are not capping the upside, but rather, you are limiting your possible losses.
If you have a last line of defense which is a ratio hedge at about 40% equity to balance, then you may impose a rule for yourself to be calling the run a defeat and if you would liquidate all positions including the hedge, what you would end up with would be something like 50-70% of the starting capital, for most likely you would had amassed some extra balance by that time, so the actual draw down is not likely going to be 60%.
At this moment, you may proceed to start with a clean slate by topping up your margin.
Remember, the greatest asset in trading is time.
Instead of fighting a losing fight, admit defeat and start all over.
So, how long would it take for you to double the money on the account?