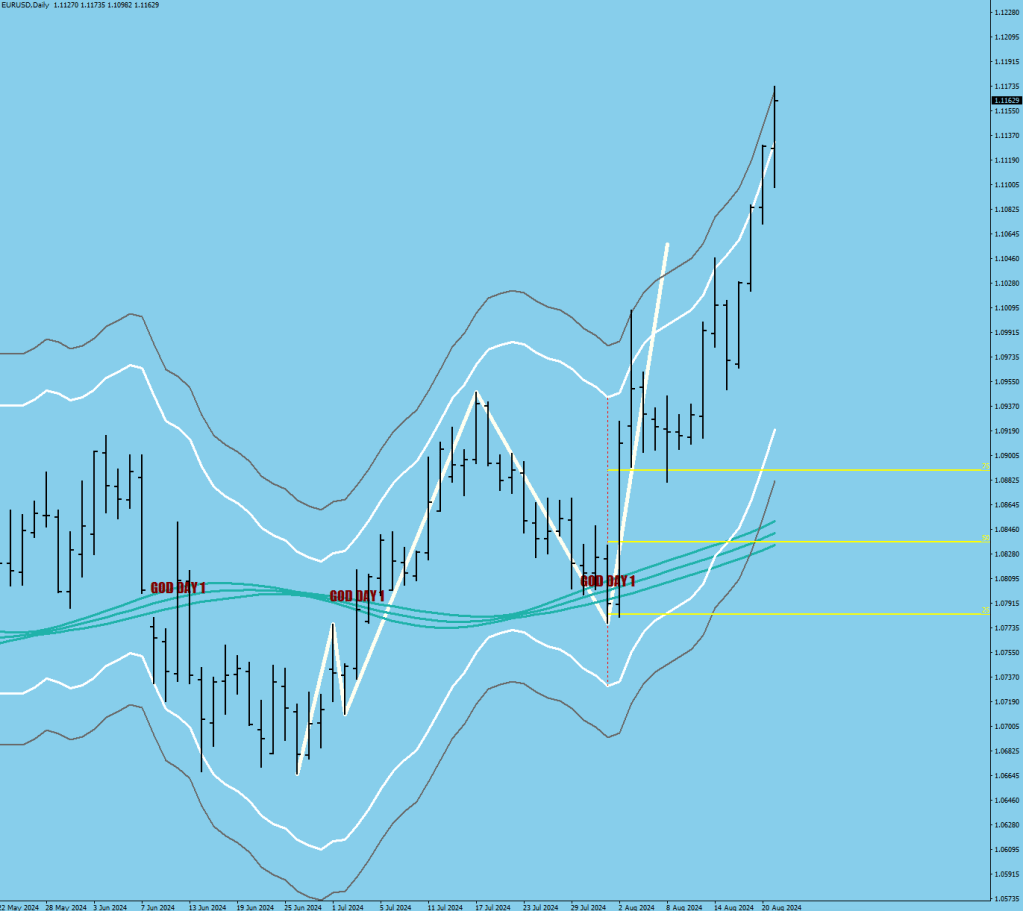
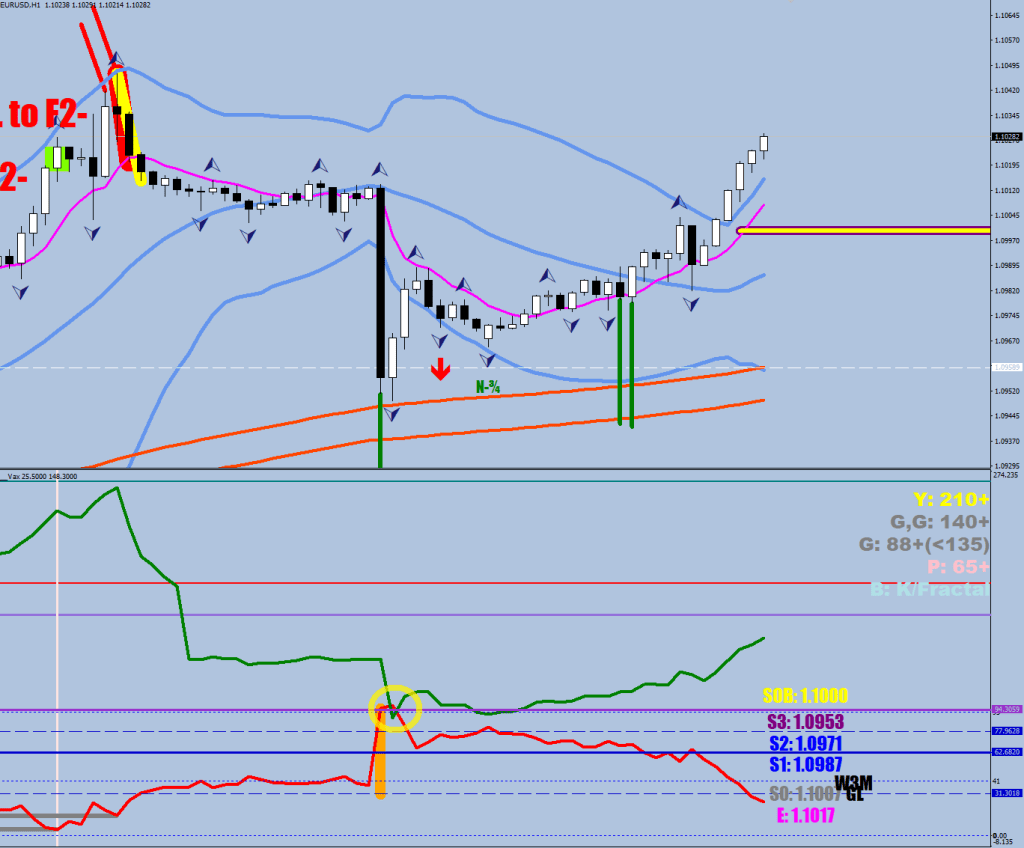
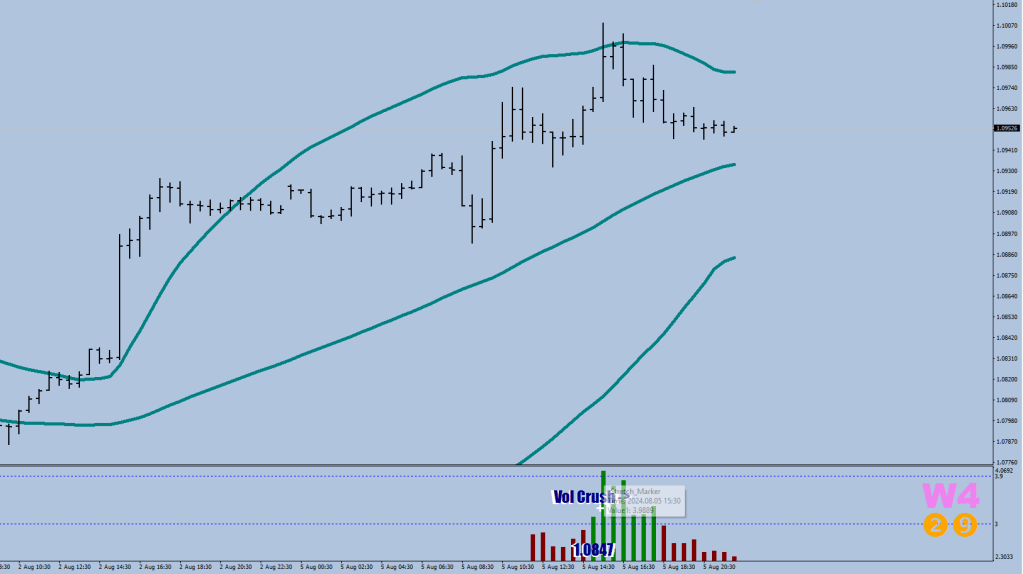
With this severe volatility compression episode you better believe that this was a Wave 3.
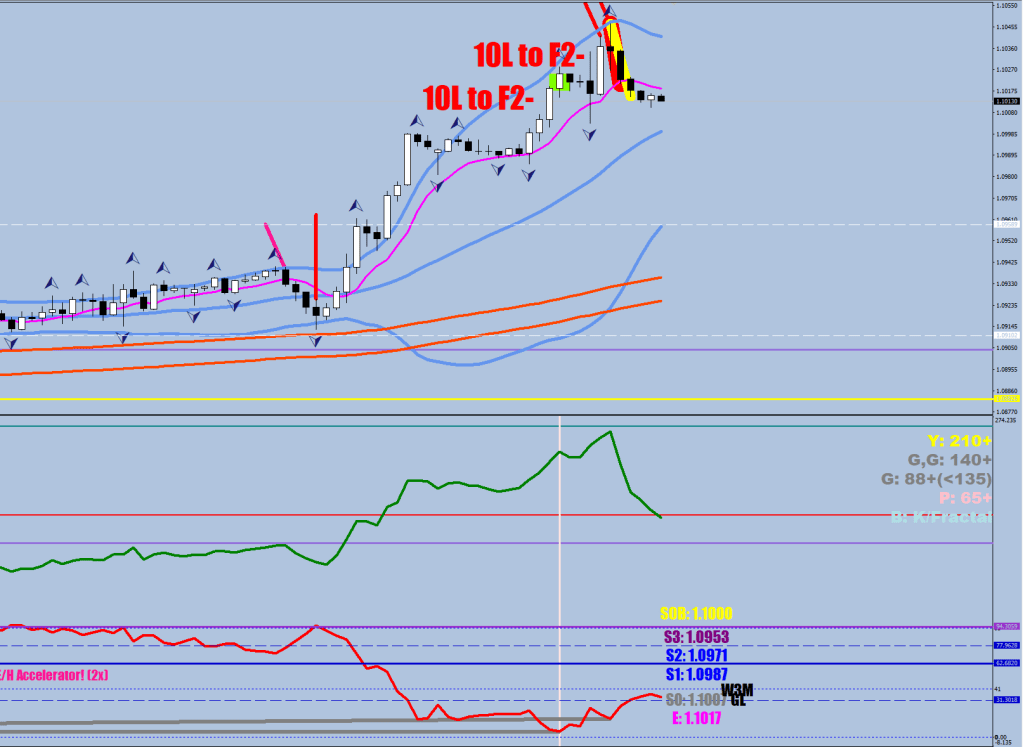
If I called the counter directional volatility limited at S0 (41 pips) an S0 inferno, now we have seen how an S-1 inferno looks like with the limit being 21 pips out. I put a back line to mark this.
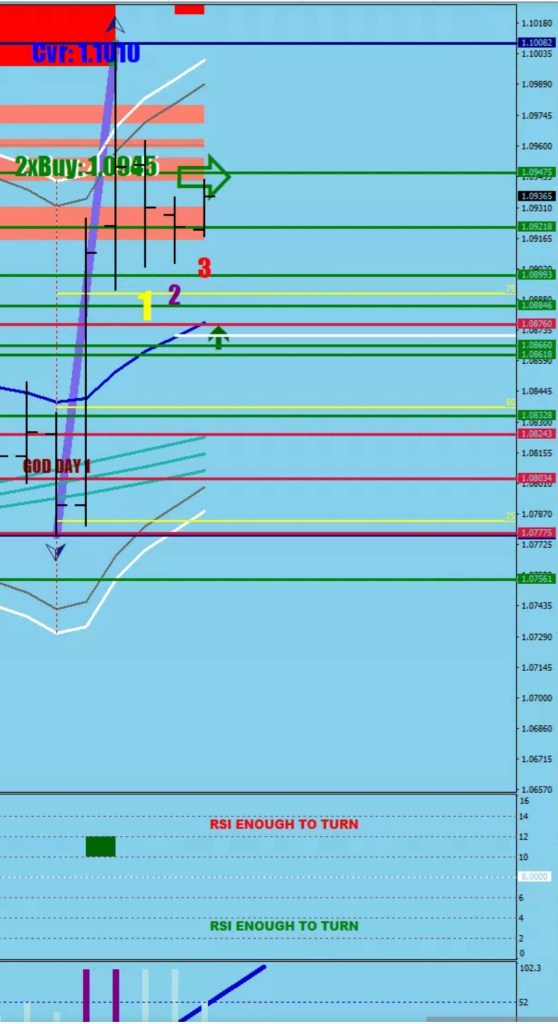
The extra-compressed inferno’s SOB level is listed as E. The first encounter is a buy as usual for the final play, that targets the Goldilocks level (70-86 pips from the dip low). On the way down, after the SOB (here E) gets broken, there will be no support until the two volatility lines converge.
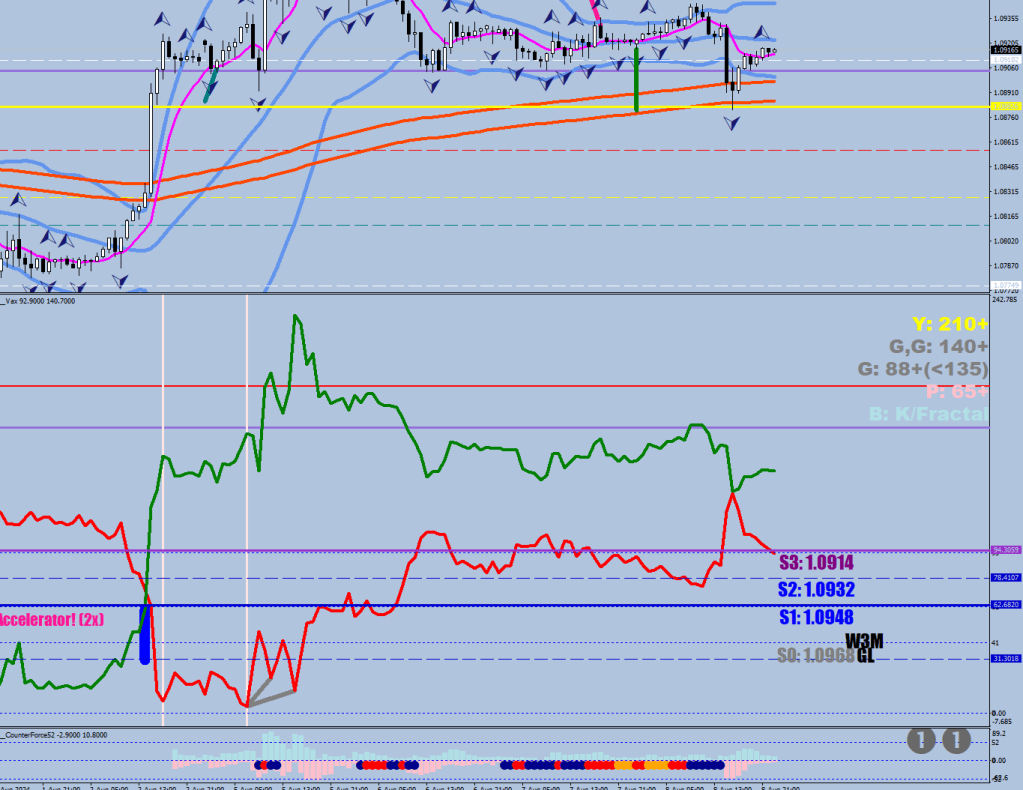
Remember that I adjusted the Gray band to 3.8x stretch to find the final divergence? It just hit.
With numbers:
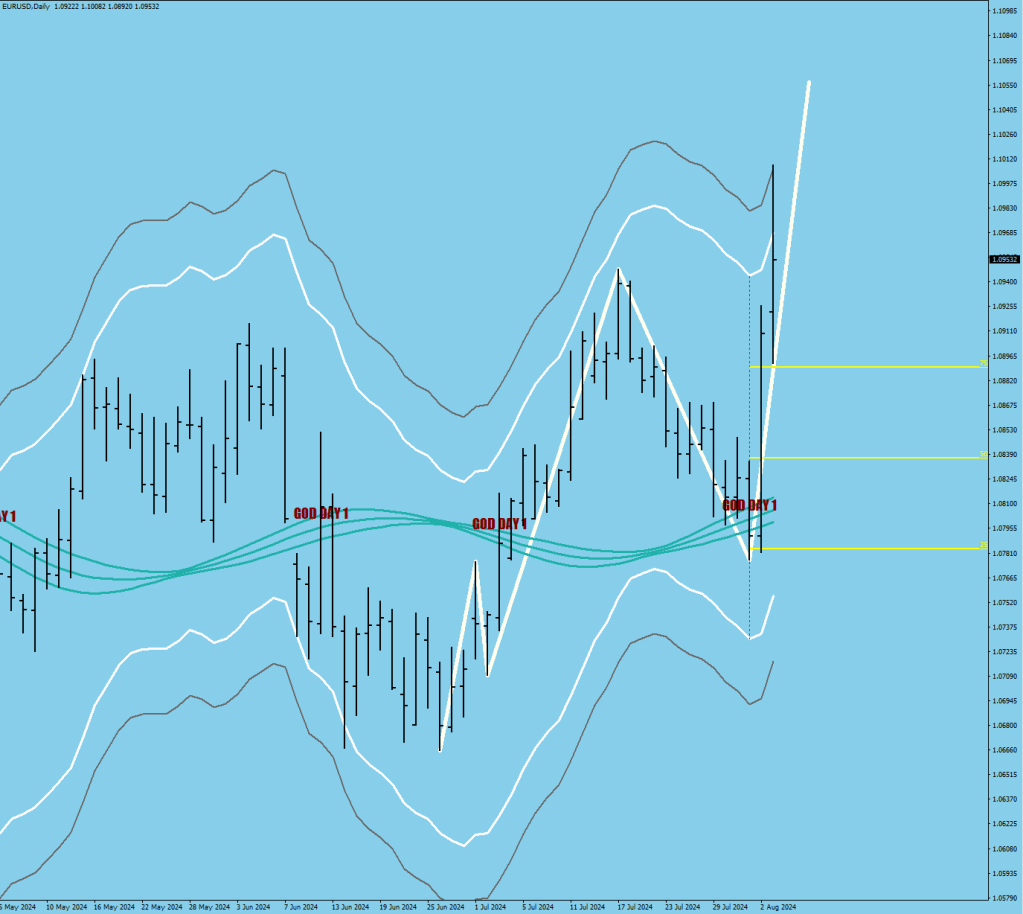
Yes, calling the Intermediate Swing High as of Today.
The first thing to point out is that there will be a higher high.
The Daily stochastic went so ridiculousky overbought that it would have to show slowing down by making a reversal divergence. That’s not to say that you cannot have a 77-90 pips dip in between.
The next long cover projection is at 1.1151. May or may not get there.
There is 1.1149 as the next weekly resistance line and there is a swing high just below that
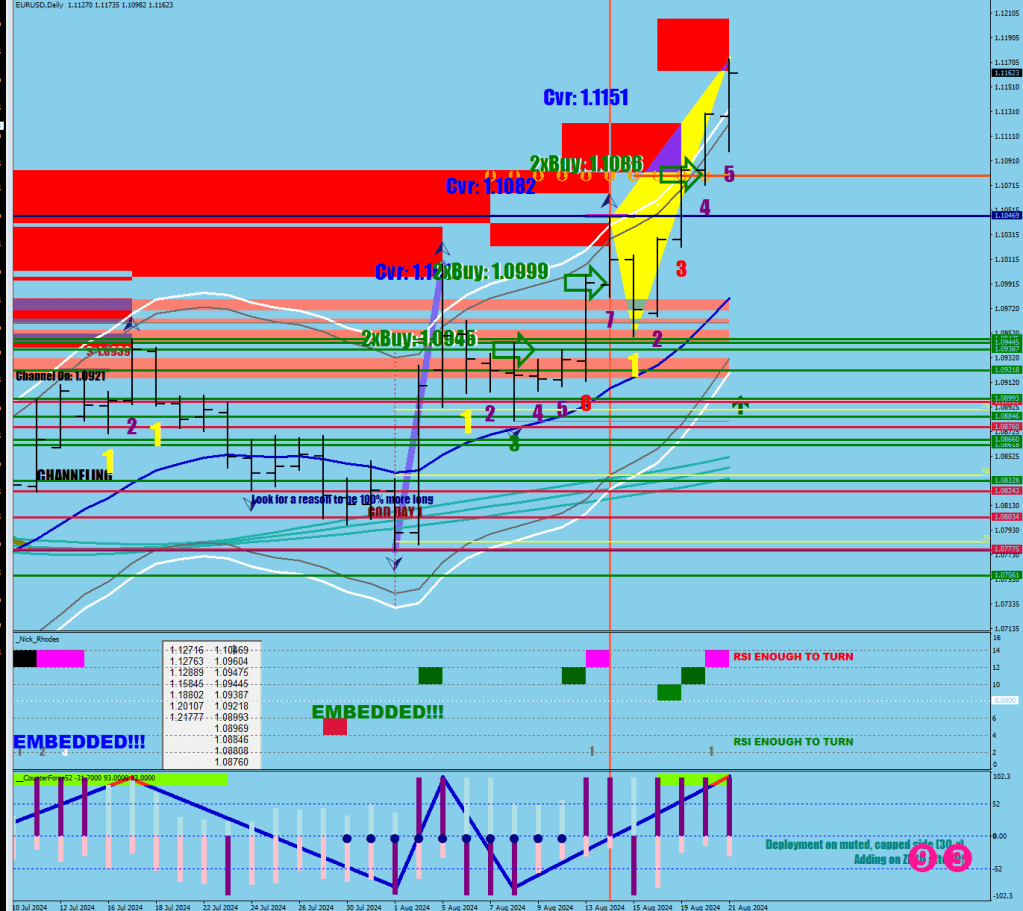
The second thing should help you understand how embedding works.
The 120-sample stoch was staying overbought whilst the money flow was in a deflated state. This gave room for relentless buying until the money flow went red hot. I will make a hourly exit plot with 60-sample stoch and use 10-sample MFI making a peak above 85.
The volatility compression printed a 0.5 (anchor of the gray divg.), that should serve as hint for more divegences to come.
The way the indices gap versus forex, 25 hrs markets are two different things.
The large players figured out a long time ago that they could move the market the best if they had a branch operating in Asia to guarantee their overnight gains for the US Cash trading session. The gaps occur over there often, on multiple days per week.
Forex follows a continuous Futures contract, on occasion, it can gap intraday around major news when all liquidity gets withdrawn for the market temporarily and the broker applies a 20x multiplier on the spread at the same time. These gaps can be a 10+ pips displacement, otherwise, the real gaps only happen from Friday night close to Sunday night open.
The market makers get a dose of orders and either hedge at the open (rare, like a gamma-squeeze is in Forex) or dump some of their holdings by giving fills that cause an initial push in the vacuum.
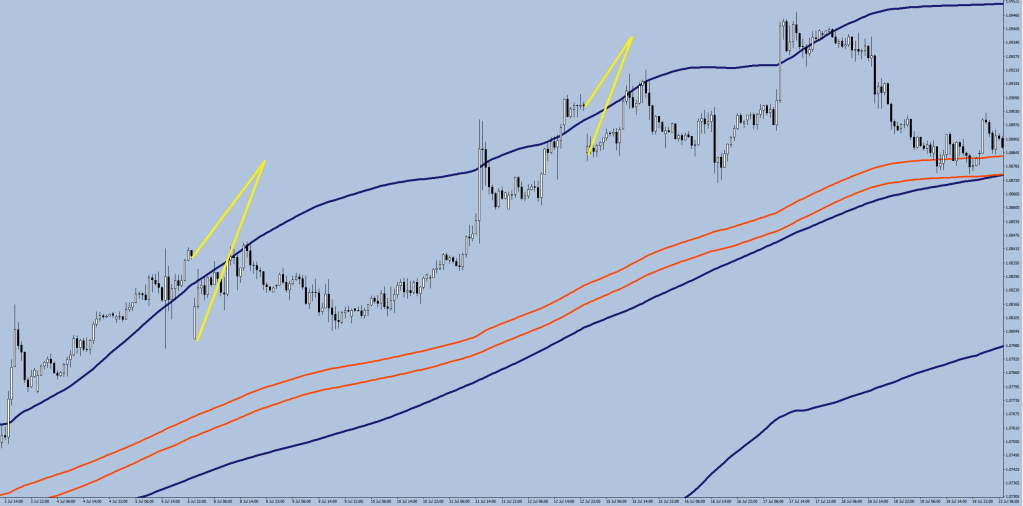
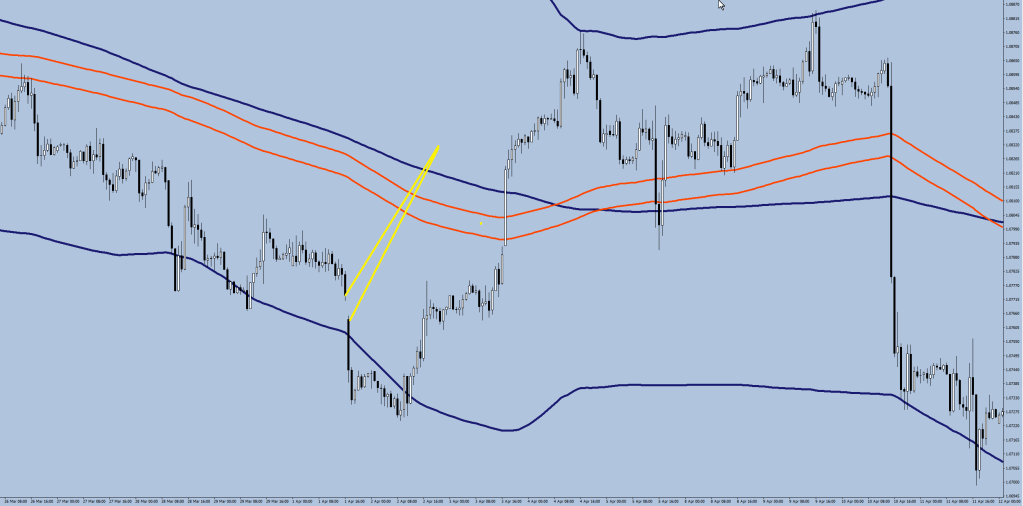
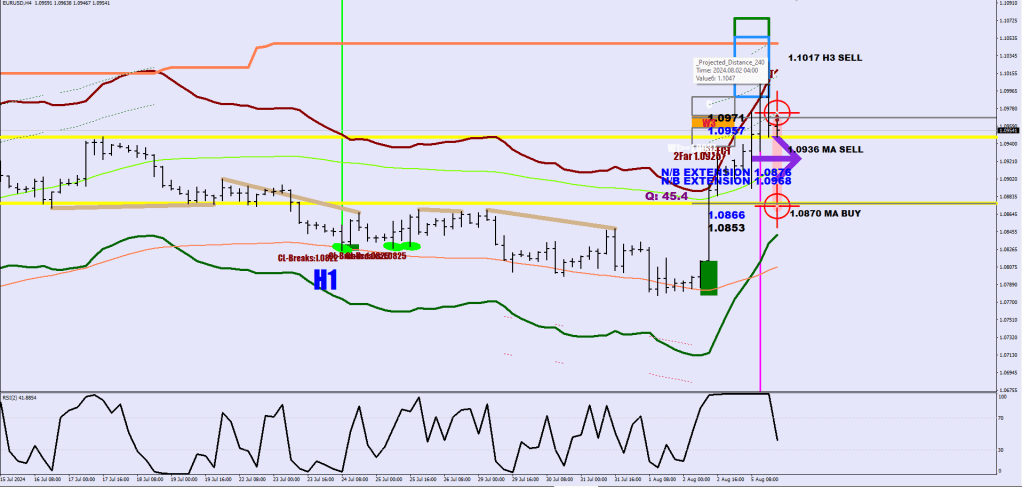
The first thing to say is that most Forex gaps would be trimming some imbalance, thus the move would occur in the direction of the Hourly 240 SMA. This re-balancing move secures some extra liquidity making the move last longer after the small recess.
Here are 2 examples of that:
Notice that at the close the market is decidedly outside 2 std deviations from the 240 SMA. Also notice that these last 2 gaps not just got closed, but made a marginal higher high (4 to 11 pips) before a dip a little lower and then a continuation move up.
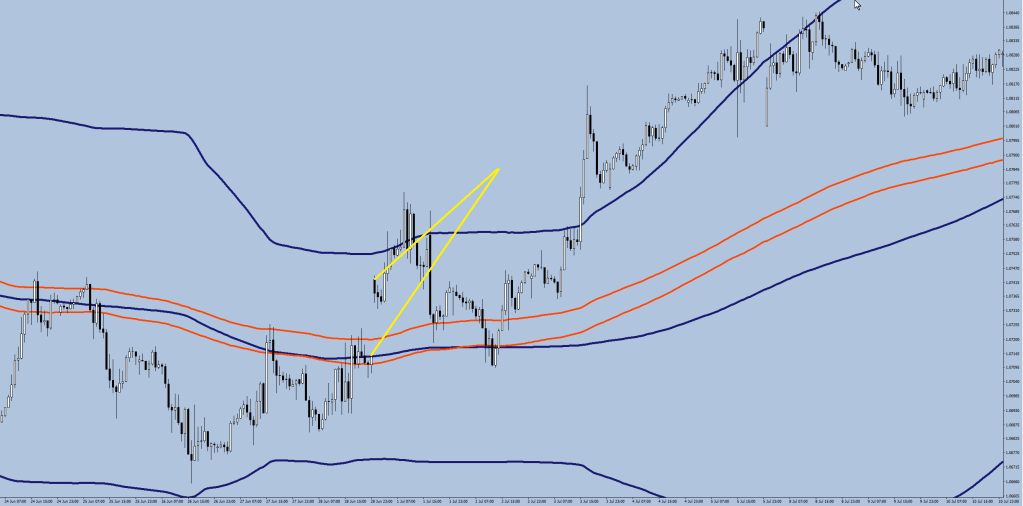
The next example is a gap away from the 240 SMA:
So far every gap filled almost immediately.
The last example is a gap away – this is a rare event when the move is first riding the 2 std band and not pulling away from it by the close (accelerating). This gap took 3 days to fill.
These gaps can be 20-30 pips wide (and some of it is merely the spread).
As a rule of thumb, if the finish was within the bands, the market would gap away, inside the bands the market would gap towards the closer band.
This is a useful piece of information on making hedging decisions into the weekend.
The last thing to talk about is that a 140+ pips wide gap is not likely to close fully.
The 200-pip gap below only closed back 93. This is a weekly chart. Not sure what happened between the 16th and the 18th of May, 2017 but it had to be a serious central bank invention.
Friday’s close was outside the 2sd band, so it should be gapping down.
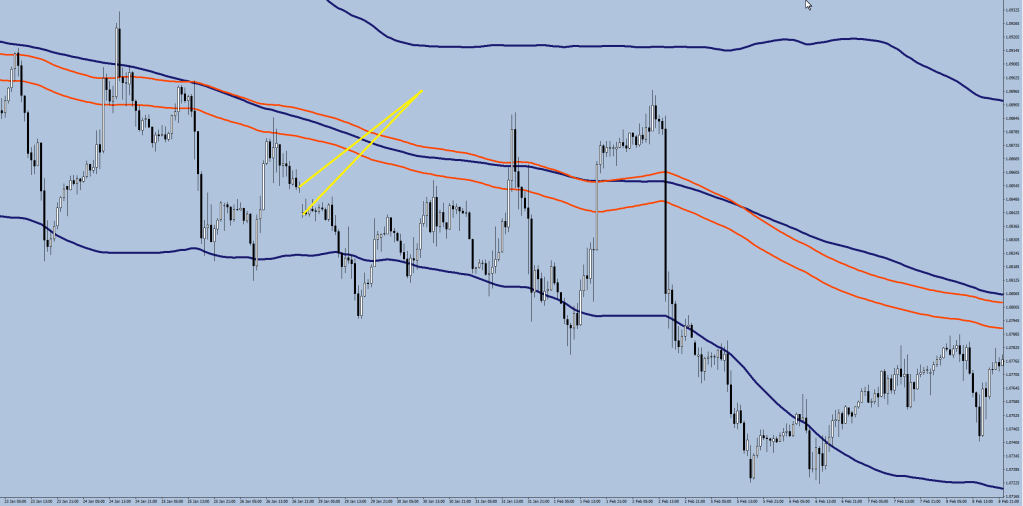
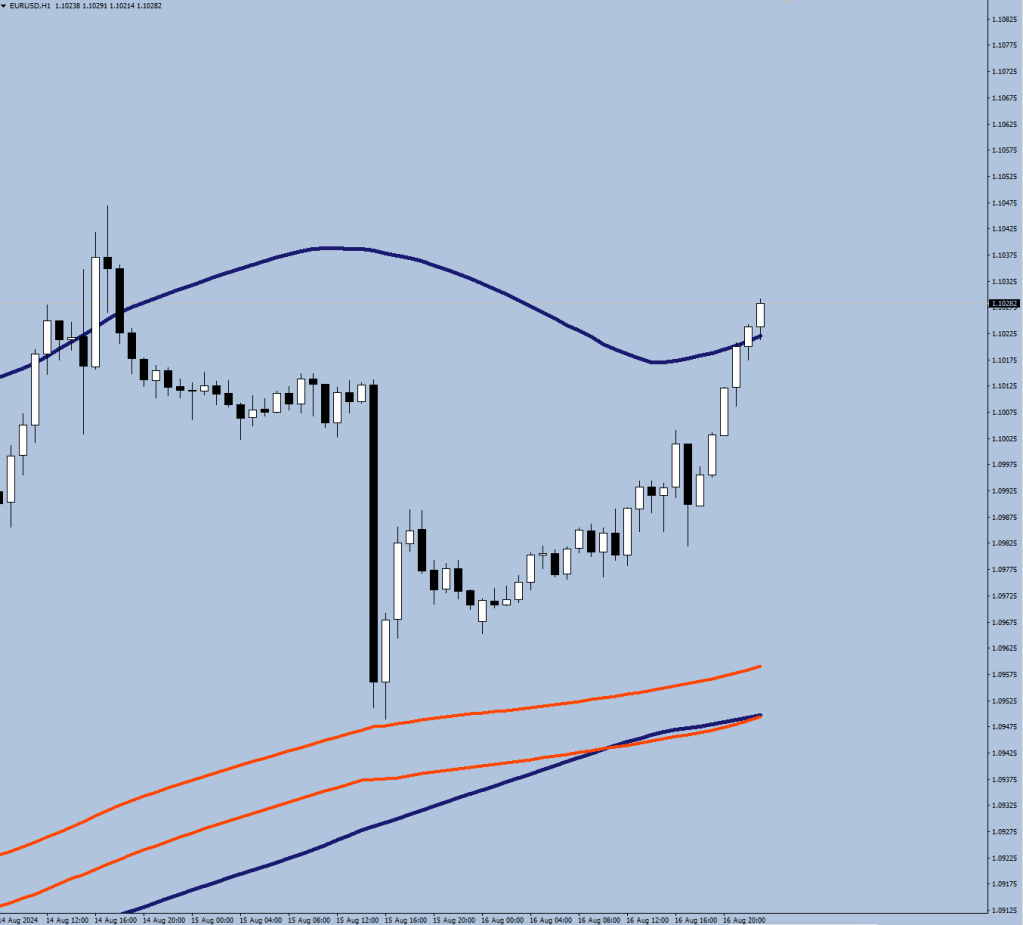
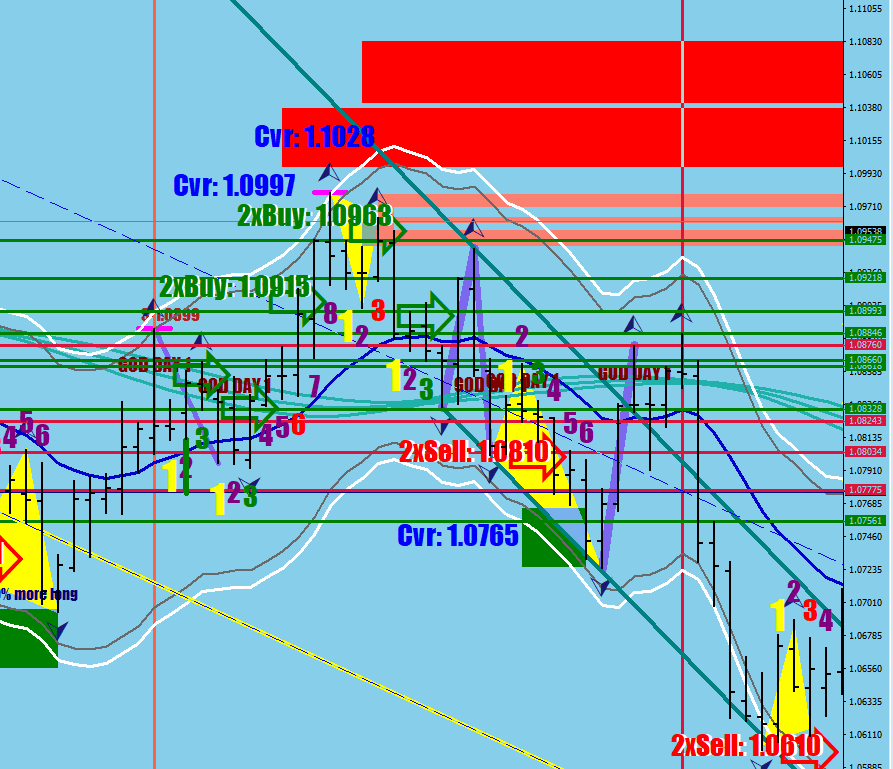
The first thing to appreciate is the nature of volatility expansion-contraction.
After the first push down (using the effort signal from the previous post), which expands the Bollingers, there comes a phase of contraction, when the opposite end gets tested usually 3 times before the next expansion leg down.
Yes, this time it was a bit different. I did say that the correction (at a minimum) is going to last until the two volatility lines converge.
Below is an earlier example.
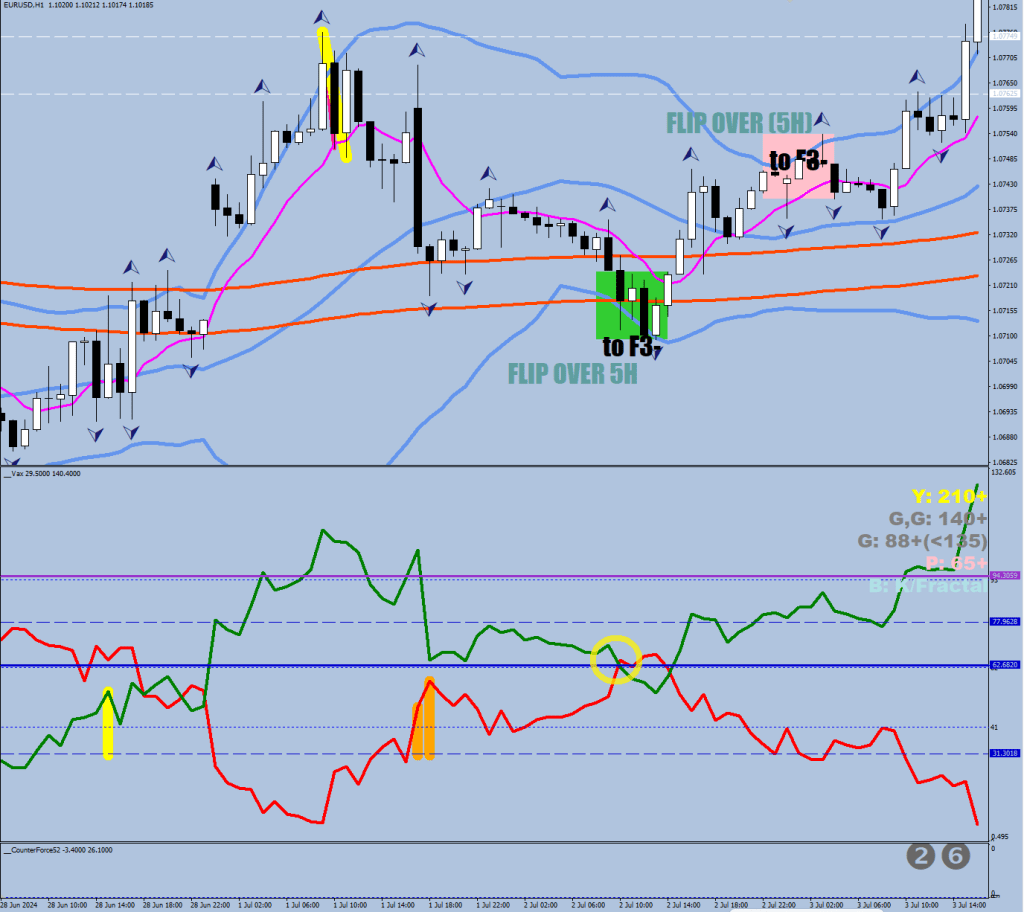
The current move should had started the contraction dance, but the SOB was broken to the upside (yellow-purple line at 1.10).
This was a bit unexpected (the SOB tends to be like let, not-let, let), but then again, the convergence also happened above the municipal trench.
This move could be a recess to the Safety line –
the Partial discharge triggered the move to the 2.8
Or a plain old Wave 2 (bow back) to the top of the MA ribbon.
One weekly close outside the resistance line may end up being a fake-out.
That yellow divider between a regular weekly swing and an intermediate swing may end up proving to be resistance.
4 months, 400 tracks produced & published. Already feeling like I was granted an extra life.
The end game is ultimate, one-sided control of volatility. The end game is a ripe condition, a structured framework for a market turn.
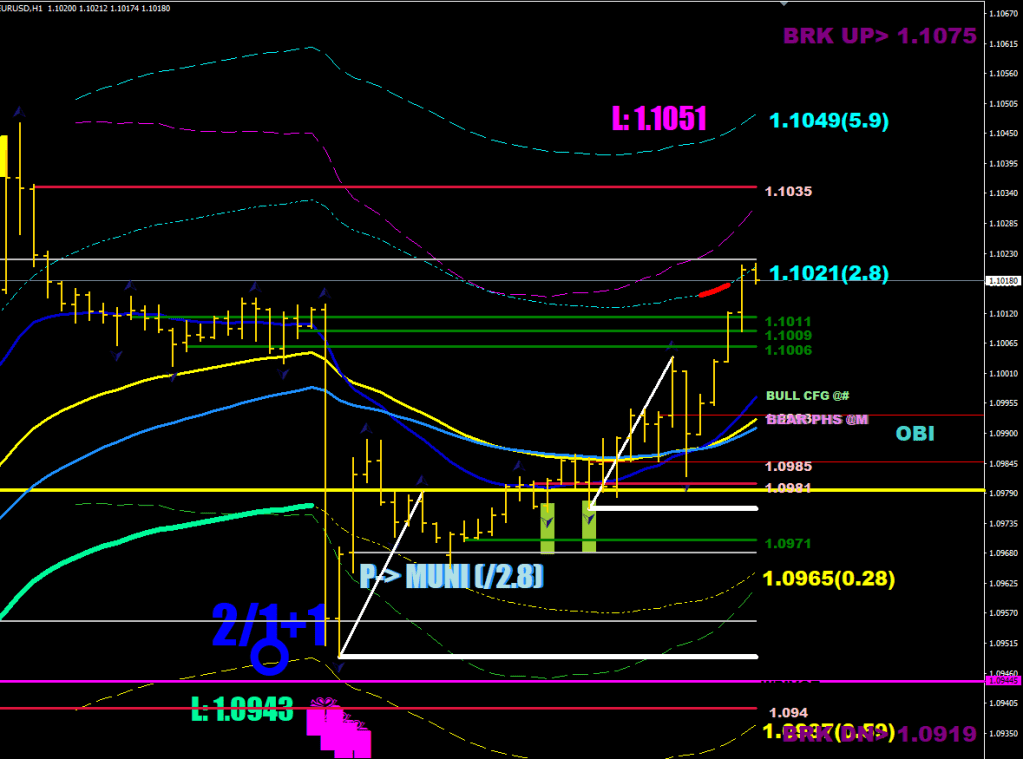
To get to the end-game territory, the market must cross over the SOB level first.
This level is going to let the move happen, even providing some boost to reach the E-level.
The SOB level is 47 pips relative to the 200-hour swing high/swing low.
The structure of a turn is at least 43 hours of counter-directional volatility compression where the S0/R0 serves as a cap not letting the price get down to the SOB level.
The sequence of the structure is a Shot-Over-The-Bow, a fresh Volatility Compression Divergence (new 200-sample high/low is necessary for this and is usually within 70-86 pips from the last SOB encounter), and a Break over the Bow.
A sudden, quick turn (16 hours of volatility compression before an SOB touch) has a non-lasting effect, that can send back the volatility lines for a kiss before continuing with the original direction.
So now there could be an end game lasting 20+ hours to the Break Over The Bow after making the new high first. I am hoping for a volatility boost from a drop to the E level or the S0 as momentum has choked.
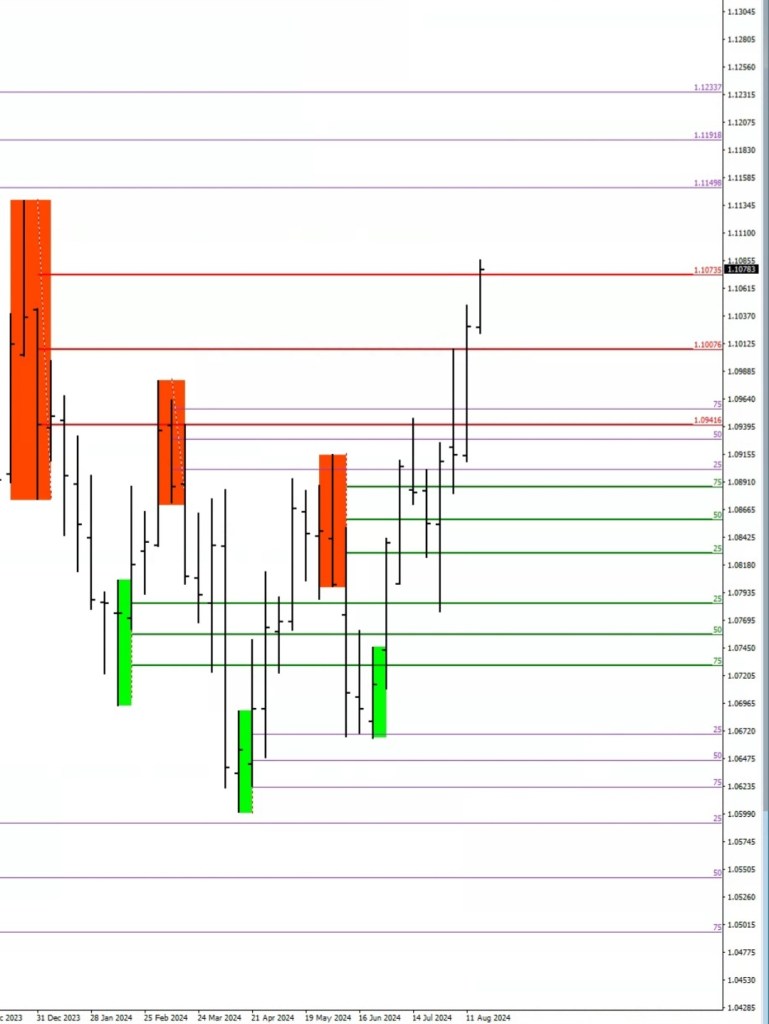
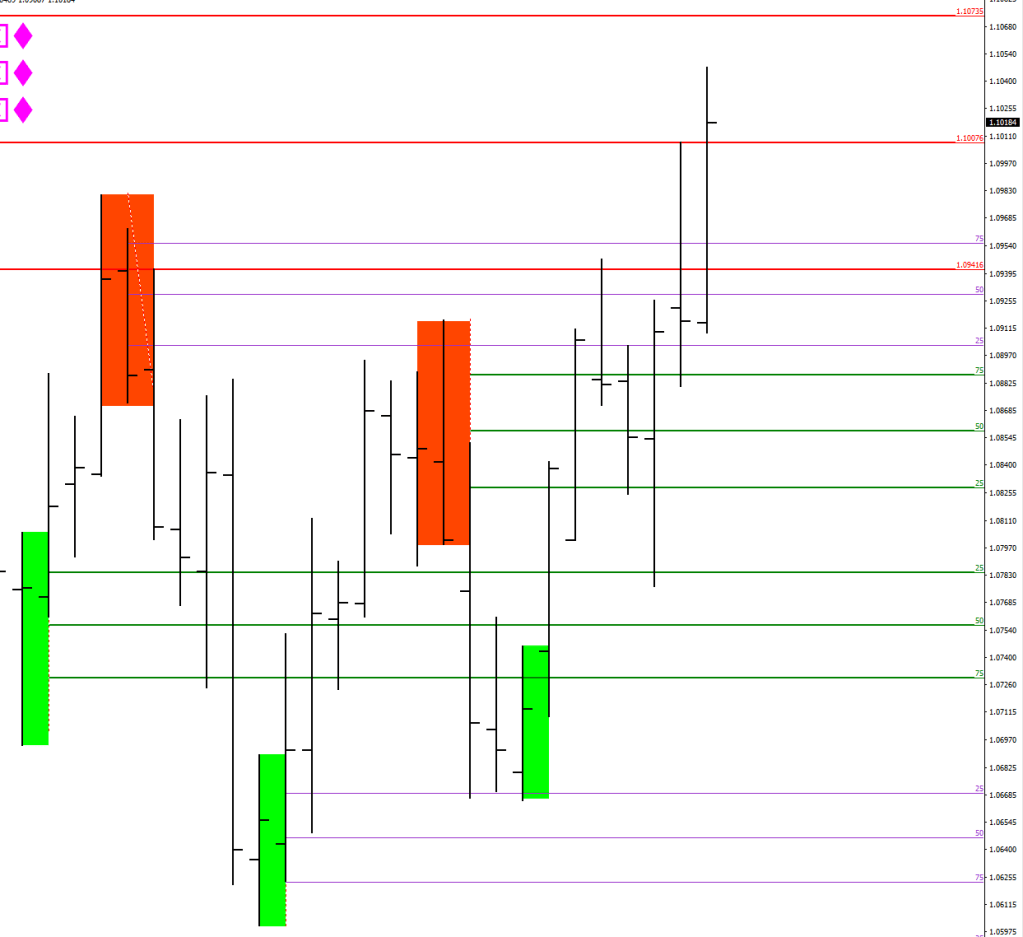
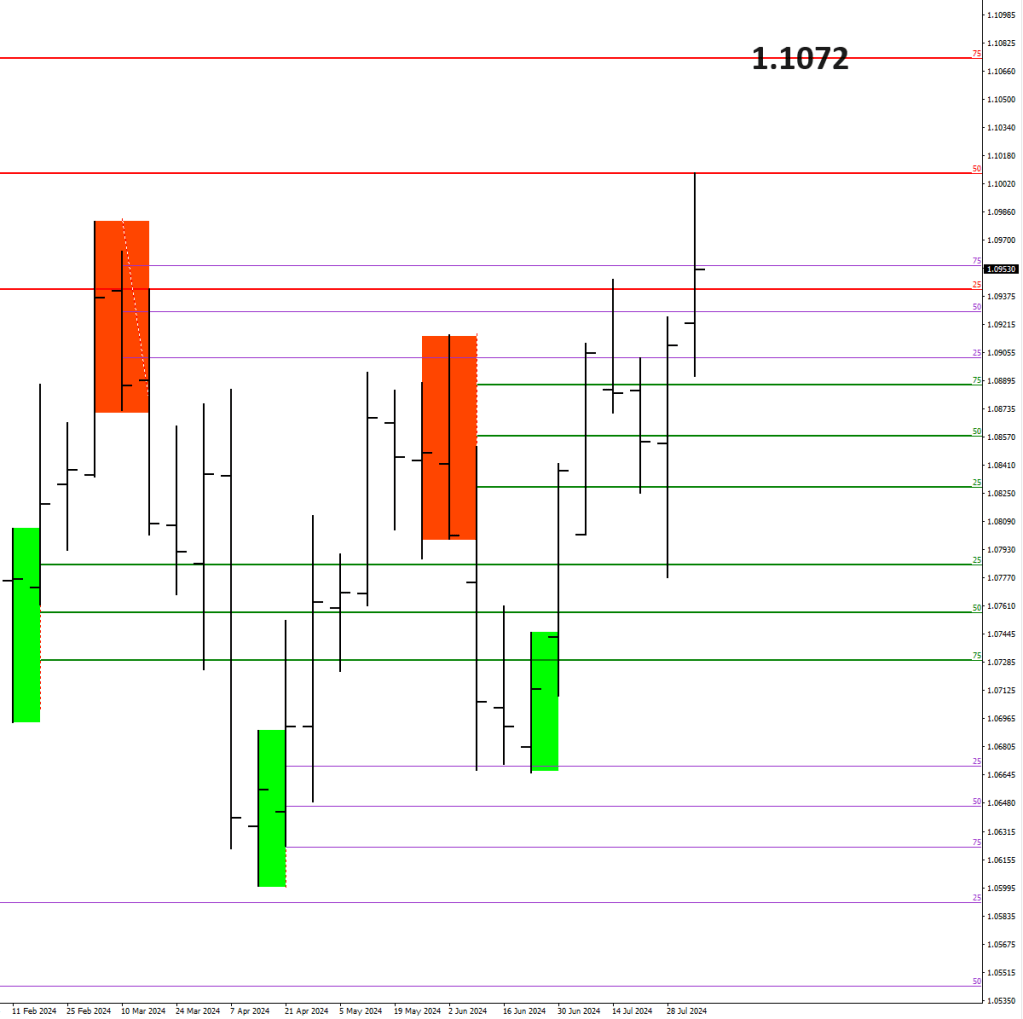
The next weekly resistance level is 1.10735.
The next long cover level is 1.1082. RSI2 is enough to make a peak of some sort.
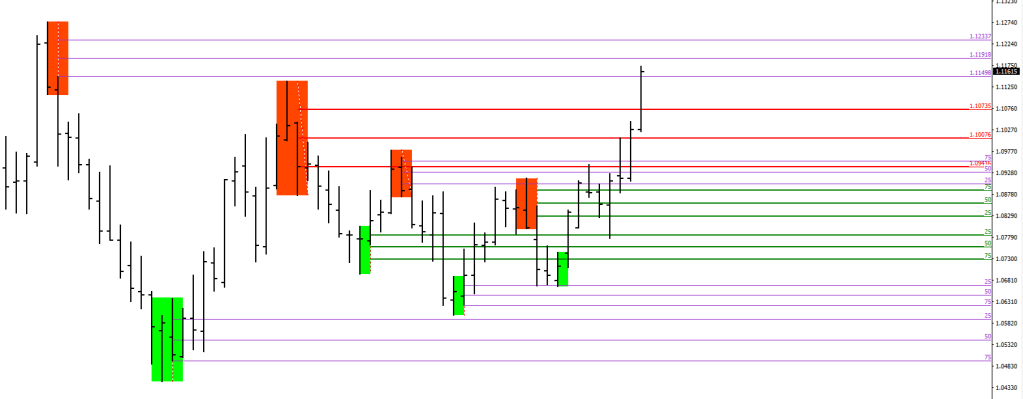
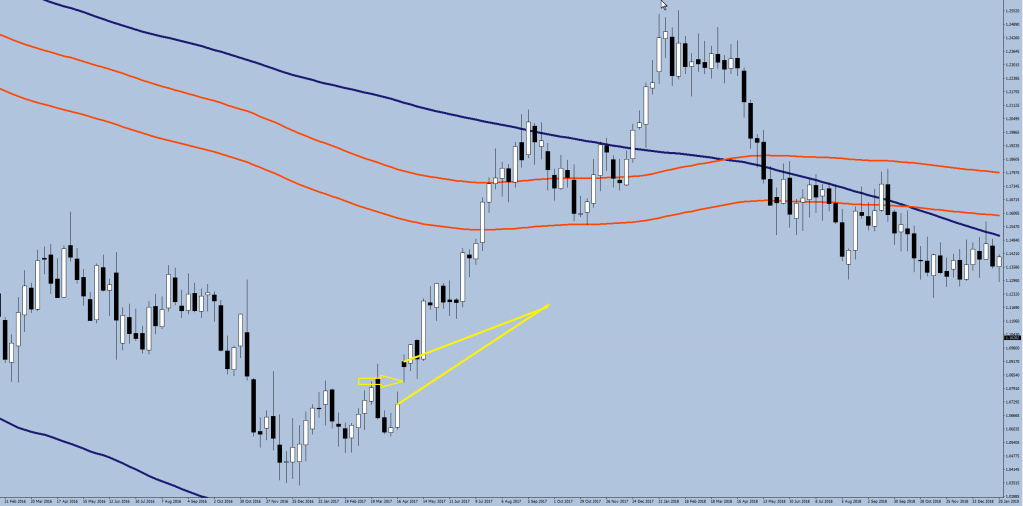
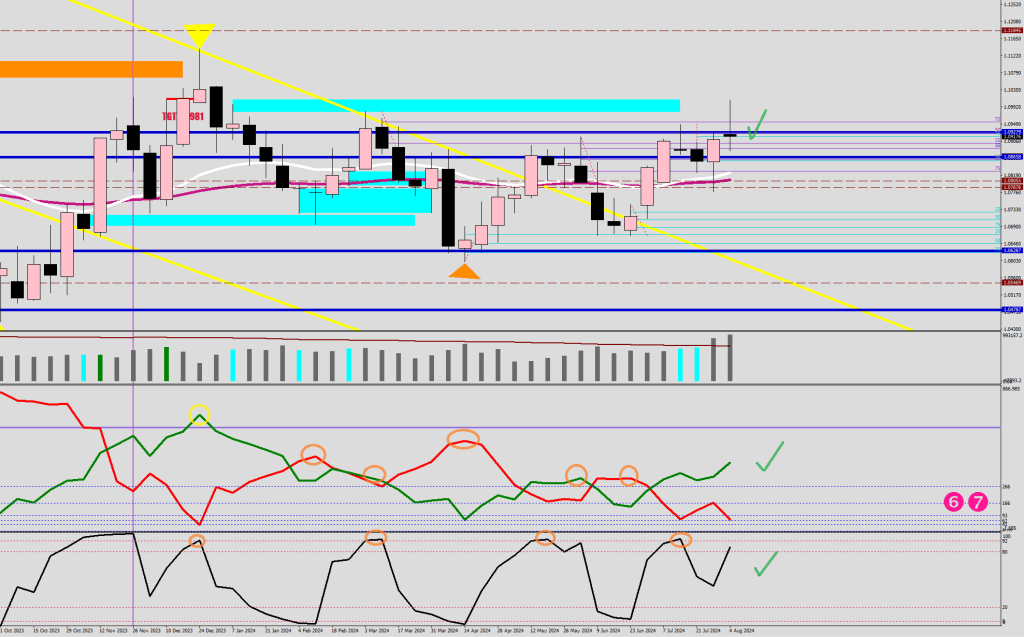
The case for an intermediate swing high printing next.
The volume had increased beyond the 100-week average for the last 2 weeks, the volatility compression lows are into the thick, sub-93 zone (orange ovals).
This would be associated with major swing under development, but I have a recent example of an intermediate swing (orange triangle). If I put another qualifying line at 457 pips (blue) the shortfall is only an extra 50+ pips, so an 1.1060-1.1090 high would be entirely in line. The last intermediate swing print came in at 516 (which would mean 110 pips beyond 1.1010 or 1.1120).
See there’s a problem with calling the current close down a finished swing high.
The close, albeit more than 91 pips, is sitting at the top of the prior swing high (at support) and there is no history of a weekly close down at a reversal closing up higher than the prior candle’s close.
You do not have a swing high.
…has not been closed below.
The gray, 3.8x fluctuation maximum line is currently around 1.1040. If the market was to gap up, or make a run for it, this could be the approximate location of the swing high.
Now, remember that the denominator is 9 days. 4 more days from now the sample’s lowest data point (daily median) would have moved to beyond 1.0915. The stretch line by then would be up to 70-pip higher (happens to be FOMC Thursday). 1.1110 again?
If the market were to finish where it is now, you would have a swing high in place.
The checklist: pink and black sequence, RSI2 having reached 92+, 266 pips from the 18-sample low, 91+ pips close down from the high on the first black weekly candle.
However, I can’t shake the feeling that it is not going to play out like this.
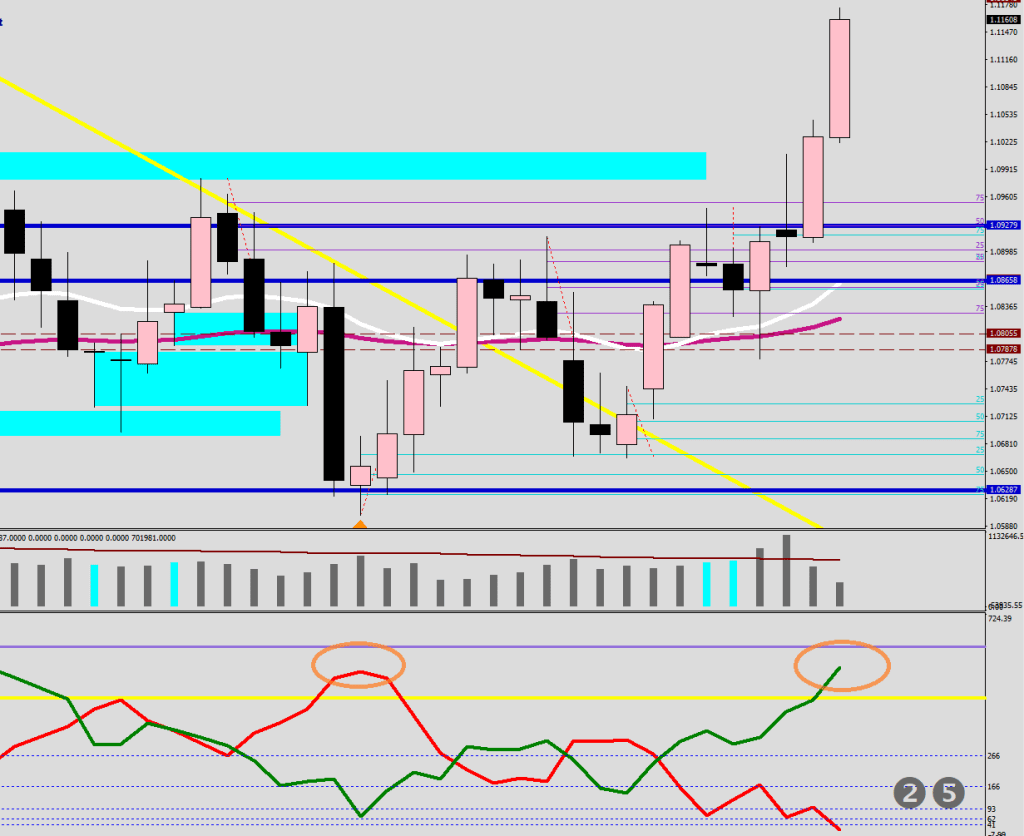
Onto the daily.
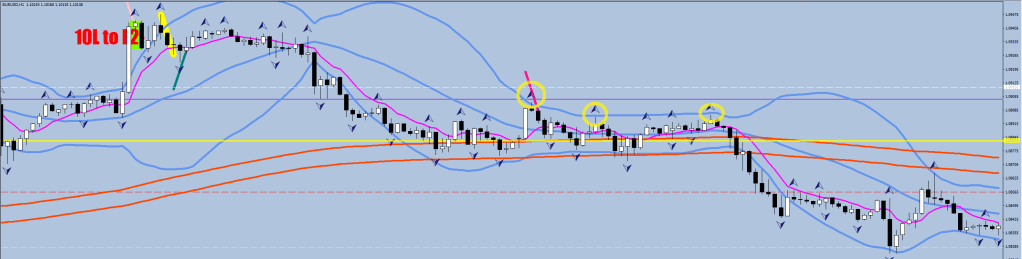
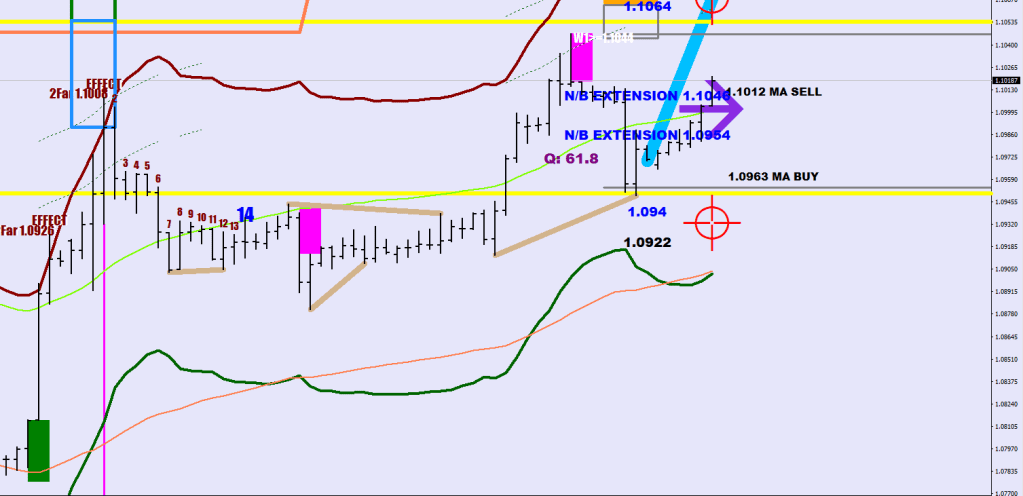
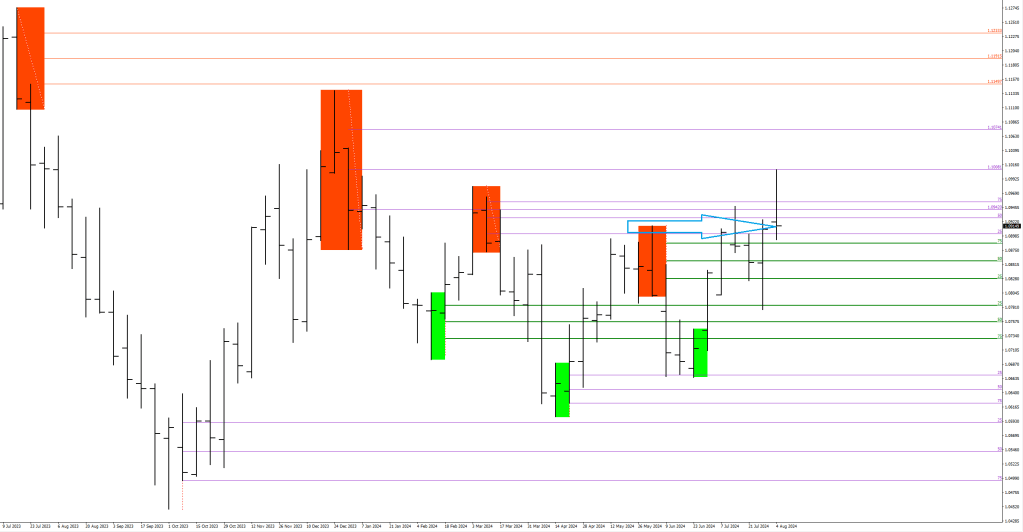
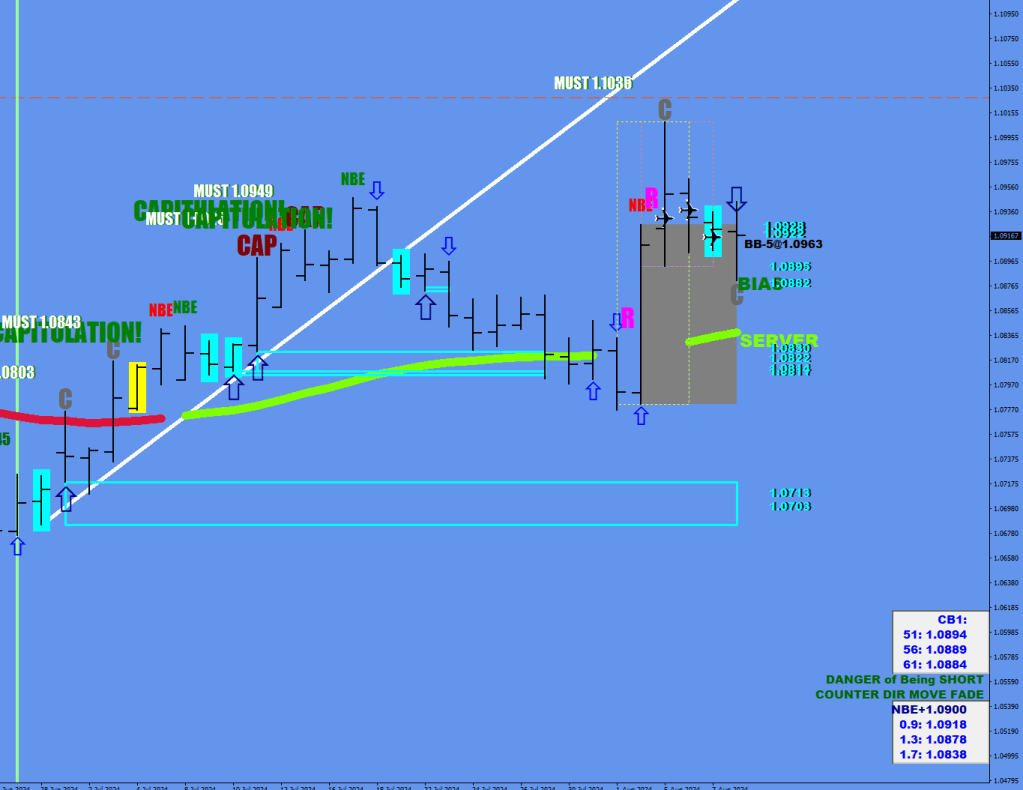
A bow back occurs when after a counter-directional move, the holdings start to re-establish their dominance.
The reason to pay attention to the most progression achieved by the bow’s 3rd day (and also the 6th) is that you would have a statistical edge by being able to plot a zone for an optimal exit.
These displacements come into play when the progression high gets tripped by say 5 pips to avoid a fake out, and this can happen on day 4 or 40 days down the road, the table/trap will remain set – come alone or come many.
In this image, you can see how methodically the previous high (1.1008) begets targeted intraday.
With the 5-pip tolerance deducted, you would arrive at a minimum 60-pip run to the closer end of the box, where you should be dumping all longs. If the move coasts on, scale into a short. Make the most of it.
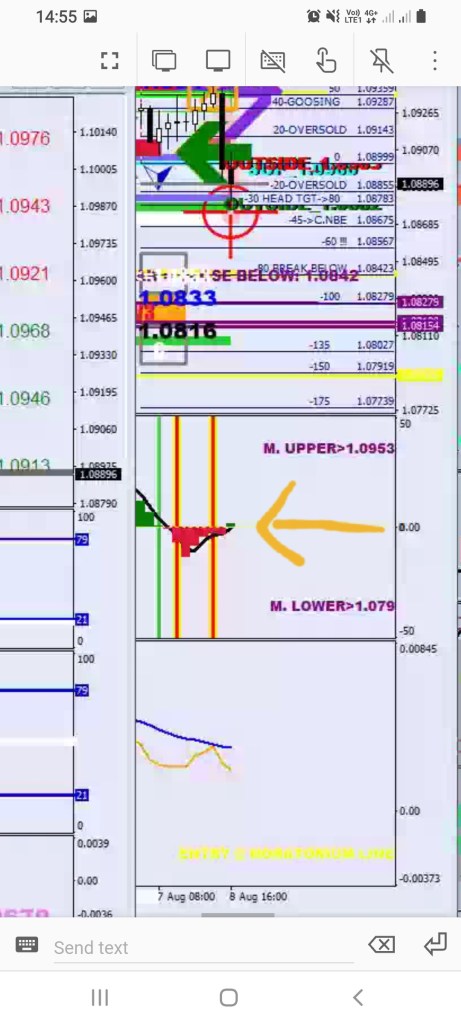
By the way, there was a 4-H money flow flip showing the 1.088x area with the inverted money flow print on the 4-H lower fractal real-time.
Also, it was like a ballet dance between the two volatility lines came together for a kiss.
Of course, I had to specialize in one single instrument first. Well, at least now I am certain that I should be looking for a Gray divergence, not a yellow one.