Yet I was not able to say that the Wave3 hasn’t ended yet, why?
When I did not know any better, so earlier today I was looking for a second leg up of a Wave 4. I wanted to trade in the crossed out fractals for a Beat. If you go back and look at all my thrust finder plots, there isn’t a single one that does not require the fractal to spike outside the 30 sample BB.
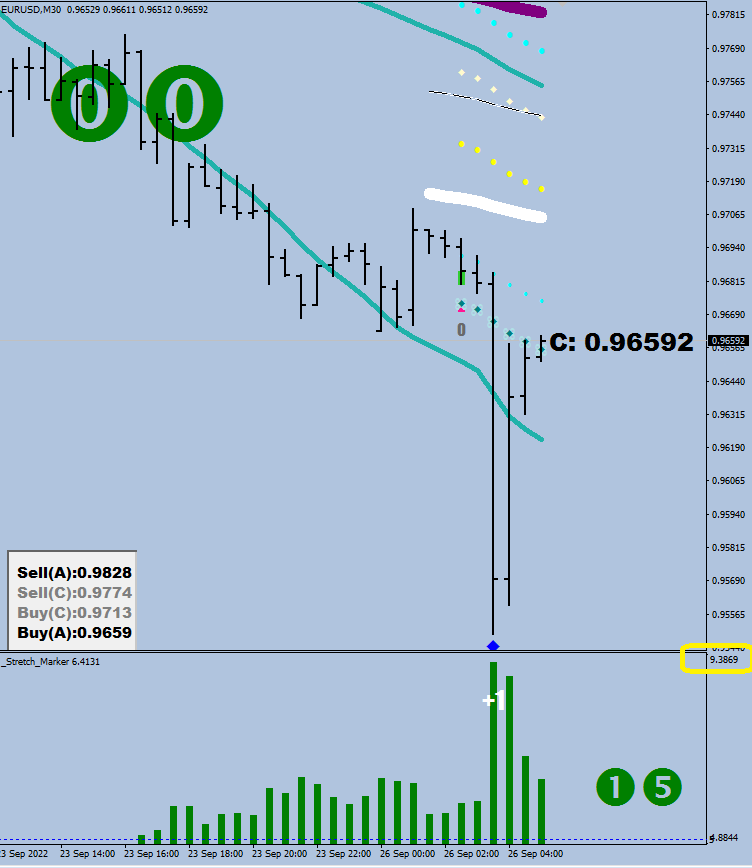
So, let’s play a quiz now.
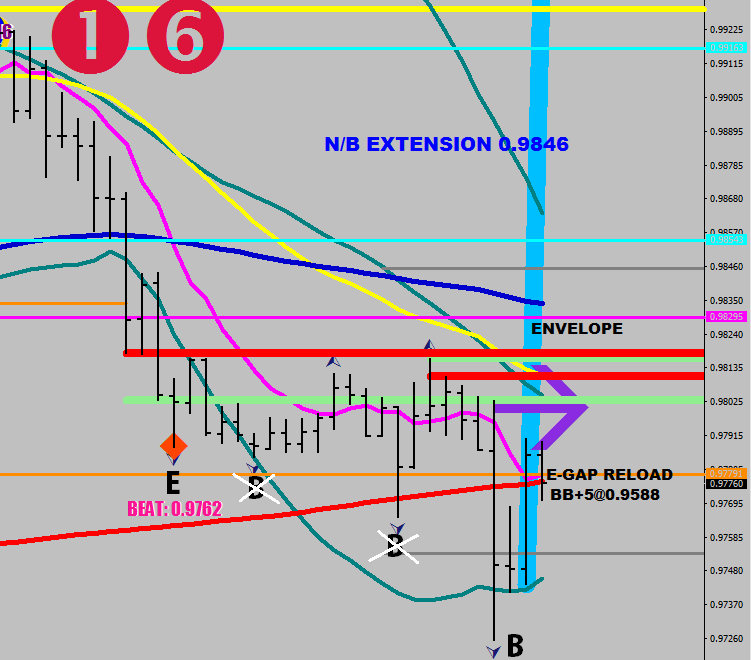
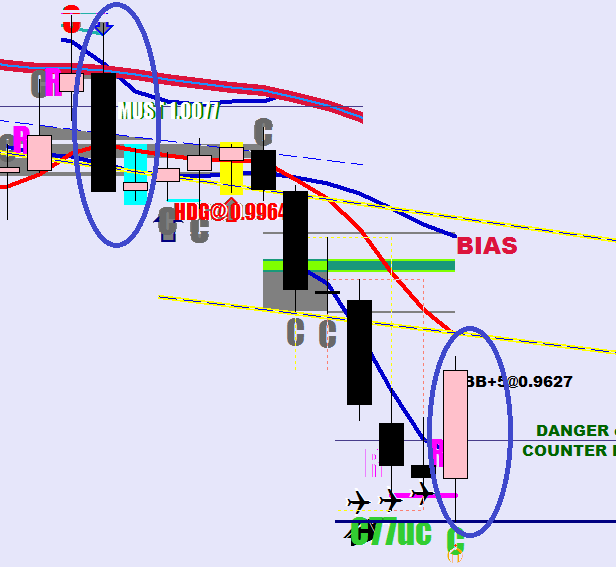
The nonfarm payrolls is due to come out today. The market just printed the second crossed out B fractal. You know that this is a Wave 3 down and you are still missing the Beat. You watch as they let the volatility bracket make its way leaving room for a spike in excess of 80 pips with 15-16 on the outside making for a great trap.
Does it matter what number the news would bring when the market is set up to make this trap-round-trip? Do you really think that there could had been any different outcomes other than finishing the Wave 3?
All beats & thrusts have to prove max volatility effort by going outside the BB30
I was looking for the it’s braining, man song and found this instead.
YouTube is a goldmine. This reminded me when my daughter was 3 years old and was singing, “Nationwide is on your side”. No it didn’t.
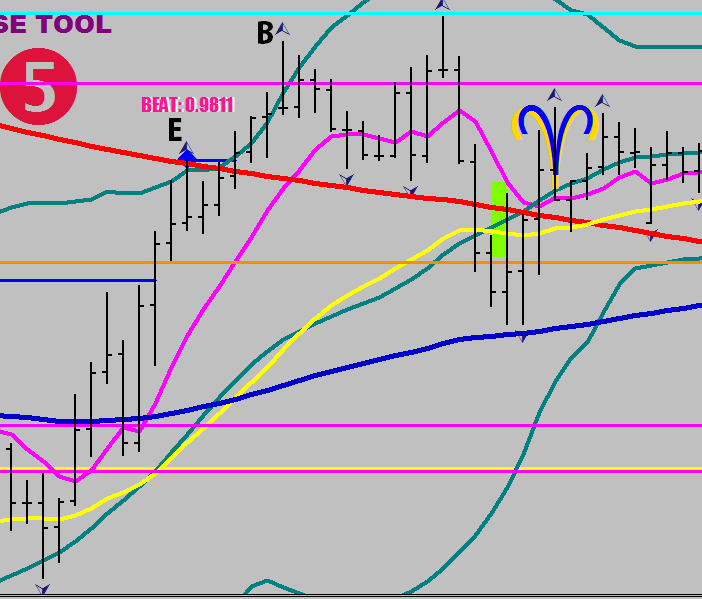
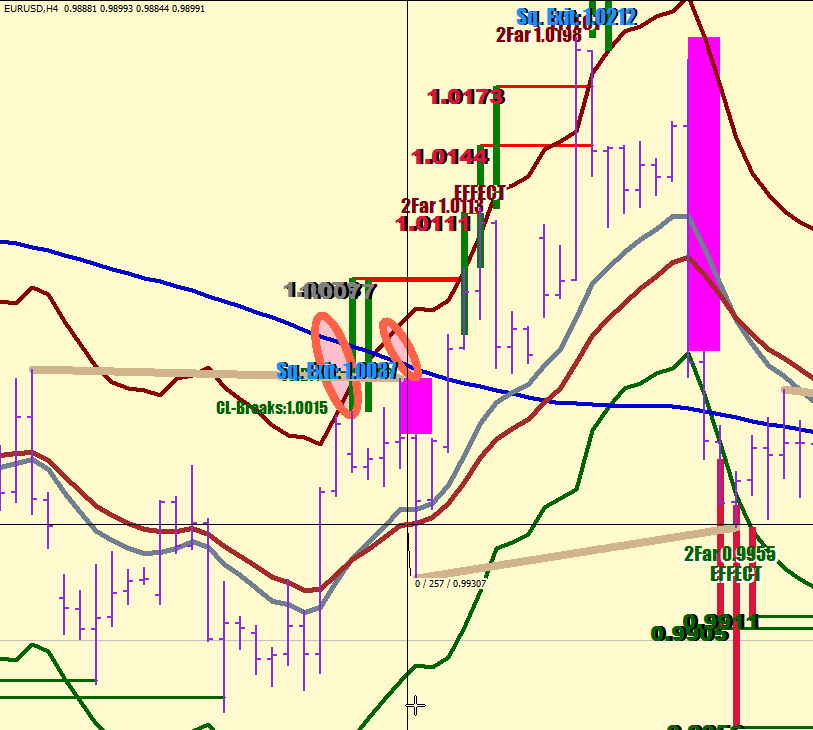
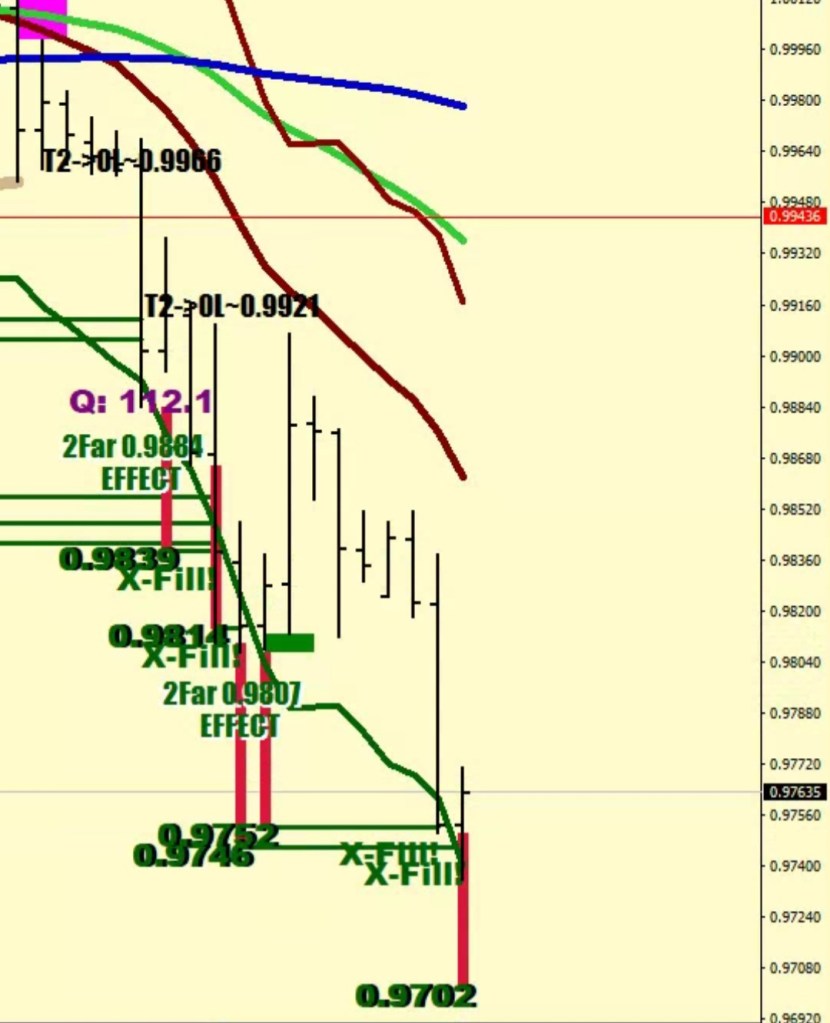
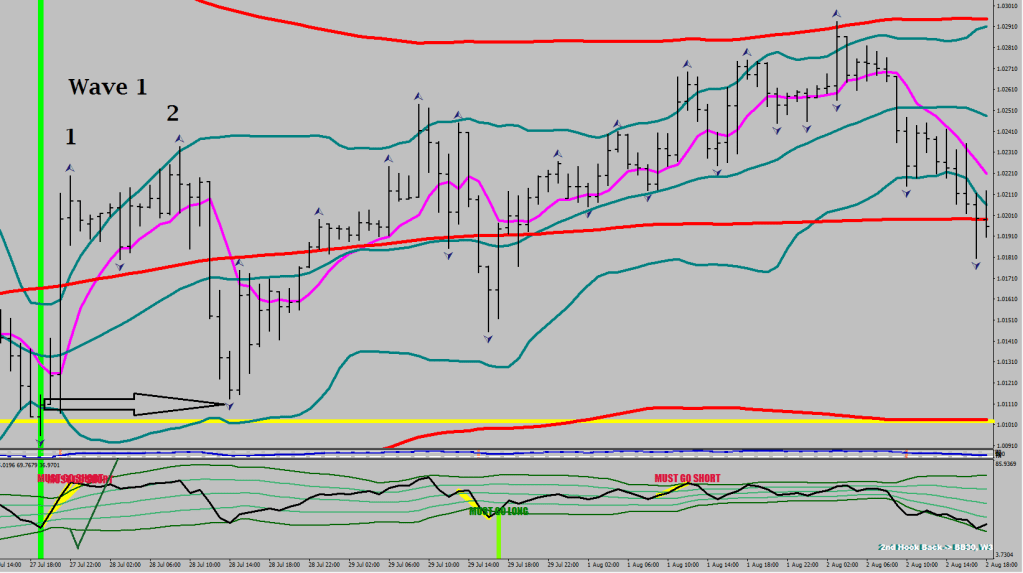
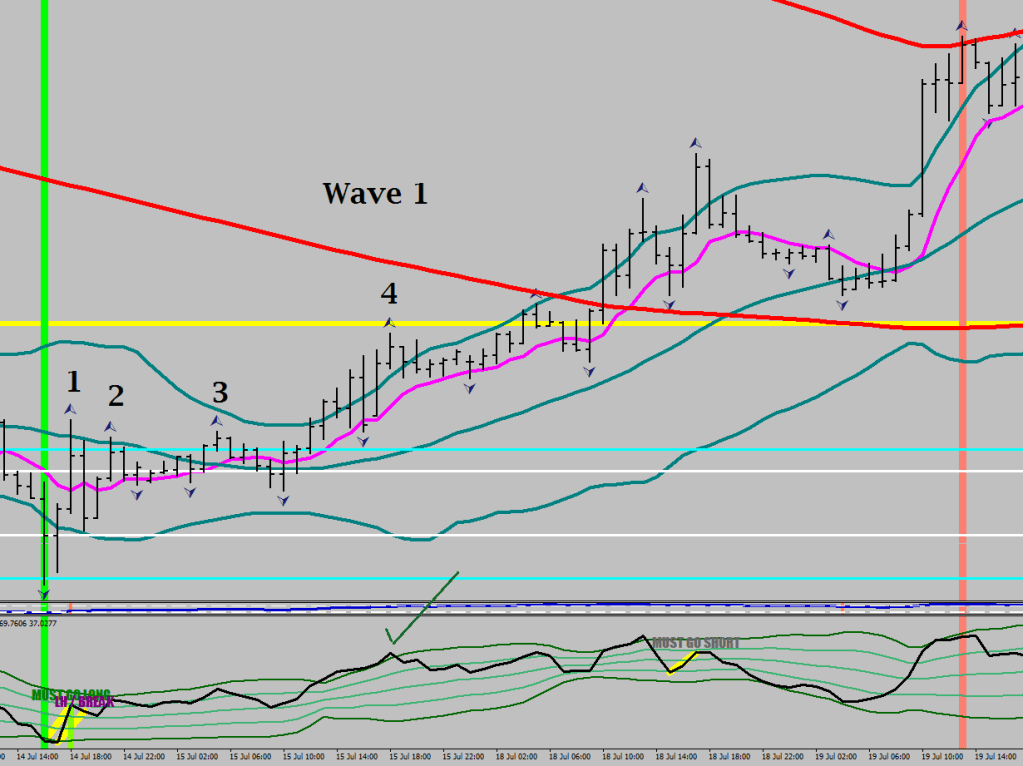
First, two incredible target projections for two different Wave ones.
It is important to throw in some values here and there when you are spending half of your time with suicidal thoughts.
Now, let’s move on with the liturgia. I am a moving averages guy. Who would say something like that in this day and age? Total retro stuff.
I have the means to figure the end point & get a fill for a Wave 1.
What can I do about a Wave 2?
I can plot an 11 & a 17-sample HL2 EMAs and perhaps a 52 on the 4-hour and notice that price often makes a false move away from this band to the tune of up to 25 pips and these points tend to be the best entries and these entries tend to coincide with Wave 2 terminal points.
25.7 pips26.4 pips
Typically, there would be a spike into the Overdrive bands made by a Wave 1 into the new direction.
16.4 pips? I’m not saying not to scale in starting from the outer MA or even from between them.25.1 pips.
This however is the idea behind placing the bulk of the volume 22-pips out.
Overdrive bands calculation

E32L[i]=iMA(NULL,0,8,0,MODE_EMA, 1,i);

ODU[i]=E32L[i]+FMax*23.5*Point;
ODD[i]=E32L[i]-FMax*22.5*Point;

where FMax is 6/5 FSize and the FSize is 32

double FMax = FSize*6/5;
The downside is more of a mix of conditions, not a displacement.
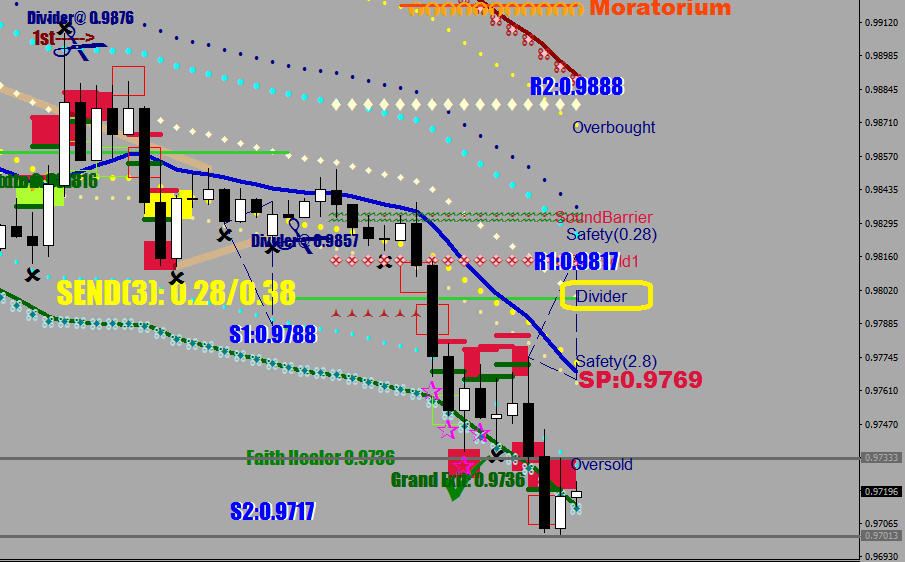
So this so called “C” was suspiciously impulse looking with that EBT structure.
Wave 4 ended in a 4-hour continuation divergence. Everything stayed over the 120EMA (in Blue). Think of the first low as the stochastic bracket’s low, and the re-visit as buying the oversold.
Wave 2 is a bow back to volatility had broken or where volatility breaks
Wave 4 is a bow back to beyond E32, a scare on a previous swing high / swing low fractal
B stays within 1-2 STD on the RSI while going beyond E-32 with opposite OS/OB BB location
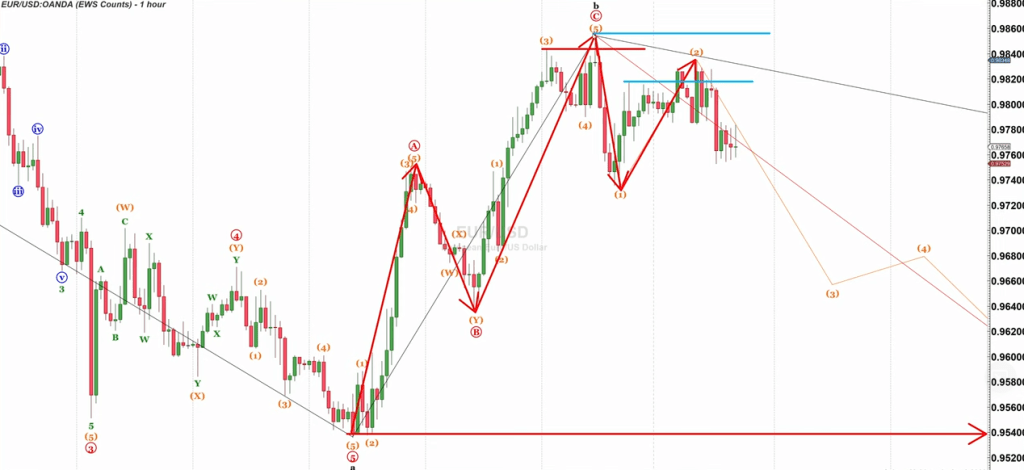
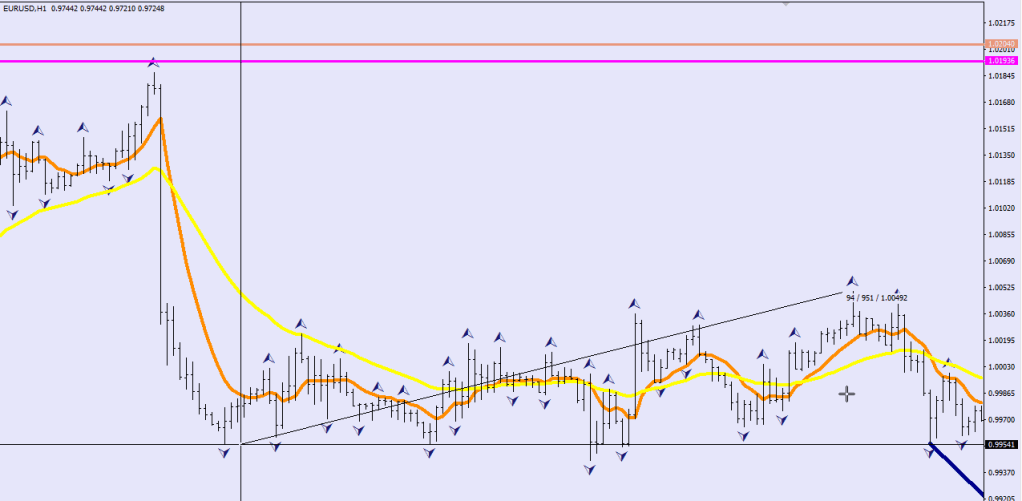
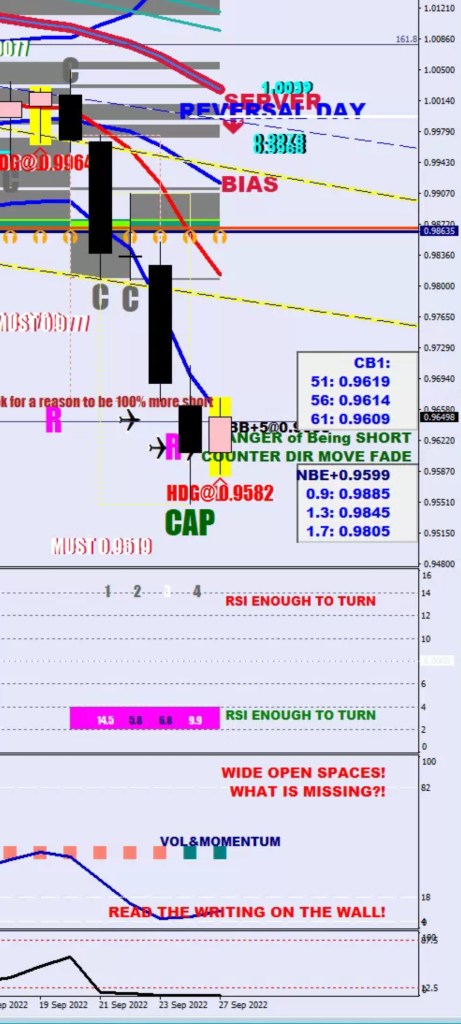
This was an ABC move up. What next? There was a liquidity grab with the cut above, the bias is down.
Is this ABC a Wave 1 up or would there be a Wave 1 down from here? Another bow back up first?
Ok. Let’s explore the continuation first.
Where would Wave 2 go to given the early definitions?
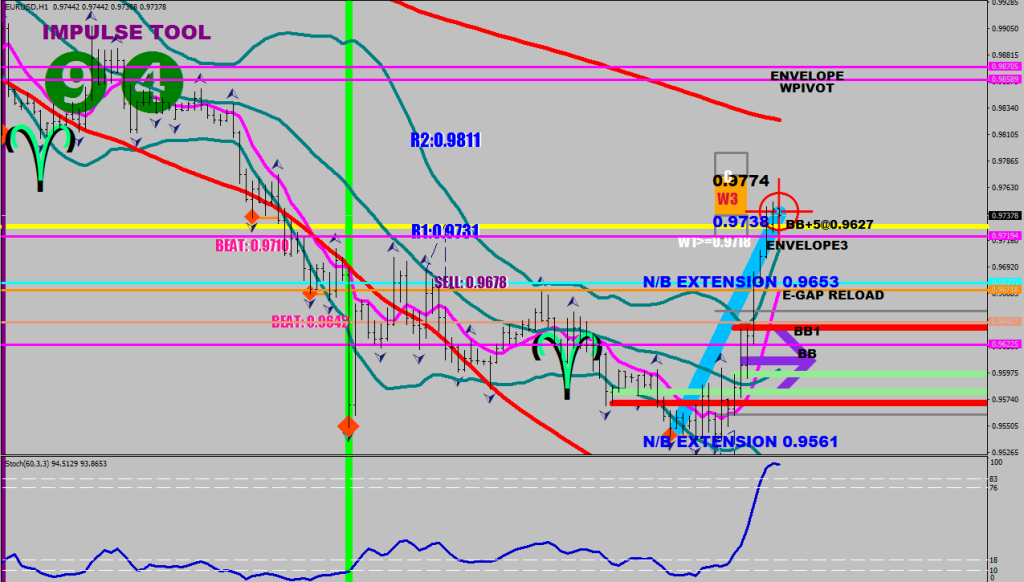
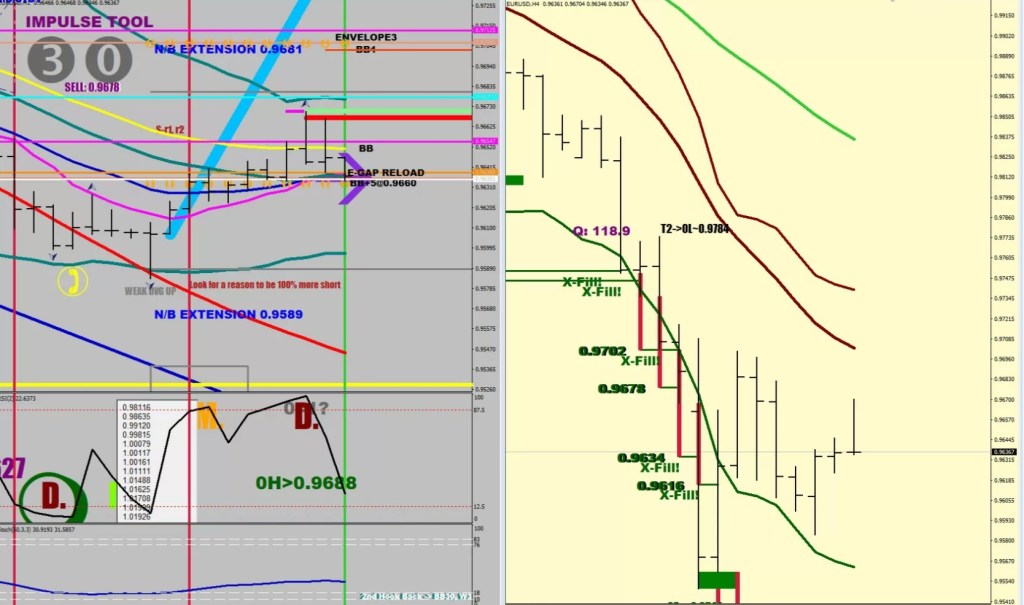
Just by chance the Goldilocks line is going across that hourly close where the volatility was broken: 0.9678. For a continuation move I would give 40% chance of this playing out.
Taking out the swing low that B made would be an extra liquidity grab (thick red line at 0.9635). For a continuation move I would give 55% change of this playing out.
As it stands, due to the volatility squeeze, it would not take much to break the volatility bands, therefore even a dip below the current swing low (thick green) at 0.9733 would work in combination with the previous swing high close (3rd fractal cyan line) may be a buy. I would give 5% chance for this to be playing out as a continuation move and closer to zero in the absence of Daily Upside Embedding.
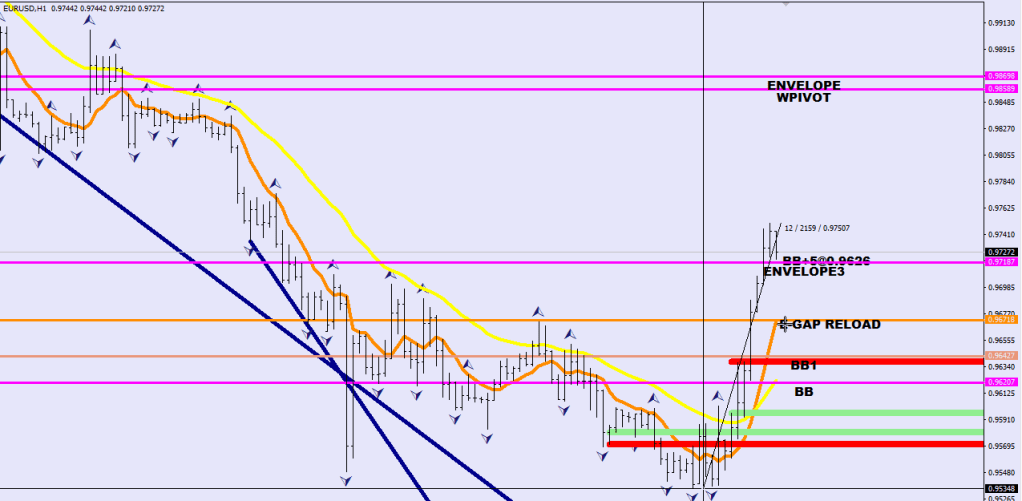
If we get a bow back up first especially, we could see a full Wave structure to the downside. This could be yet another 5-wave sequence. I’m afraid the RSI bands are not wide enough for a sideways ABC movement. A typical ABC has similar length A and C legs and the RSI bands are holding cozily at 2 SD.
A Wave 1 down would most likely end after 2 fractal prints outside the 30-sample BB.
Example:
I personally don’t think that you are going to see a new lower low unless the whole world becomes unglued.
Frankly, this current move down is a failed Wave 1 attempt, it does not qualify for a Wave A and I do not see how any structure could be started from here without bowing back a little further up to at least .98318 first / outside the upper BB.
Could this start motoring up with a Wave 3 from here? Not without the aforementioned 5% chance single fractal undercut of the thick green.
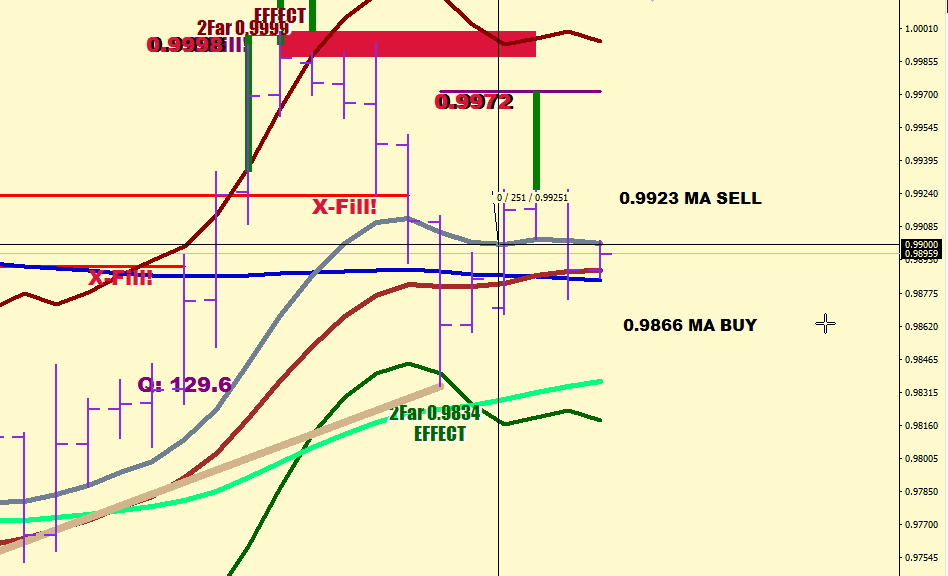
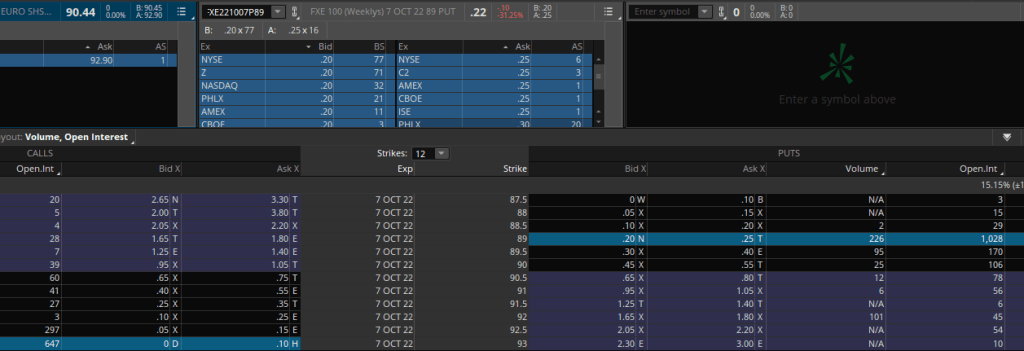
For the 7th of October, the close should be below FXE92.5 and above FXE89.
Most money lost would be at 91, which translates to .9850+
I’m telling you how things work for real. That’s all I ever do.
Back on the DM track
Charms in limited supply
Firstly, not all waves / moves end up being part of a wave structure.
Wave 5 ended with a thrust and since the volatility has been bending price back and forth.
Thrust the Green.
The highlighted filter picks up this last one.
  if (Close[i]>iBands(symbol,0,30,2,0,PRICE_MEDIAN,MODE_LOWER,i)-100*Point && Low[i+2]<iBands(symbol,0,30,2,0,PRICE_MEDIAN,MODE_LOWER,i+2)-120*Point && Low[i+2]>iBands(symbol,0,30,2,0,PRICE_MEDIAN,MODE_LOWER,i+2)-960*Point && Low[i+2]<iLow(symbol,0,iLowest(symbol,0,MODE_LOW,95,i+3))
  && Close[i+4]>iBands(symbol,0,30,2,0,PRICE_MEDIAN,MODE_LOWER,i+4)-100*Point && iStochastic(symbol,0,60,3,3,MODE_SMA,0,MODE_MAIN,i+2)>2

// small decline of bands, 8EMA back 56-64 pips && daily stochastic greater than deeply oversold
 && (( (iBands(symbol,0,30,2,0,PRICE_MEDIAN,MODE_LOWER,i+14)-iBands(symbol,0,30,2,0,PRICE_MEDIAN,MODE_LOWER,i+2))<200*Point
 && iMA(symbol,0,8,0,MODE_EMA, PRICE_OPEN,i+2)+640*Point>Low[i+2]
 && iMA(symbol,0,8,0,MODE_EMA, PRICE_OPEN,i+2)-560*Point>Low[i+2]
 && iStochastic(symbol,0,60,3,3,MODE_SMA,0,MODE_MAIN,i+2)>9 && iStochastic(symbol,0,60,3,3,MODE_SMA,0,MODE_MAIN,i+2)<19)
 ||
// tight bands
 (((iBands(symbol,0,30,2,0,PRICE_MEDIAN,MODE_UPPER,i+2)-iBands(symbol,0,30,2,0,PRICE_MEDIAN,MODE_LOWER,i+2))<540*Point && Close[i+2]>iBands(symbol,0,30,2,0,PRICE_MEDIAN,MODE_LOWER,i+2)
// or oversold RSI14 and not deeply oversold stochastic (wave 3 beat)
 || (iRSI(symbol,0,14,PRICE_MEDIAN,i+2)<20 && iStochastic(symbol,0,60,3,3,MODE_SMA,0,MODE_MAIN,i+2)>10)
//or stoch coming out of deeply oversold, above 8
|| (iStochastic(symbol,0,60,3,3,MODE_SMA,0,MODE_MAIN,i+2)>8 && iStochastic(symbol,0,60,3,3,MODE_SMA,0,MODE_MAIN,i+2)>iStochastic(symbol,0,60,3,3,MODE_SMA,0,MODE_MAIN,i+3) && iStochastic(symbol,0,60,3,3,MODE_SMA,0,MODE_MAIN,i+3)>iStochastic(symbol,0,60,3,3,MODE_SMA,0,MODE_MAIN,i+4) && Low[i+2]<iBands(symbol,0,216,2.5,0,PRICE_MEDIAN,MODE_LOWER,i+2))
)

// 8-EMA at least 19 pips above BB
 && iMA(symbol,0,8,0,MODE_EMA, PRICE_OPEN,i+2)-iBands(symbol,0,30,2,0,PRICE_MEDIAN,MODE_LOWER,i+2)>190*Point ))  ){
New legs came from the E-32, final pushes came from the E-8.
A thrust can have an undercut, no problem. This typically won’t be more than 12 pips. Beyond 20 pips something else is happening, so use a moratorium of this size.
Here you can see that the 20-pip moratorium was never crossed by the undercut of the Thrust.
That indefinable nothing
Embedding is a promissory note for a Lower Low or a Higher High – or else the embedding itself has to cease to be.
Daily embedding explains why it was a safe and logical bet to see a lower low after the inside day.
It had to happen
The upper oval move’s mirror image is what is happening now.
Finding the right words – ending a problem
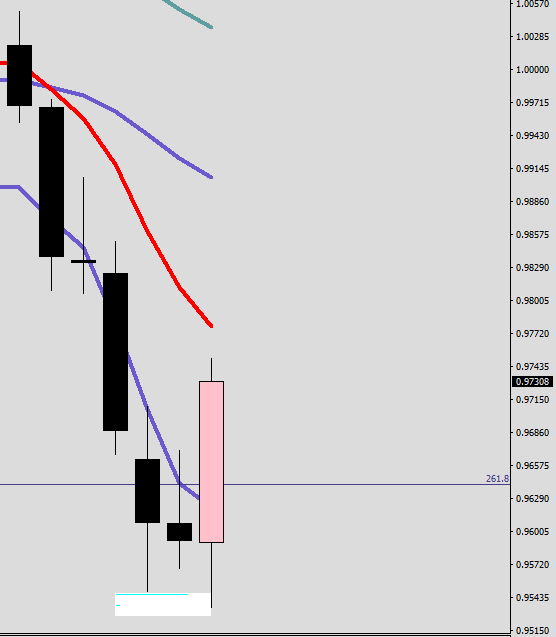
Curiously, the 109 swing low & swing high displacements (dermia lines) almost coincide at 0.9646 and 0.9640.
After a swing high is made, a swing low would be necessary.
The first, maximum volatility move was 240 pips long. Since the move put the price below the 9-day EMA at once, I think an extra 30 pips was gained beyond the 210-pip usual upper limit. The Swing high was only made 3 days out and the retracement was 95 pips. Now you see why I used to have a rule of not fading within 150 pips of the high / low: price never re-visited that trap area. This current move has made it to 216 pips so far. It has not yet taken out the mean, but is above the Guard rail.If the high is in, a 95-pip retracement would put the low at 0.9655.
Bob was the name of a dragon I invented back in school.
Always was a bit more abnormal than weird. Personal preference.
They may want to kill the 92 weekly puts this Friday on FXE. Scratch that, that’s 300 pips up.
Probably gonna expire a smidge lower than it is after a new swing low and back. Above 89.5 by 1 hour before the close.
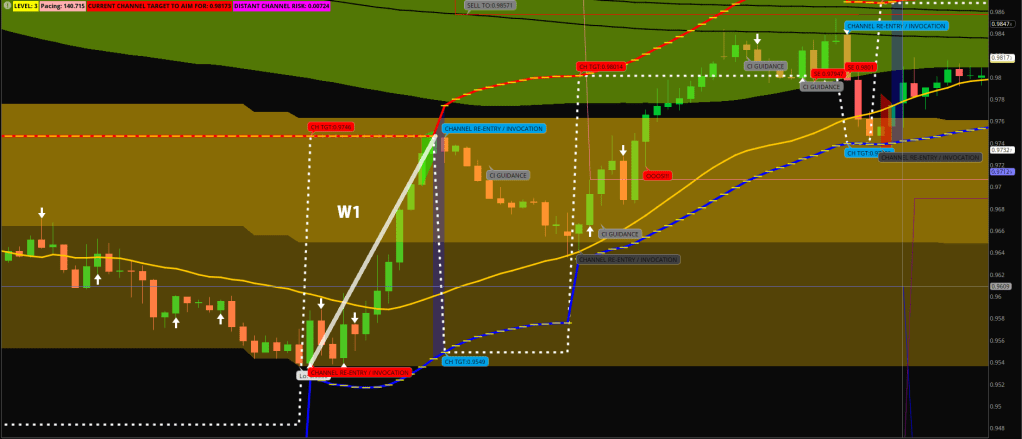
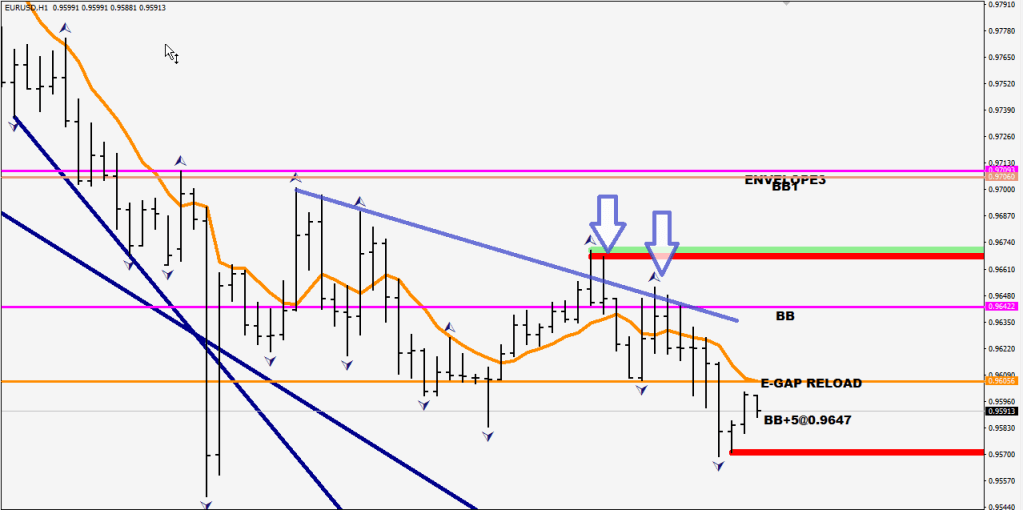
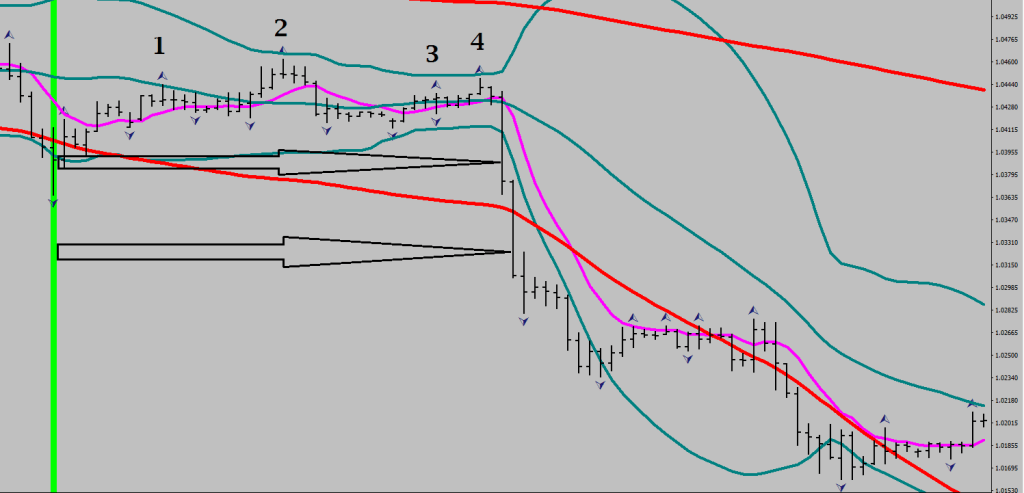
If you manage to identify the gap correctly, you know where you are and what’s the game plan should look like.
From the arrow on the bottom to the swing high there was 138 pips.
1. Exhaustion gap spotted
2. Wait for price to pull back beyond the 8-hour EMA of opens
3. Aim for at least 138 pips from the entry area to the furthest fractal print.
From the upper arrow to the swing low there was 160 pips.
4. Wait for two outside fractals to appear in a declining order and draw a trendline. Every time the price exceeds this line you get an entry for the bow back target.
This is now upside down to understand my points better.
5. The bow back is shaped by the volatility first compressing then starting to expand. The bow target is in the neighborhood of the closing price (average closing price) of the swing point’s hourly candle / candles.
If this makes a smidge more sense to you than an Elliott Beethoven looking for a beat of the swing point for an entry, clap your hands!
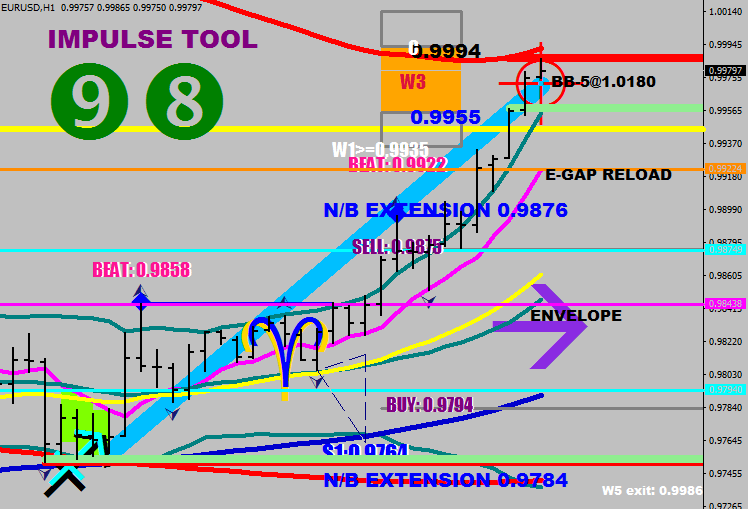
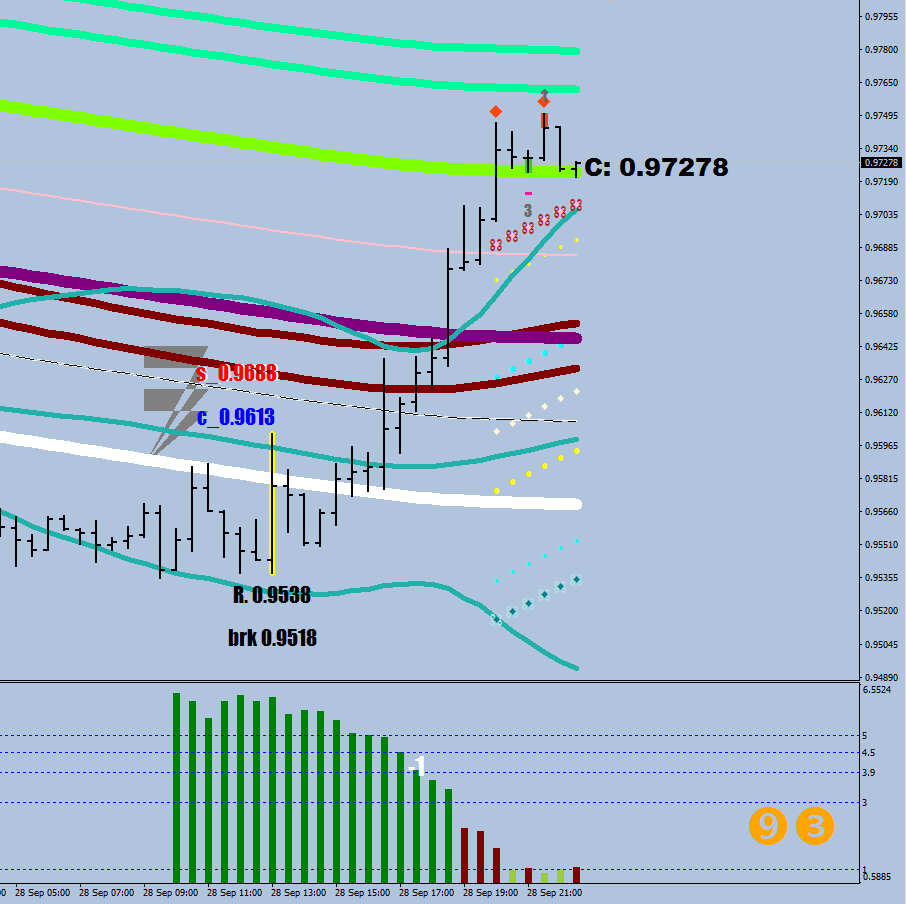
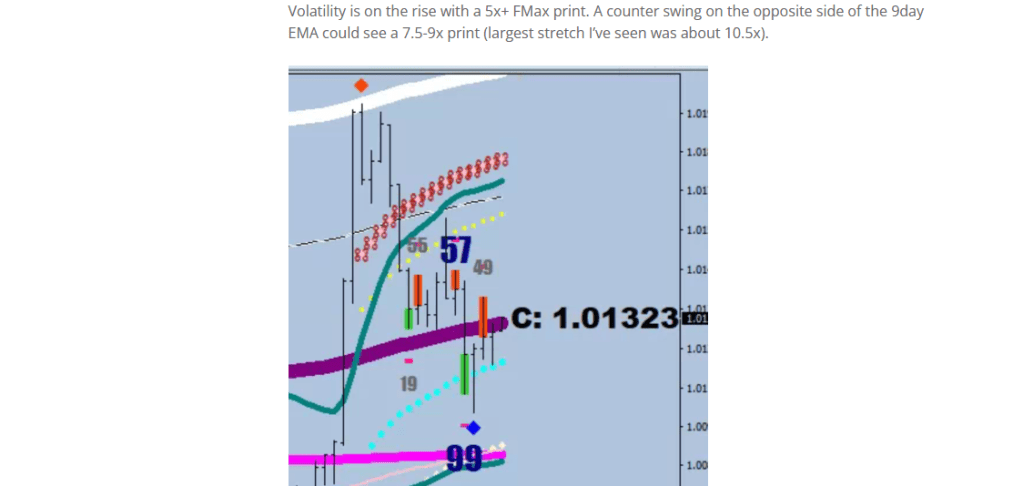
A Cap does not re-paint, it does not care about candles on the right. The only spin that can be added here is grabbing more liquidity by doubling down on the Cap. The momentum is up already.
So, let’s consider this move & close above the 5x stretch marker to be a fake out. That would be diabolical, like a Strictly Come Strychnine or a Volatility striptease-reprise.
Measuring leg + Divergent leg = ABC correction.
Volatility can have an arousal again and you can get your game on.
Every hiss begins with hey. Parent Guarded Rating.
Snauzilus,
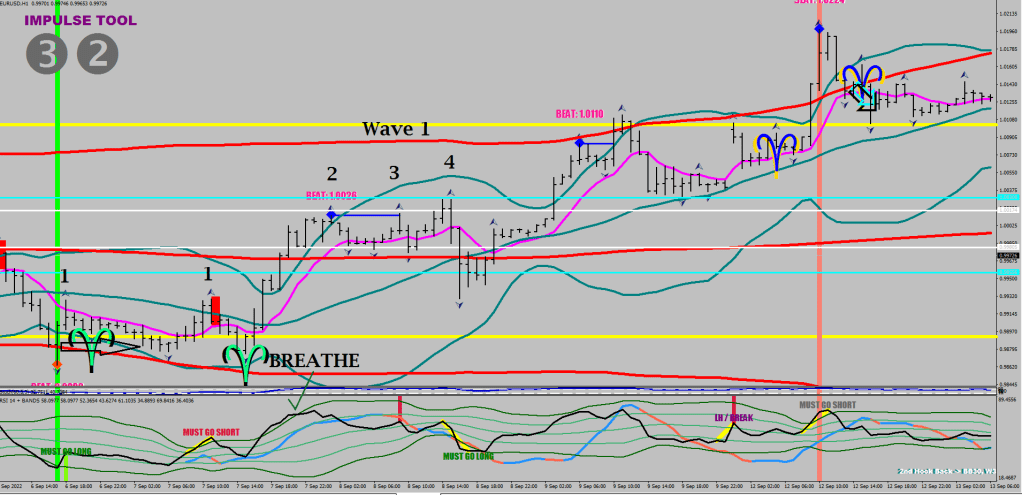
the difference between the Thrust and the Beat is that they are both squirts, they both end up in a very volatile relationship somewhere outside the Bollinger Rainbow (BB30-2.0SD in Teal and BB216-2.5SD in Red ). A beat is not the final squirt, but all of these talk about temporary weakness after a concentrated hot mess of blood.
Eaton,
Don’t mess around with those digestives! A Thrust tends to come from beyond the Divider Line (E32HL2 hourly).
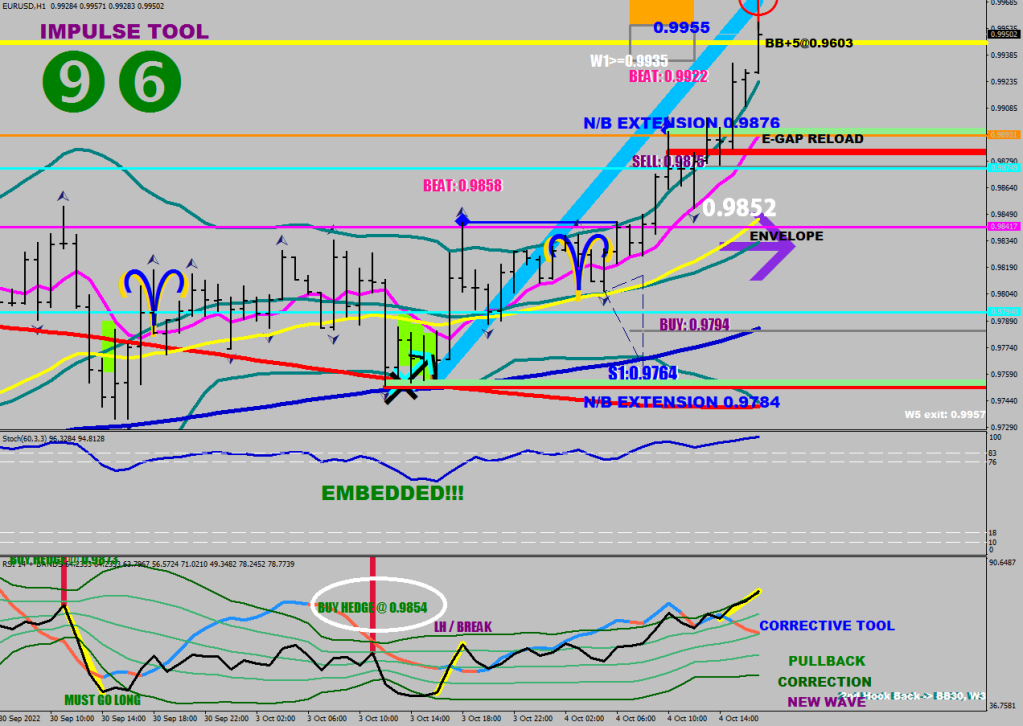
So what exactly is happening right now?
We have discussed already how a Wave 1 looks like.
The first two outside fractals (F1 & F2) in the oversold drew a trendline.
It is blue, because there was an acceleration between these points: people went net shorter.
The Wave 3 ended in a Beat that pierced the trendline.
Wave 5 arrived from beyond the E-32 as was discussed just now, and it is going to end in a Thrust that is going to fall short from the acceleration-trendline. Why? Because holdings became less short in the meantime. Relative weakness, remember?
Beyond 4.5x fluctuation maximum stretch you are pushing your luck. See a few entries earlier where I spoke of the swing out to the upside from the Mean, the numbers and the ideas of where the counter-swing may get to.
One by one. You already triggered two counter-effects, this would be the 3rd.Cap by Cap oooh babe, gonna get to you girl.
This is measured by the 30-smaple Hourly HL2 Bollinger Bands where a 36+ pips outside would qualify,
2. Relative strength hitting new wave territory
This is is measured by the 14-sample RSI’s 2-standard deviation bands as limiters.
In general these events above should occur within 2, maximum 4 hourly fractal prints.
If only one or none of the criteria happens, the Wave 1 attempt is considered a failure, price has to return to the Opening / Closing price of the last Thrust, form where a new Wave 1 attempt can be conducted.
Examples
1-2-3, 1-2-3 DrinkA late bloomer with no keel back.Surprise, cockfags! I ain’t never coming home!
I had a Buggy for a while, a VW Bug conversion in Red with a soft top.
I wanna jump start my chandellier…
Thrust Bow back (5 waves back) to closing price Wave 1 to achieve 36 pips+ beyond BB30 & New Wave RSI Deviation print Wave 2 back testing into the bow Wave 3 E&B Wave 4 scaring / back testing W1 fractals Wave 5 ending in Thrust