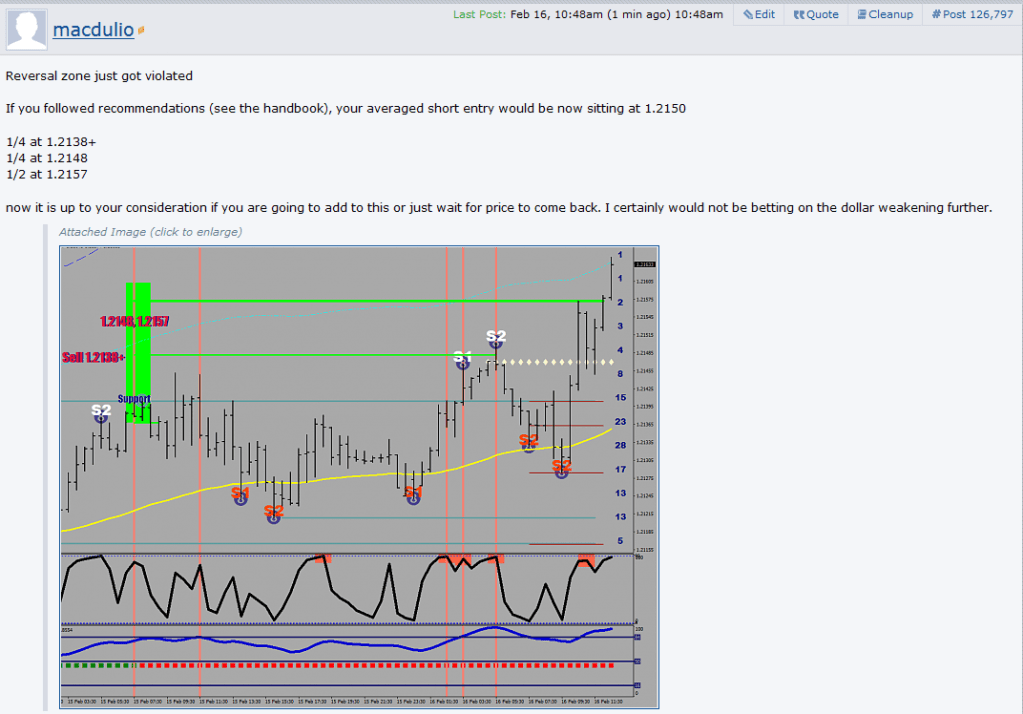
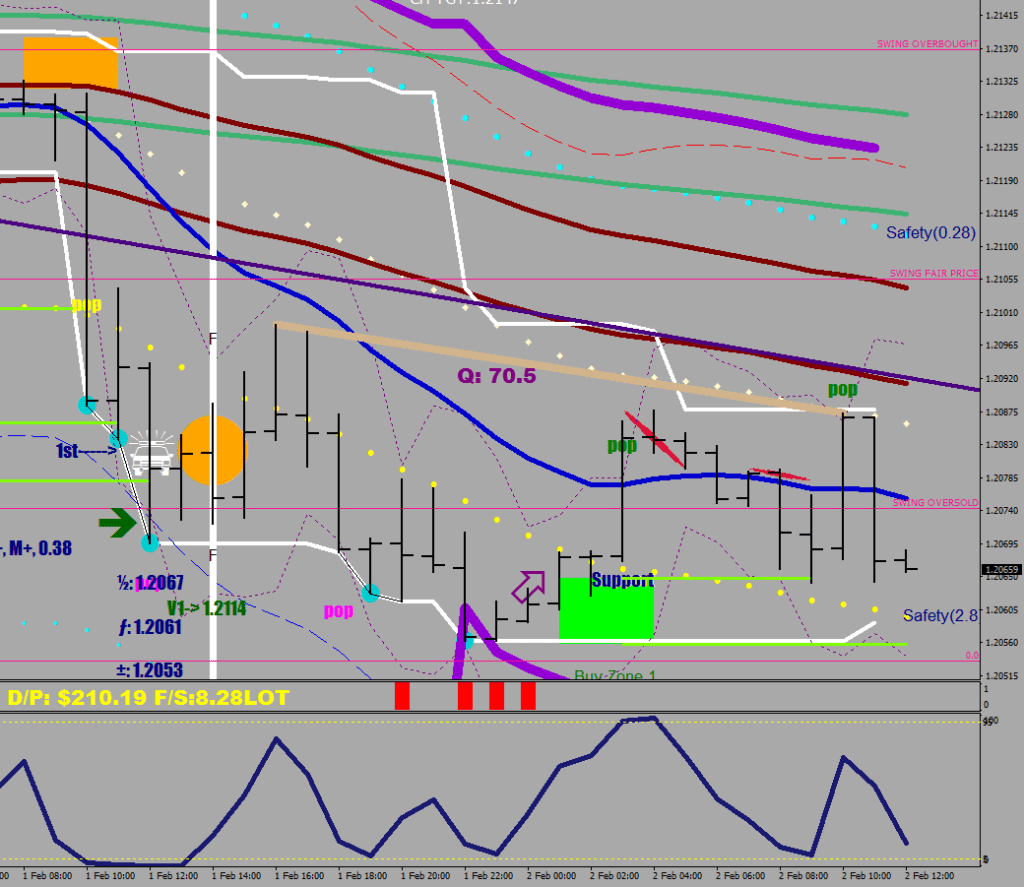
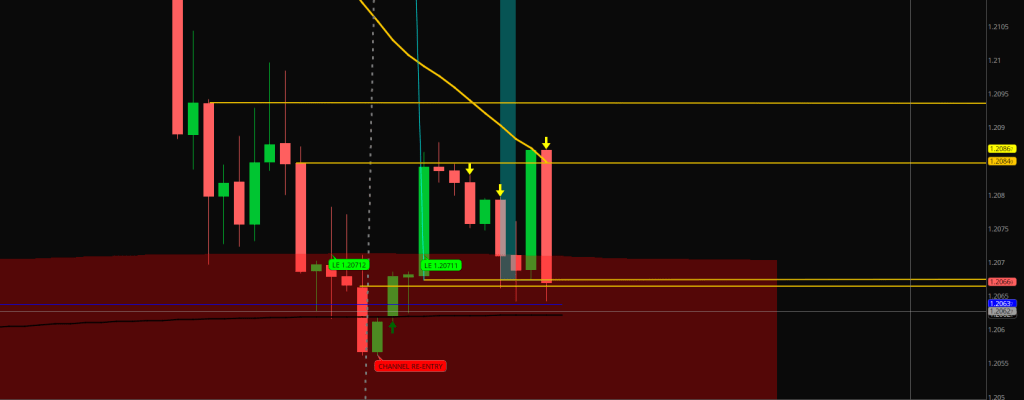
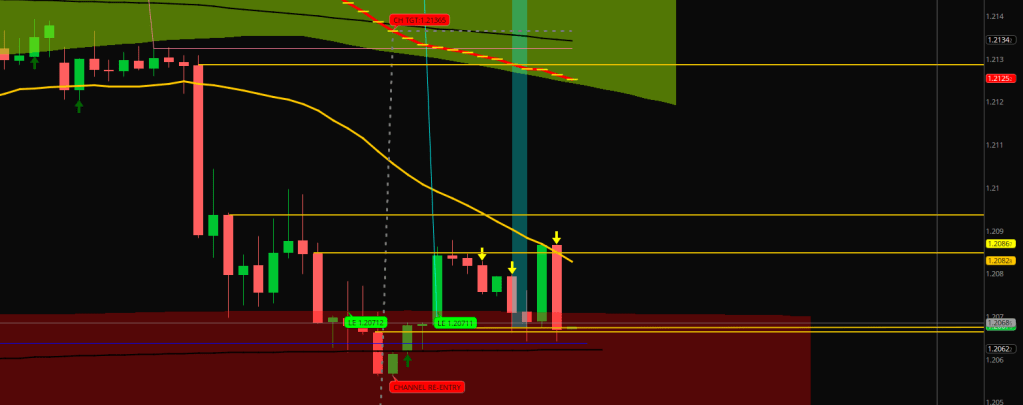
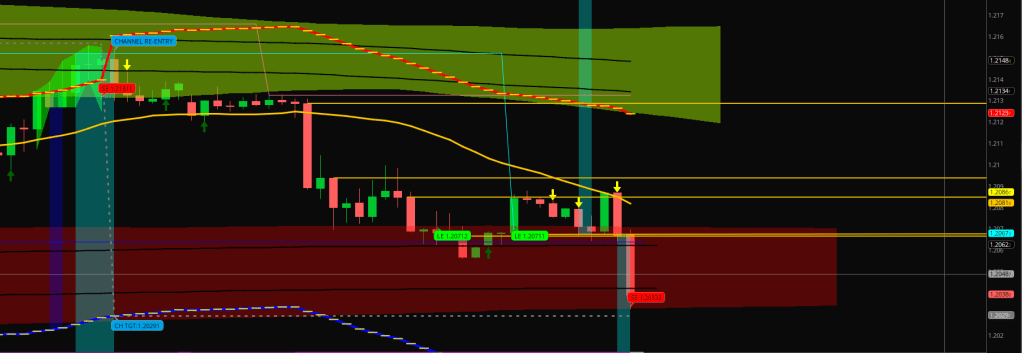
The purpose of this indicator is to be able to find turning points in time and or within a predetermined distance.
The indicator itself is using RSI2 reversal divergences on the 30M time frame. It is sensitive and insensitive enough to be the best for the job. (For RSI2 continuation divergences I would use the hourly.)
Besides the sensitivity there is a chronological order of events that prepares the turn itself.
The Chronology
Blood in the Street / Blood on the Trading Floor
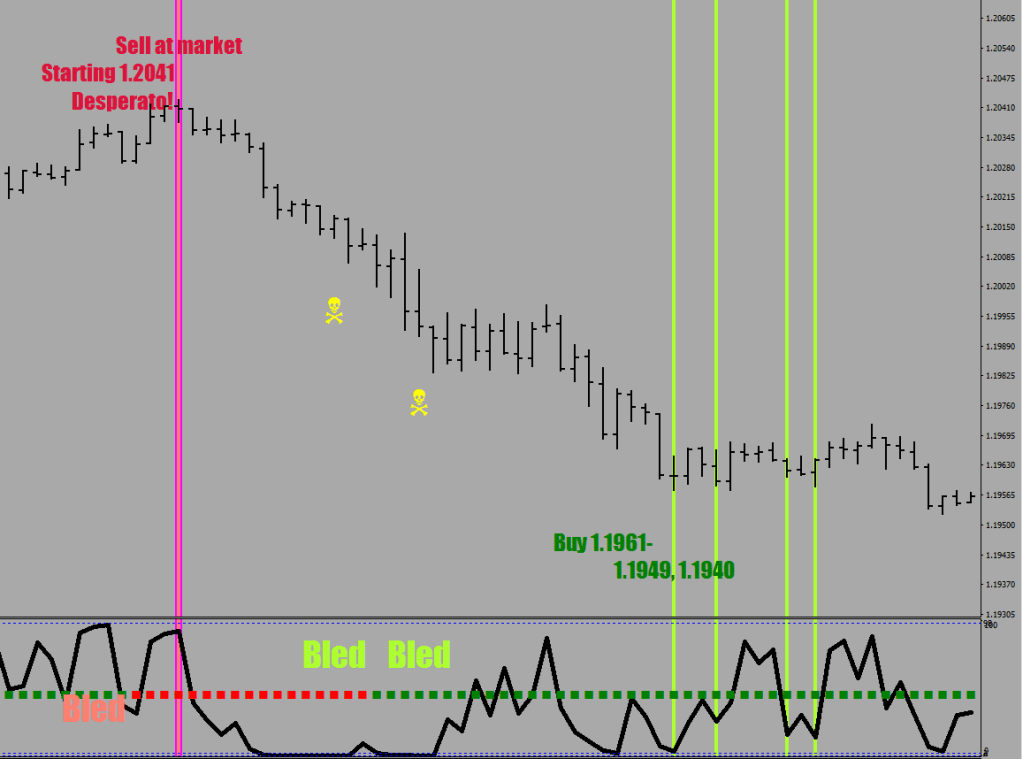
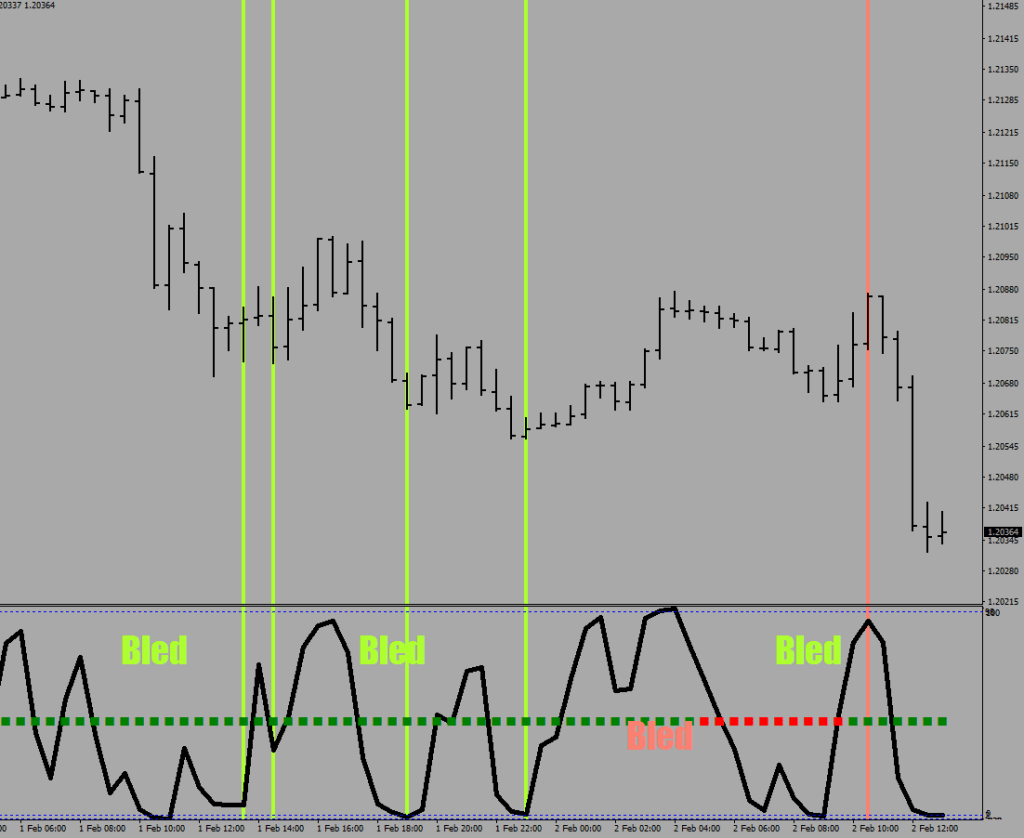
Before we are looking for a reversal divergence, there has to be blood, the market has to have bled. There is of course red blood and green blood depending on who bled out: the bulls or the bears.
The computing logic is for verification only, if the “indicator window” option is set to say 3, it would not appear.
The Drive / Thrust or Drive / Crash or Bleeding / Turning are exchangeable ideas about the market’s personality.
2. The divergence
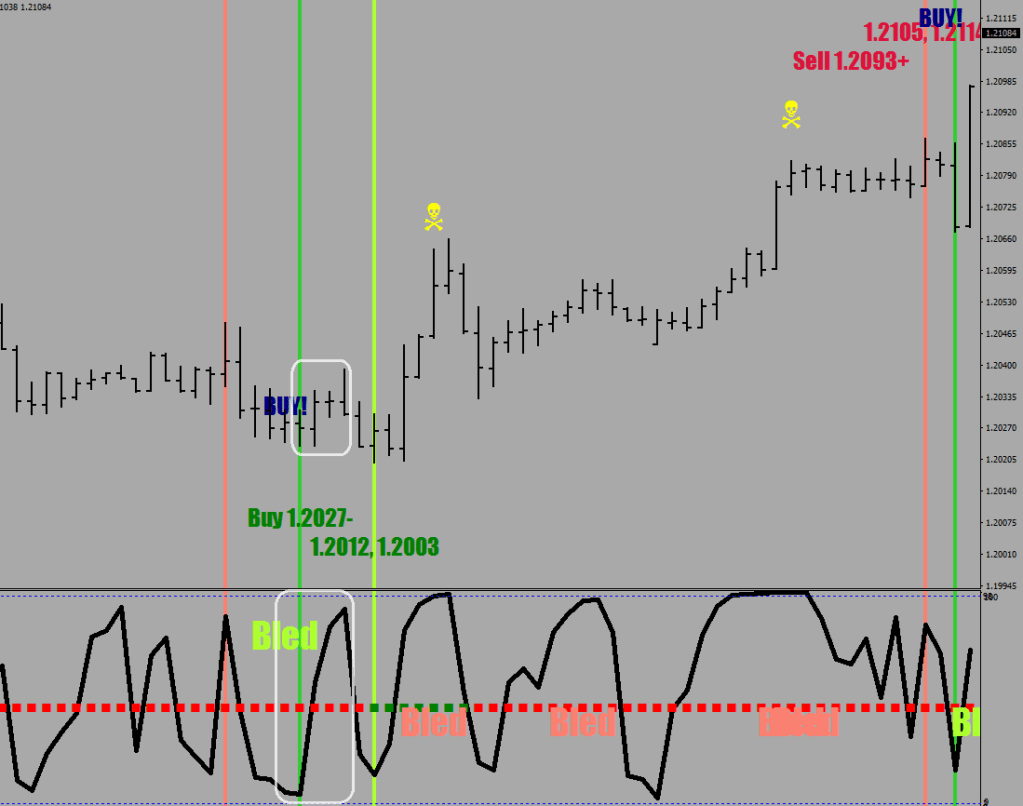
All vertical lines are the ending points of reversal divergences.
The vertical line determines a point intimewhen the divergence took place if the next 30 minutes starts with absolutely no kick back / recoil. These lines get a magenta accent to draw attention to the urgency: you have to go in in the opposite direction at market ASAP. “El Desperato” stands for a desperate action, and similarly on the receiving end the turn would likely come with a sense of urgency.
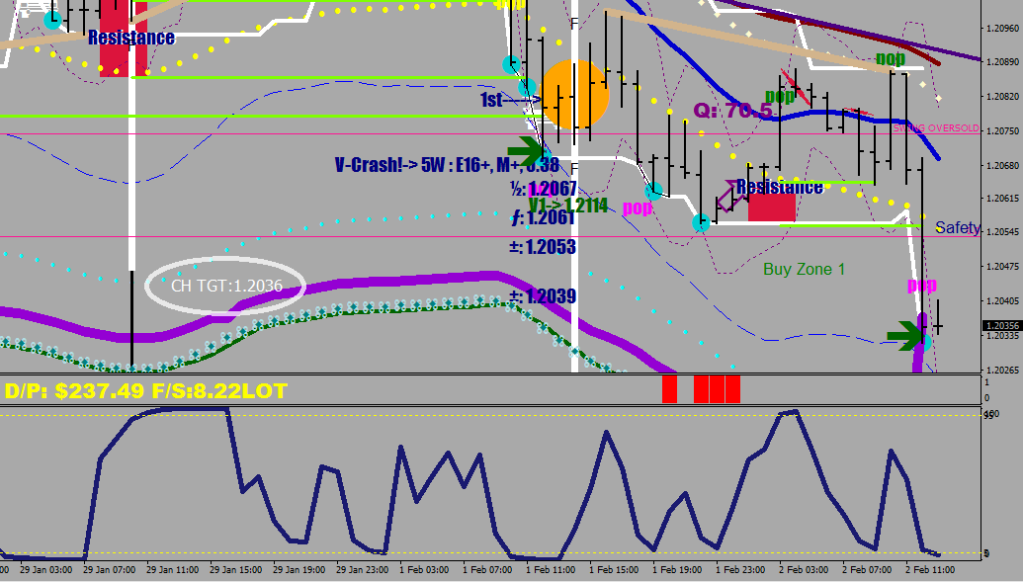
The first vertical line with a new color determines a turning range. This range usually starts from the close of the marked candle and expands to 17 pips beyond the outside edge of the same candle.
I suggest scaling in in the area covered by the shown numbers, for instance after calculating your trading size based on your equity, you may want to go in with
1/4th just beyond the close of the highlighted candle
1/4th at the second number (usually 8 pips beyond the outer limit)
1/2 at the third number (usually 17 pips beyond the outer limit)
Yes, you may get as many as 4, even 5 reversal divergences in a row, but what matters is the zone defined by the firs one & you would seldom see anything further than 20 pips from that candle.
Vlad bled.
3. Filters
a) skull and bones / pirate’s peak
Things don’t always go to plan, why would they?
There are a number of conditions that can throw things off.
One such finding is the skull and bones ︵‿ toxic strength. Breaking the pirate’s peak is a continuation in the charge. If you go back to the first image, you will see an example where the pirate’s peak was not exceeded.
This condition is being utilized to increase the displacement of the range and also to pass out on a reversal call due to close proximity in time to a pirate’s peak charge.
b) flip the bird
The flip the bird can only be identified after the sequence has printed: it has to be a 2-hour sequence (4 candles long), end on a high note and the starting RSI reading has to be between 5 and 20.
On the example above you can see some recoil on the next candle which is an opportunity to get in on a promising continuation: the bleeding logic gets a null, so a full bleeding + divergence has to occur before the market gets done.
Below is another exemplar but in this case the recoil itself set a reversal divergence first.
4. Other features
Here’s where Mike gets a little Massey.
I lifted some features for the sense of direction and limits.
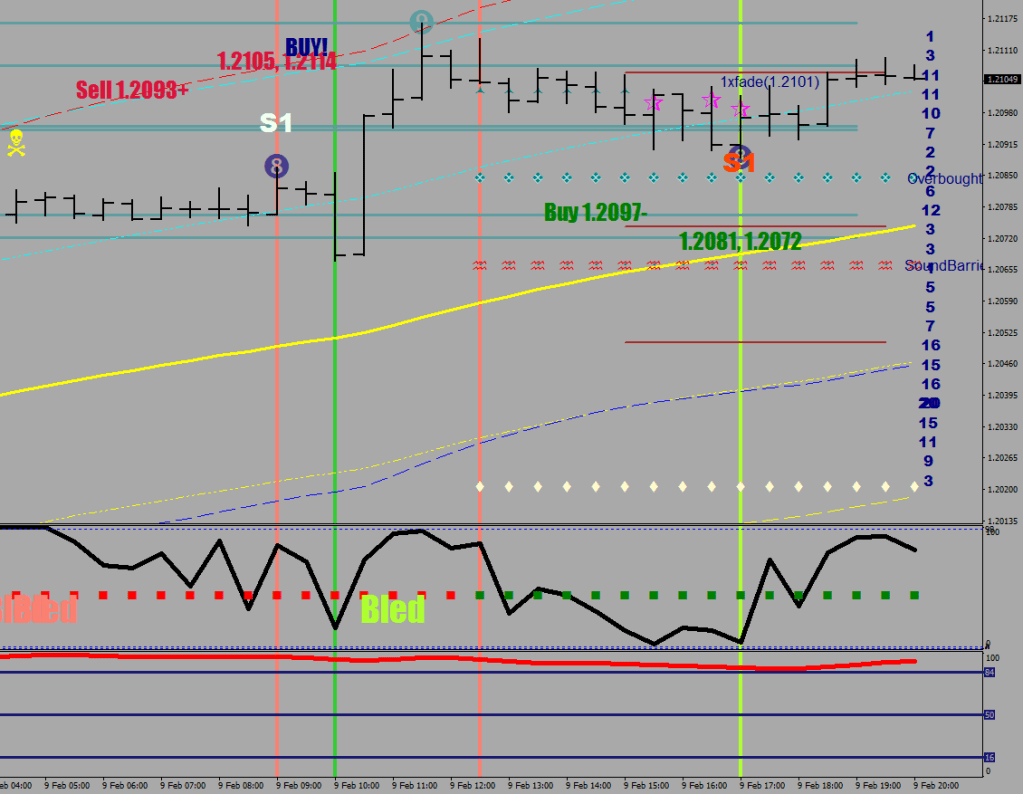
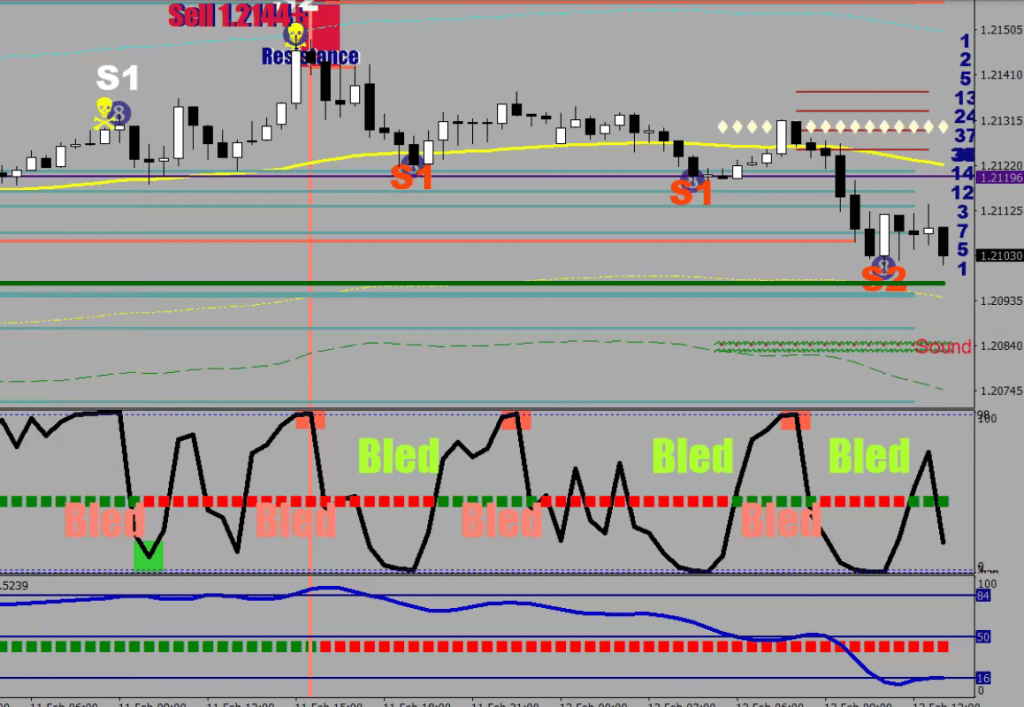
The diamonds are the girl’s best friend and they represent the last 4-hour consolidation mean.
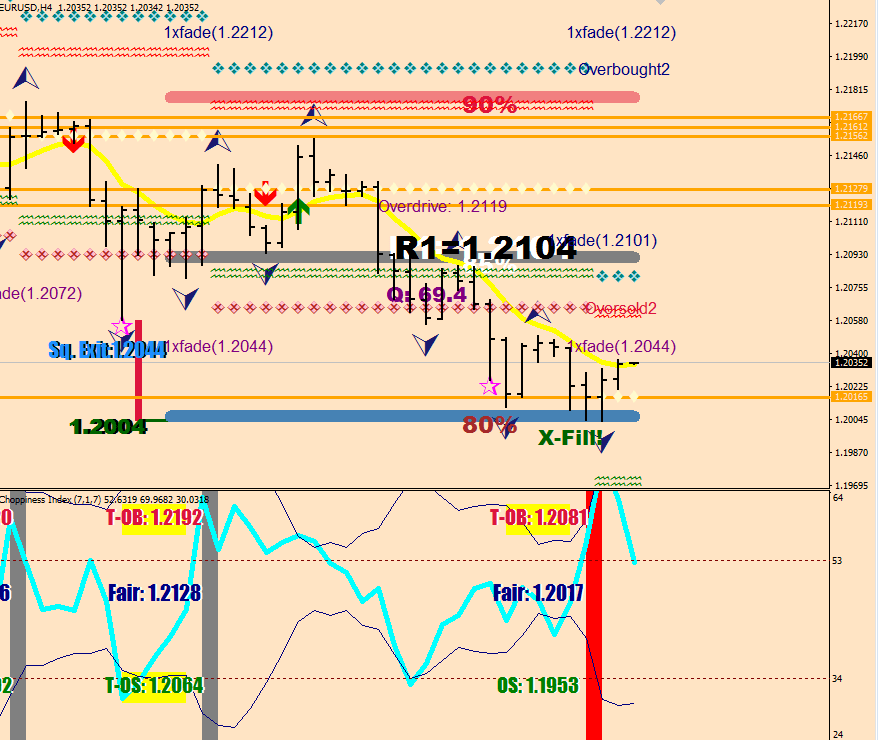
The overbought and oversold are 64 pips away (2x 32 = fluctuation size of EUR/USD).
The sound barriers are closer by 20 pips, and they would limit some attempts in the wrong direction. Wave ones tend to fail here / before hitting the overbought / oversold.
The 1x fade is a one time fade (20 pips into the overbought/oversold) like its name says, and almost any move can be faded for a move back to the overbought / oversold neckline for a good scalp.
Sorry for all this, but old rabbits don’t die. They explode. I should know, my great-grandfather used to have a rabbit farm.
In closing I would like to mention to use this indicator in combination with Axel S. and 99-Lines for more love and understanding.
The Crack Ho on the bottom is the sister of the 60 min 60 sample Stoch D, here it is 120.
…
New experimental feature plotting the turning blocks
When desperation meets eagerness
…
Human logic as the second row conclusion
The smartest guy out there should be able to come up with an indicator that is accurate about the holding direction.
An idea on how you can plot approximate support and resistance levels based on the presence of larger step-downs.
Picture shows with lighting highlights the brown support lines based on the last 2 day’s profile (96x 30 mins) where the stepdifference was greater than 6.
It may be worth placing more permanent lines over those levels for over time the sample would cease including those areas.
Use it as a helper with preparing for the day.
double start=iOpen(symbol,30,market_profile_length);
double step = FSize*10*Point/8;
    for (i=market_profile_length; i>=0; i--)
      for (j=30; j>=0; j--) {
         if (High[i]>start+j*step && Low[i]<start+j*step) mpu[j]++;
         if (High[i]>start-j*step && Low[i]<start-j*step) mpd[j]++;
   }

  for (i=30; i>=0; i--) {
      if (mpu[i]>0) { ObjectCreate("Qxt 7"+DoubleToStr(i), OBJ_TEXT, 0, Time[0], start+i*step+.0002);
                     ObjectSetText("Qxt 7"+DoubleToStr(i), "       "+IntegerToString(NormalizeDouble(mpu[i],4),1), 12, "Arial Black", indicator_color3);

                        if (MathAbs(mpu[i]-mpu[i+1])>stepdifference){
                                    ObjectCreate(0,"Qxt5_1"+DoubleToStr(i),OBJ_TREND,0,Time[10],start+i*step+.0002-17*Point,Time[1],start+i*step+.0002-17*Point);
                                    ObjectSetInteger(0,"Qxt5_1"+DoubleToStr(i),OBJPROP_RAY_RIGHT,false);
                                    ObjectSet("Qxt5_1"+DoubleToStr(i),OBJPROP_COLOR,Brown);
                                    ObjectSet("Qxt5_1"+DoubleToStr(i),OBJPROP_WIDTH, 2);}

                     }
      if (mpd[i]>0) { ObjectCreate("Qxt 9"+DoubleToStr(i), OBJ_TEXT, 0, Time[0], start-i*step+.0002);
                     ObjectSetText("Qxt 9"+DoubleToStr(i), "      "+IntegerToString(NormalizeDouble(mpd[i],4),1), 12, "Arial Black", indicator_color3);

                             if (MathAbs(mpd[i]-mpd[i+1])>stepdifference){
                                    ObjectCreate(0,"Qxt5_1"+DoubleToStr(i),OBJ_TREND,0,Time[10],start-i*step+.0002-34*Point,Time[1],start-i*step+.0002-34*Point);
                                    ObjectSetInteger(0,"Qxt5_1"+DoubleToStr(i),OBJPROP_RAY_RIGHT,false);
                                    ObjectSet("Qxt5_1"+DoubleToStr(i),OBJPROP_COLOR,Brown);
                                    ObjectSet("Qxt5_1"+DoubleToStr(i),OBJPROP_WIDTH, 2);}

                     }
       }
So I have a lot of connections on LinkedIn, so I get all kinds of “statements” shuffled in to the digest.
There are things I immediately hit the unfollow button on, these are the obvious scams. You know, mostly cell phone screen shots with no obvious duration shown, just a piece meal with a REAL flag Photoshopped over.
Do I keep the connections? I let them look at what I am doing and give them a chance to do the right thing. I only delete the aggressive jerk types and the total frauds.
I’ve been trading for a long time to know what is realistic / attainable.
Today I saw a “Managed Accounts” list with I believe 10-12 different accounts and just a percentage for “gains” in an excel chart.
Scammiest thing ever. I wanted to immediately unfollow, but then after losing the post altogether I felt regret for not taking a screen shot.
There are a number of things to talk about here.
One single percentage is totally meaningless: is that increase on the balance or the equity (for these two things rarely are equal)? Was there any capital injection for instance to avoid a margin call? This would raise the balance too, you know.
I myself trade like a fund. It is not impossible to trade 10 different accounts and have all trades settled by the end of the day. These accounts would not be called managed accounts, but rather traded accounts.
If you manage an account, that means that you are using means of protection other than stop losses. Most likely hedging infrequently.
In my video titled “Yie Are Kung-Fu /30 K Profit Factor?!” I show both a monthly Balance and an Equity statement.
When you are managing an account, you always have a net position size which is either positive and negative, and seldom are without any holdings at all. You would be rolling in and out of longs and shorts, and would have an exposure on balance.
Sure, money making is the ultimate goal, just like when you are day-trading, but your objectives would multiply – you would want to:
align your naked exposure best fit with the perceived next move
gain and not lose equity vs balance
build up equity with short term, quick roll in & outs occupying little to no margin
pay attention to which holding side would contribute swap for overnight holding
pay attention to margin usage, hedge when you find it wise / necessary
inject capital only on last resort
use dynamic sizing giving weight temporarily to higher conviction
All off numbers can be attributed any sense in the light of an examined period. There are mere changes towards an ideal state that may never be accomplished.
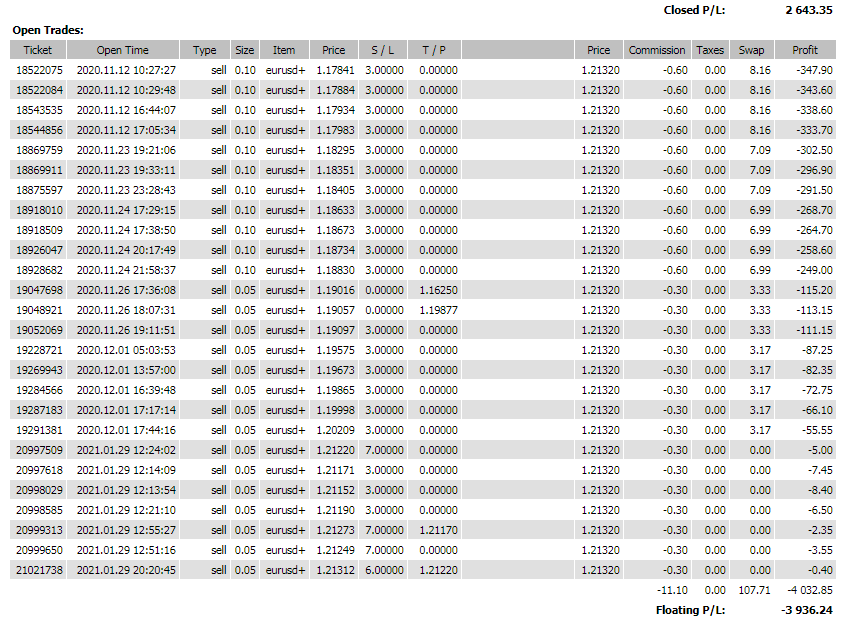
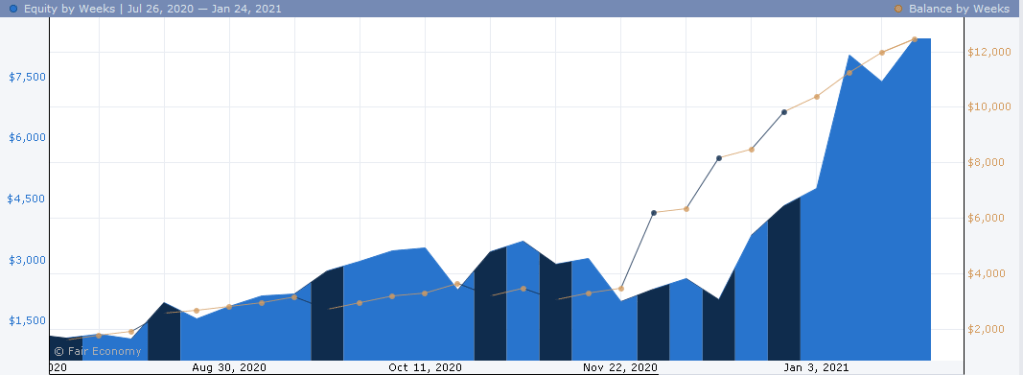
So, let’s pull up the statement from the end of January, we’re curious about the holdings and the equity here.
If you add up the short positions held, it was 1.85 lots. Since my calculated Trading Size was 4.5 lots, you can see that the account was not heavily burdened, and the Equity/Balance Ratio speaks of 32% draw down with the nominal value expressed as Floating.
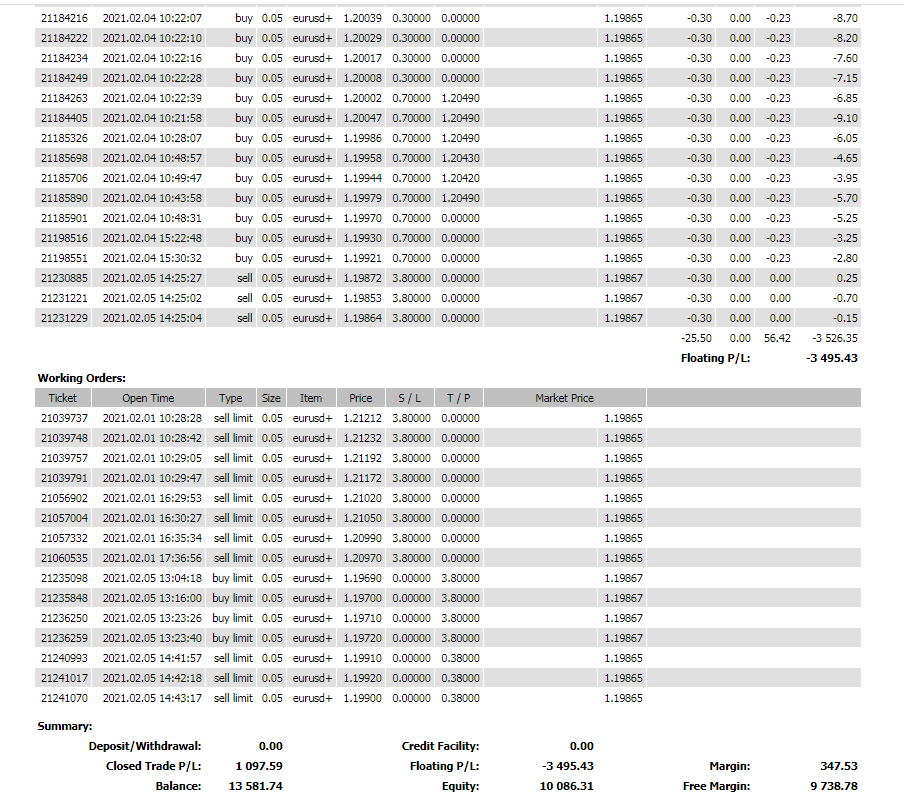
This Friday has a lot more to go, but for the sake of this article, I do a “one week later comparison” with its current state.
For the current week the following things can be said:
the balance grew by 1,097.59
the equity grew by 1,538.40
the draw down decreased to 25.44%
on balance I am currently 1.45 lots long after taking on 2.85 lots long and closing 0.45 lots short
due to equity growth, trading size is now at 5 lots
and we are not even discussing margin percentages at this point.
As you can see, one single percentage number would not paint any realistic picture, not even the shade of it.
Fund management is all about realizing when market changes occur and making beneficial alterations.
This is why it is worth celebrating when an indicator weakness gets corrected to be able to more accurately interpret in the future to bring about better bottom line numbers.
For instance, a reversal divergence wasn’t picked up before, so I had to allow for the comparison high to be lower by a few pips – it is now.
The following call had to be eliminated, for the RSI sequence’s last 2 values were too close to each other for a usable reference point.
And it is correct now.
Further changes may be necessary, but I never said otherwise. Development is a process just as managing an account.
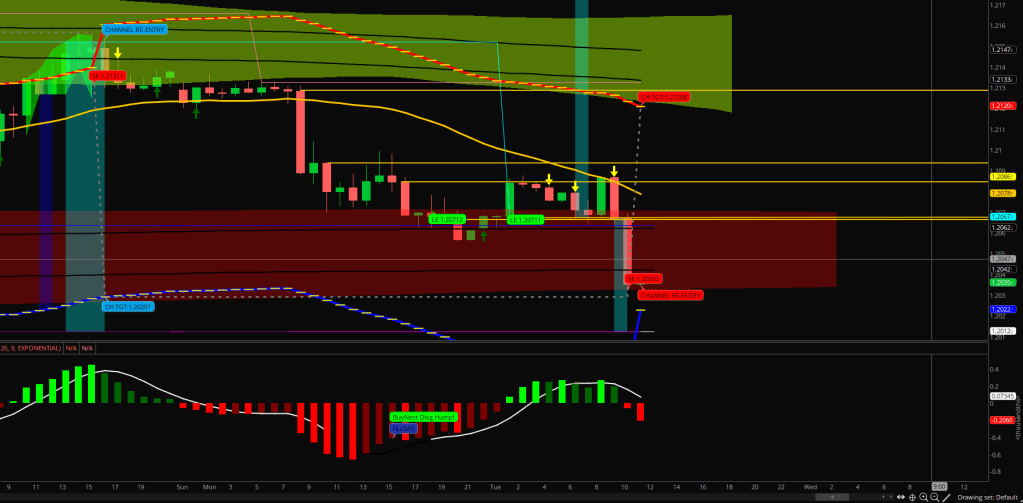
In order to start channeling, the Alex Foley aka the market has to trade in the E-32 for an Axel S. E-32 itself would become one end of the channel and the distance doubled would be the other end.
In the example above you can see that the encounter with the E-16 viaduct brought on the channeling move.
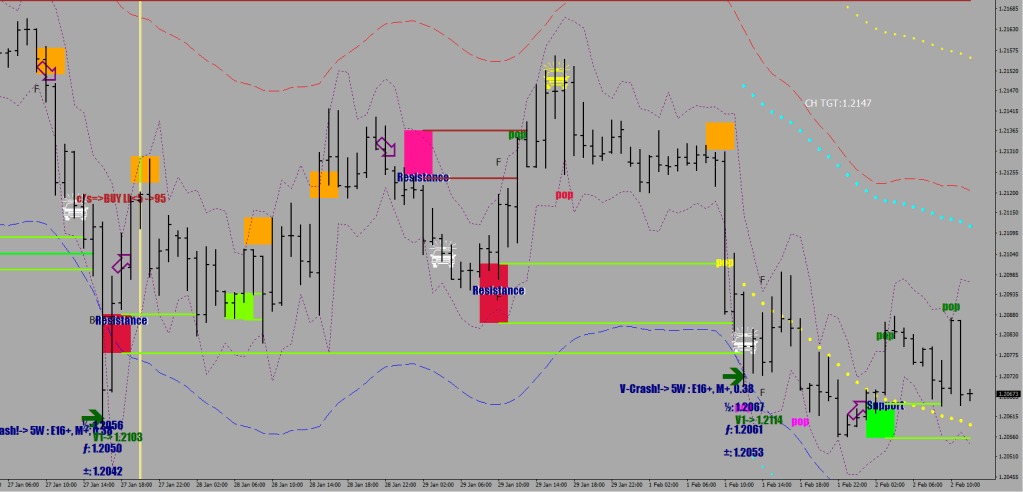
Support and Resistance can be found on the chart due to the volatility breach they caused in a direction = due to the manner price left a level (in a hurry).
On the image above to find support and resistance zones automatically, my software utilizes the breach of the dotted brackets, which are 10-pip displacements. I also invented a logical switch for “fresh green pop / fresh red pop” to find the most relevant ones.
So let’s carry over these two ideas for drawing support and resistance:
the line is merely a starting point of a moratorium zone, and would be placed on the candle’s open, not its wick
you need volatility expansion to highlight an area, a simple trickle away does not result in a support/resistance level no matter how long the price spent there
…so your lines are drawn in accurately on your hourly chart, you are eyeing the next level up
…and this is what happens…
…baby bummer, for you knew all along about the channel target on the left (thanks to my free TOS present earlier), you are conscious of the wave structure and have not used outrageous size… you are in good shape… time to average down that bet!
Price is almost there & life is almost fair>
…the necessary correction to the RSI2 30M was made.
…
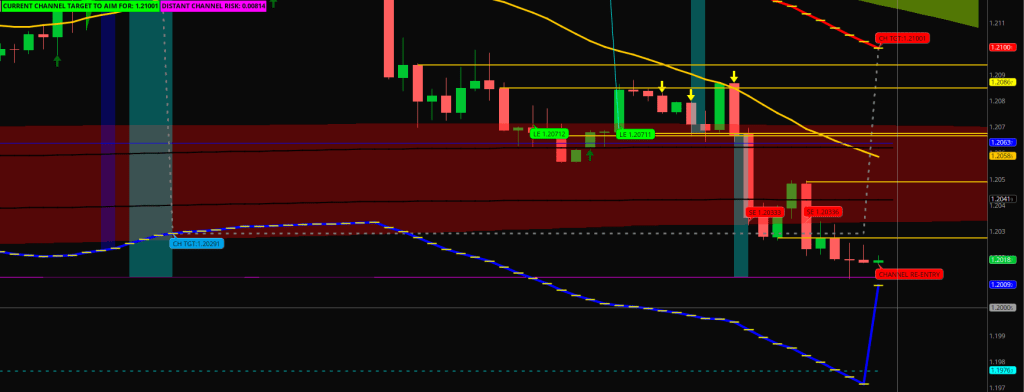
Channel Target on CloseLines 60-60
the difference comes from using an E-32 channel VS E-36 on TOS in part
…potential mean reversion from here…
The Projected Distance beam is of course a potential support. So is the Comfort Levels overbought neckline.
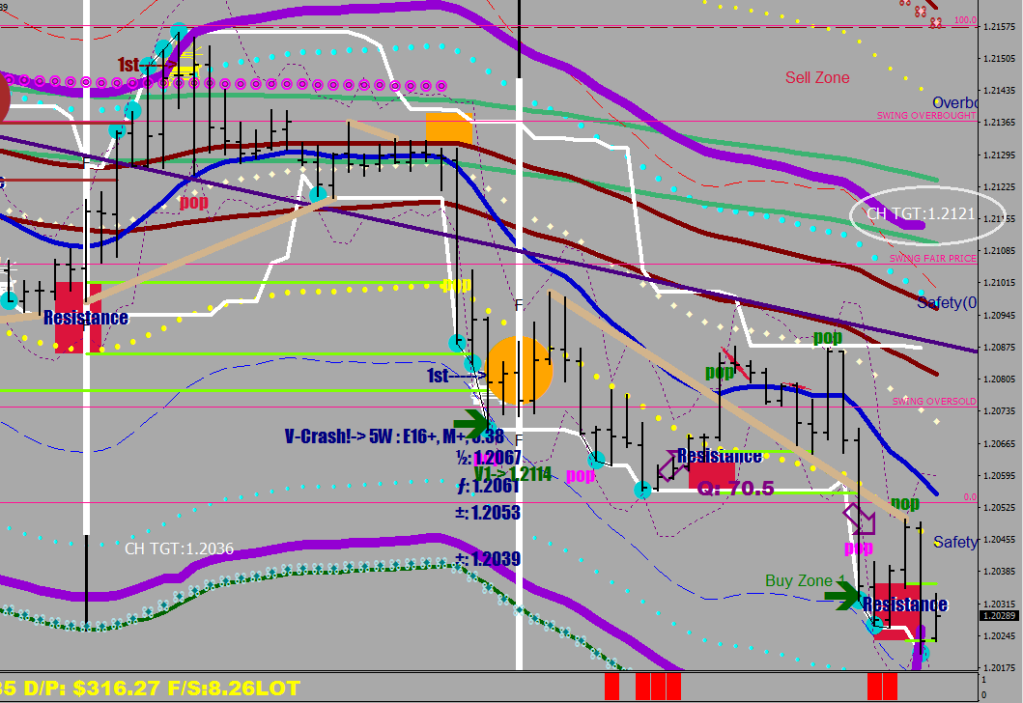
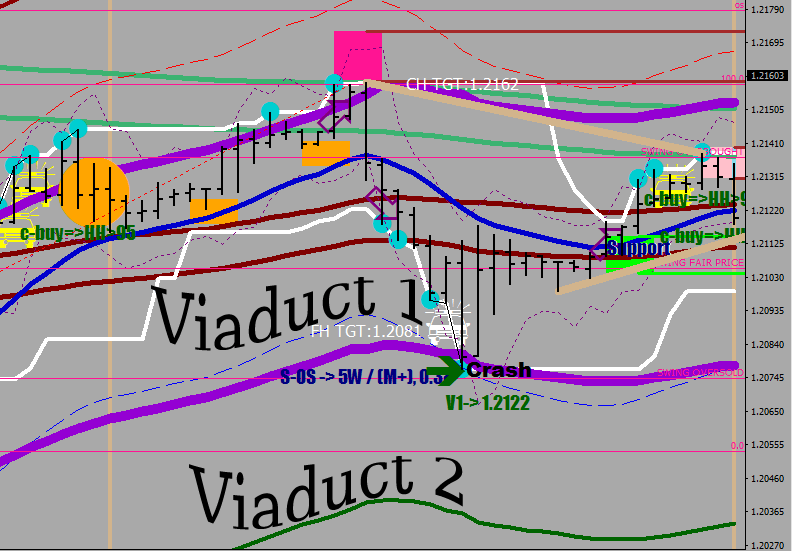
The two kind of crashes are the Viaduct Crash (hitting and reversing off the 45-pips displacement of E16 / 74 pips displacement of E32) out of a not sustainable buying selling and the End of the Line Crash (SSC) out of 3 tries have transpired: no more tries, switch sides.
A near miss of the Viaduct is a steering away move back to the MAs
Get the size in
If the crash is to happen against your holding direction, round up the holdings to your personal risk tolerance level (maximum unhedged holding size) scaling in more and more. If a viaduct crash happened and the reaction is visible, take on a full size hedge at market.
If the crash was in the direction of your holdings
get out of your in the money holdings
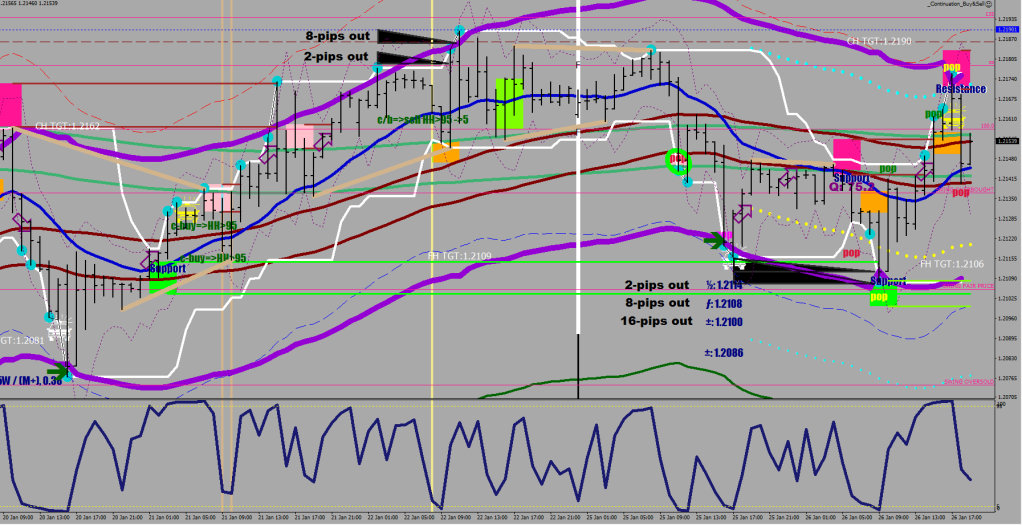
place 2x 1/2 size of your remaining holdings pending 2 and 8 pips from the furthest point of the “Bam / Scorching” section (“3rd” attempt)
perhaps add another quarter 16 pips out (consider the overall market direction)
perhaps add another quarter 27 pips out (consider the overall market direction)
Overall market direction is currently dollar negative, this won’t change until the daily PSAR gets violated and a 4th day is still making progress beyond the PSAR limit.
Aim for lucid targets
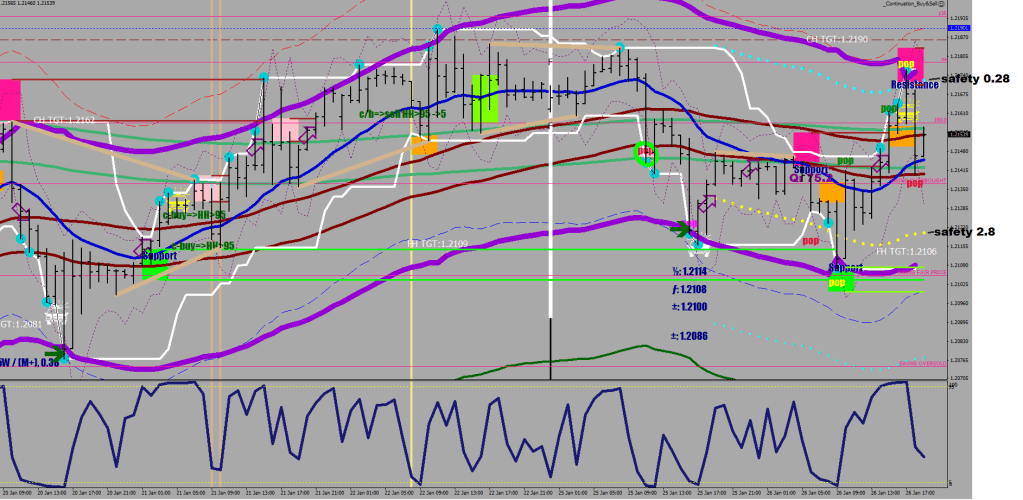
Aim for the safety lines – plug the target code in for the cropper: 0.28 for shorts, 2.8 for longs. With higher conviction you can plug in 0.38 / 3.8 for 10 pips extra. The Channel targets give you a good idea of what is possible / likely.
Trail
Plug in the trail stop code with 32-pips tolerance: 3 for shorts 0.3 for longs
Do not touch the trade
Rinse and repeat
What to make of the multiplying Karma police? Starting to look like a crime scene. Politia = Pulis = 3 hourly closes on the other side of Mr. Maroon.
It turned out to be an extended length Wave 2.
…an example of Viaduct 1 breaking & Viaduct 2 holding.
The Wave 3 projection is the black tip of the white spear.