Computer Aided Trading

The E-book? It is coming along nicely, should be ready by the end of March.

A computer can aid your trading in countless ways. Machines do not sleep, they can react when you are incapacitated; they do exactly what you tell them to do.

The first example is that of shortcuts. You may decide to pick up a half hedge or a full hedge, and any second is precious, for price does not stop moving. A pre-programmed key combination would calculate the needed size accurately for you and place the order almost instantly.

Meta Trader comes with the possibility of running Expert Advisors that can open, close, manage trades. I personally run 30 of these at a time on a single account, and all of these meant to give me extra help, extra edges.

When you have a remote control only (cell phone) in your hand, the application is incapable of assigning trail stops to the orders. With a trading computer / cell phone combination this may no longer cause any problems, for one of your EAs could be a smart trail stop that you communicate to in a form of a code. For instance, you may want to initiate a holding, and do not want to be taken out of it just yet, so you put no stop loss with it – signalling to be ignored. If you chose to do this, you should be running a ratio hedger routine as well, just in case (that’s another thing a computer is for, auto hedging). Now, if you put anything other than 0 for stop loss – that may be the code for the Smart Trail Stop routine to start managing the trade. Some auto trading routines may be granted exceptions as well based on the magic numbers they use. Decisions do not have to be binary either. Say, if I put 0.1 stop loss that can mean that I want the trail stop to be locking in 1 pip gains upon going into 5 pips in gains, lock in 2 pips upon exceeding 8 pips gains and start trailing the stop ½ Fluctuation Size or 16 pips behind starting from 20 pips in gains, but if I put 0.2 stop loss for starters, I do not want the implementation of the first 2 steps, only the 16-pip trail stop.

Cropper routines can cut the positions if a condition was met. I often use cropping for trades opened with auto trading EAs, to cut them when they have made 2.5% or 7% gains relative to the account balance.

There may be other reasons, such as a perceived change in market direction to trigger a crop, a hedge or to initiate a trade. Many of the conditions are only temporarily present, and a human is at complete lack of sensitivity and incapable of making quick, informed decisions not to mention the execution speed.

Computer aid is not merely an option, it is a necessity.

A computer can aid your trading in countless ways. Machines do not sleep, they can react when you are incapacitated; they do exactly what you tell them to do.

The first example is that of shortcuts. You may decide to pick up a half hedge or a full hedge, and any second is precious, for price does not stop moving. A pre-programmed key combination would calculate the needed size accurately for you and place the order almost instantly.

Meta Trader comes with the possibility of running Expert Advisors that can open, close, manage trades. I personally run 30 of these at a time on a single account, and all of these meant to give me extra help, extra edges.

When you have a remote control only (cell phone) in your hand, the application is incapable of assigning trail stops to the orders. With a trading computer / cell phone combination this may no longer cause any problems, for one of your EAs could be a smart trail stop that you communicate to in a form of a code. For instance, you may want to initiate a holding, and do not want to be taken out of it just yet, so you put no stop loss with it – signalling to be ignored. If you chose to do this, you should be running a ratio hedger routine as well, just in case (that’s another thing a computer is for, auto hedging). Now, if you put anything other than 0 for stop loss – that may be the code for the Smart Trail Stop routine to start managing the trade. Some auto trading routines may be granted exceptions as well based on the magic numbers they use. Decisions do not have to be binary either. Say, if I put 0.1 stop loss that can mean that I want the trail stop to be locking in 1 pip gains upon going into 5 pips in gains, lock in 2 pips upon exceeding 8 pips gains and start trailing the stop ½ Fluctuation Size or 16 pips behind starting from 20 pips in gains, but if I put 0.2 stop loss for starters, I do not want the implementation of the first 2 steps, only the 16-pip trail stop.

Cropper routines can cut the positions if a condition was met. I often use cropping for trades opened with auto trading EAs, to cut them when they have made 2.5% or 7% gains relative to the account balance.

There may be other reasons, such as a perceived change in market direction to trigger a crop, a hedge or to initiate a trade. Many of the conditions are only temporarily present, and a human is at complete lack of sensitivity and making quick, informed decisions not to mention the execution speed.

There may be other reasons, such as a perceived change in market direction or a break out to trigger a crop, a hedge or to initiate a trade. Many of the conditions are only temporarily present, and a human is at complete lack of sensitivity and incapable of making quick, informed decisions not to mention the execution speed.

Computer aid is not merely an option, it is a necessity.

Computer aid is not merely an option, it is a necessity.
1234-TRENDING

Those people drawing trend lines and Fibonacci retracements, would never figure out what the market is about.


Do they have a clue why they were stopped out? Do they know what trending / emedding means? I doubt it.

I already mentioned about embedding in my previous article, so let’s talk about:

Trending is not measured by oscillators. Trending is embedding, and so it is measured by time.

What you see on my _RSI2_Spin indicator below, in the middle block, the small squares are the positive / negative readings, and their color is immaterial if it comes to trending, its their presence that counts.

if (Open[i+3]>plus[i+3] && Open[i+2]>plus[i+2] && Open[i+1]>plus[i+1] && buy[i+1]!=EMPTY_VALUE) positive[i]=50;
if (Open[i+3]>plus[i+3] && Open[i+2]>plus[i+2] && Open[i+1]>plus[i+1] && sell[i+1]!=EMPTY_VALUE) negative[i]=50;
if (High[i+1]>plus[i+1] && High[i]<plus[i]) {positive[i]=EMPTY_VALUE; negative[i]=EMPTY_VALUE;}
       
if (Open[i+3]<minus[i+3] && Open[i+2]<minus[i+2] && Open[i+1]<minus[i+1] && sell[i+1]!=EMPTY_VALUE) negative[i]=50;
if (Open[i+3]<minus[i+3] && Open[i+2]<minus[i+2] && Open[i+1]<minus[i+1] && buy[i+1]!=EMPTY_VALUE) positive[i]=50;
if (Low[i+1]<minus[i+1] && Low[i]>minus[i]) {negative[i]=EMPTY_VALUE; positive[i]=EMPTY_VALUE;}   

Plus and minus are the local overbought/oversold levels based on the last fractal +/- displacement, and the Buy/Sell filters are the stochastic current’s two polarities.

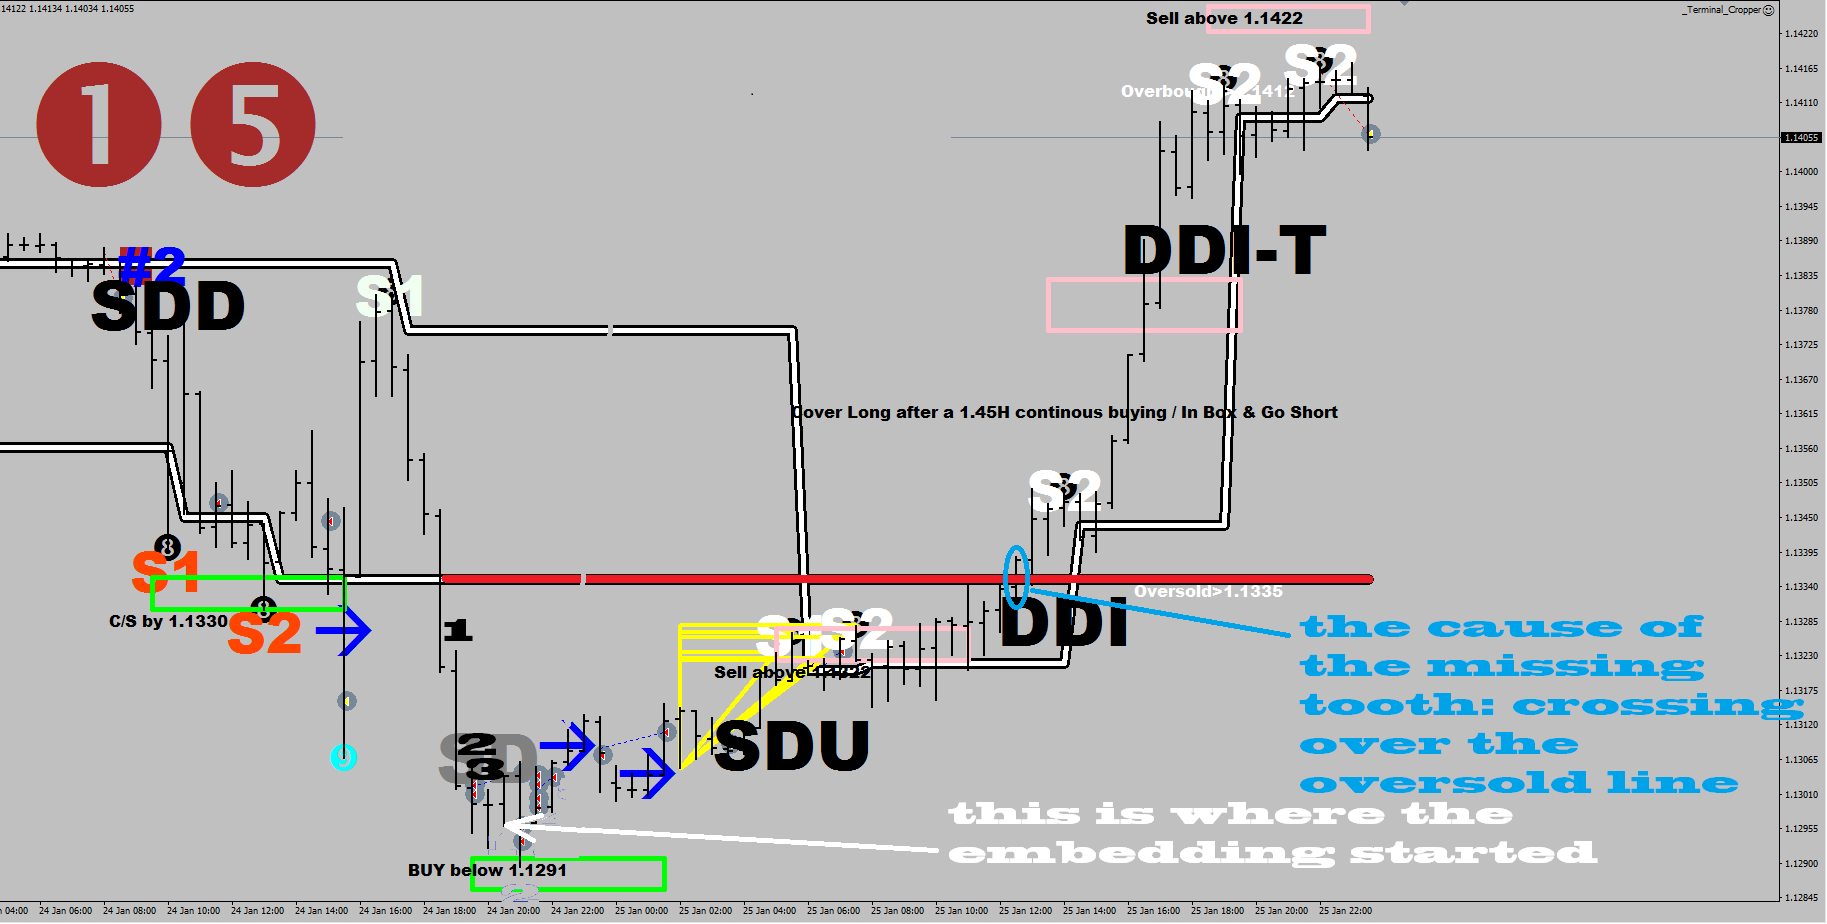
This is your answer to what trending is. Trending is not something you hook an oscillator on, and has degrees, it merely is on or off. After 4 of those squares printed we talk about embedding/trending.

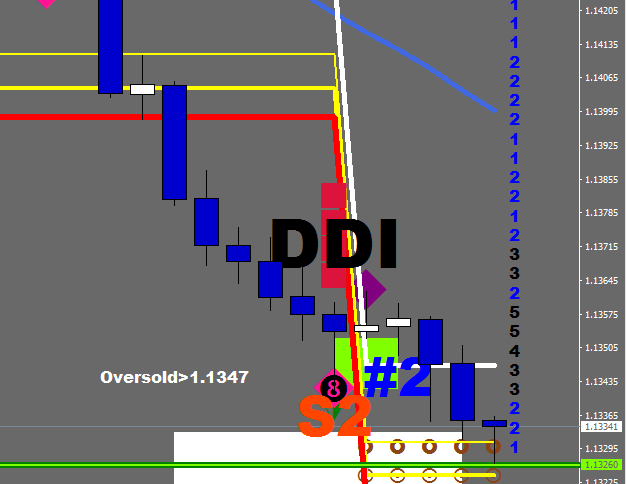
The answer to why was this buying successful in the face of the Long Term embedded oversold condition, is the persistent buying that has brought on its local counter trend.

The one tooth missing is normally called “saving” that results in re-embedding. This does not apply for the current example, the one blank was merely signaling an open below and a close above the oversold neckline.

The answer to when it is going to fizzle off, is that the market has two speeds, 2H 45 minutes for slow, and 1H 45 minutes for fast. What is still missing from that chart is a 3-4 candle long burn off of the excess.

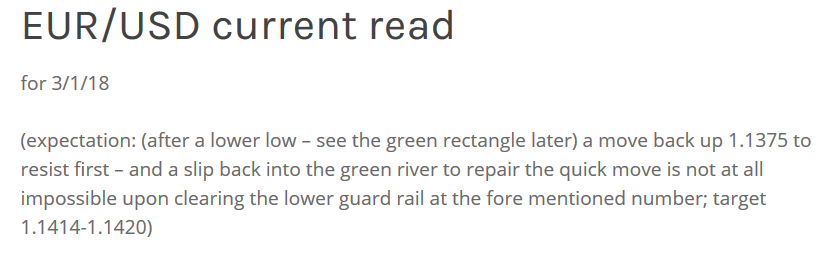
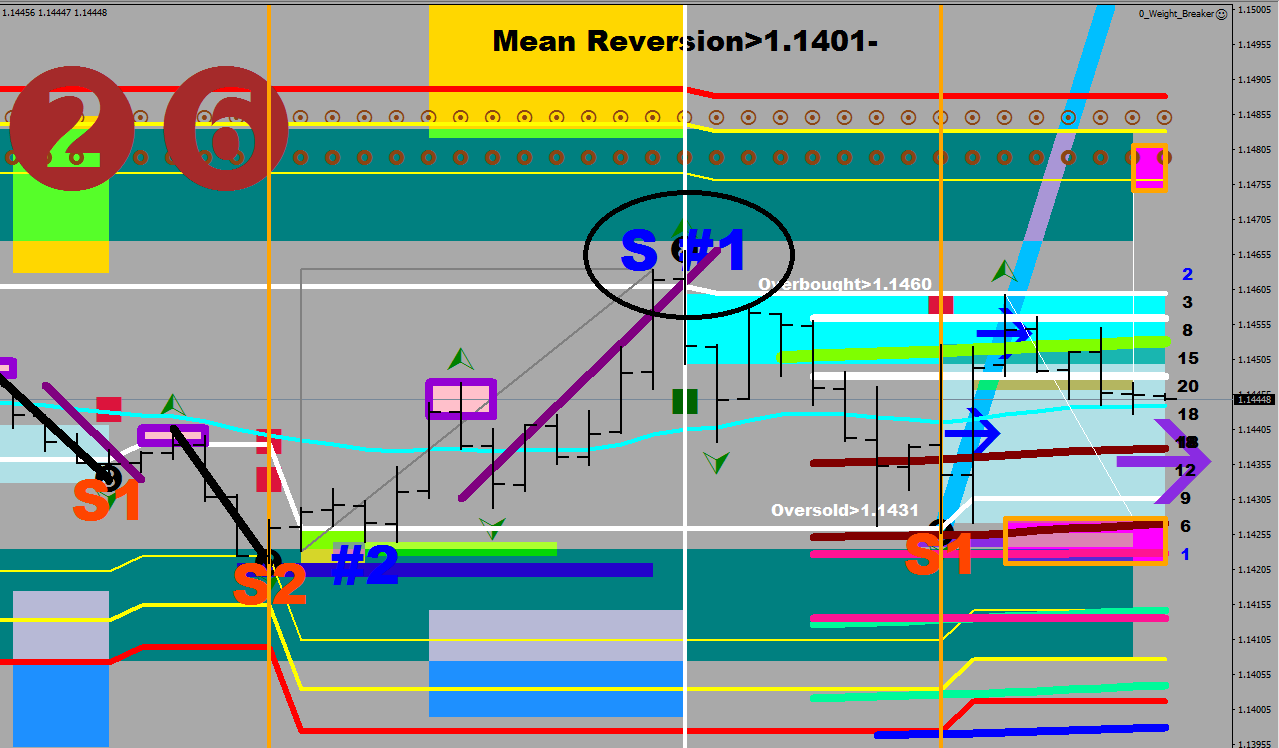
You have the upper guard rail straight ahead (green) as well as a market maker level @ 1.1425. The top of the lower reversal zone (15% – gray vertical shading) can also make things difficult for a bit at 1.1416.

In slow motion:

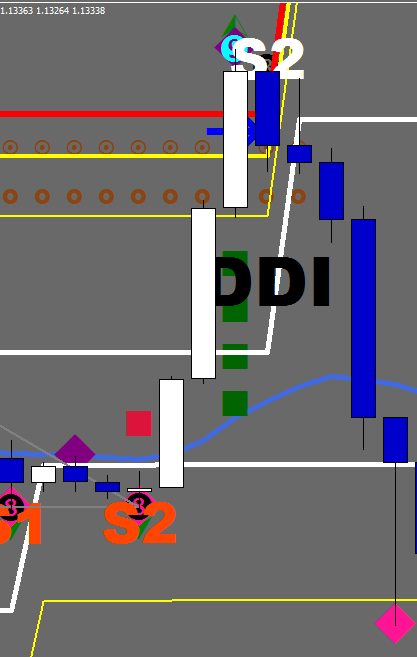
The orange S1 and S2 were not followed by any more Synchronized lows. The number “9” print made by my 88 luftballons routine was giving a warning sign for a possible counter trend starting.

The embedding kicked in, and subsequently the white S1 & S2 prints adjusted the overbought level.

The rest would come in the shape of a book.


D-Day, mayday!

Hoping for / Waiting for a D-Day was my sales pitch on different forums for my last blog entry.

Let’s do what people always forget to do first: top down analysis.

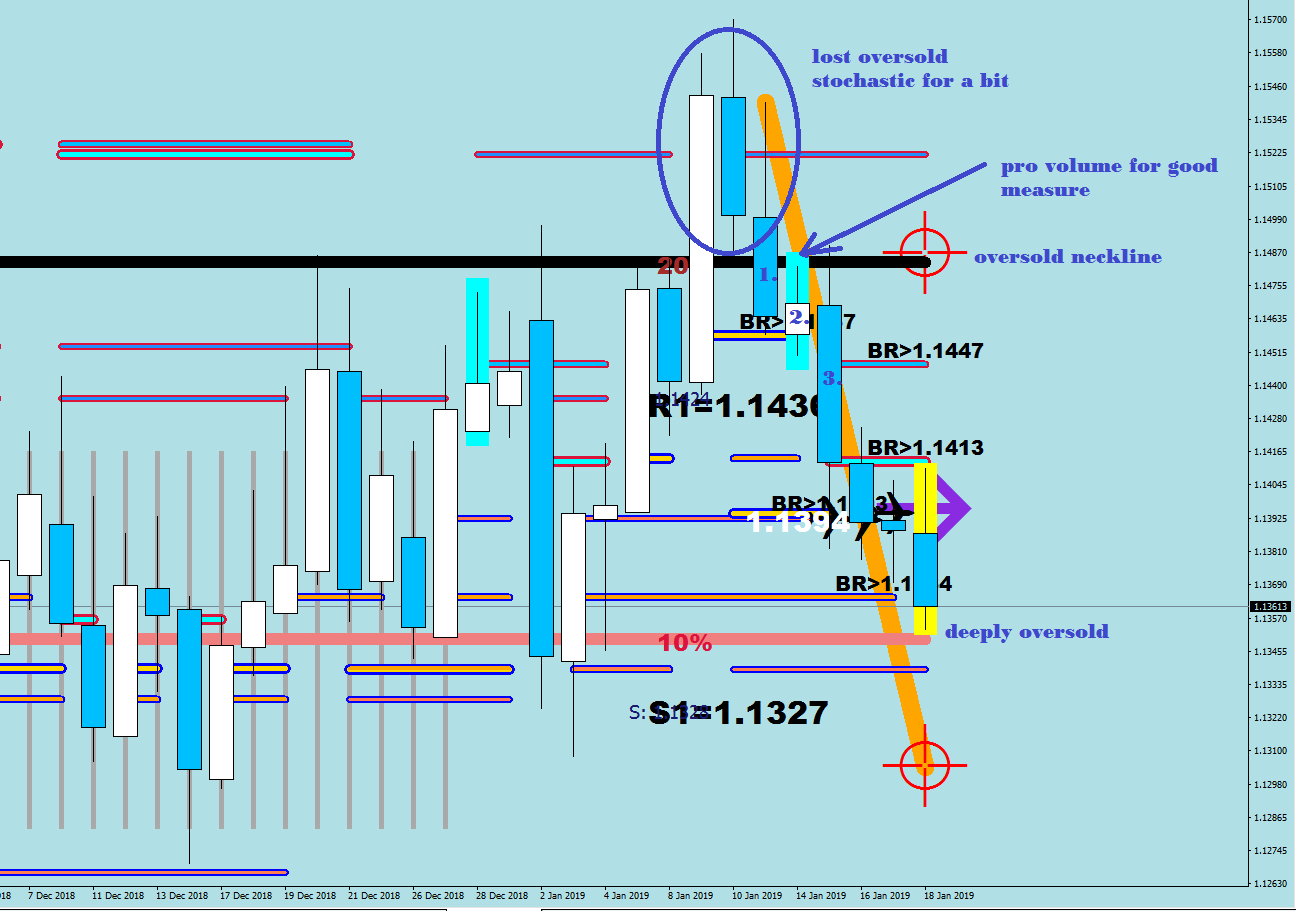
  1. With daily closes back below the oversold neckline, the price re-embedded – meaning started trending.

If my name was Oscar, I would had been saying every day as a reminder: “Do not fall in love with the upside!”

Let’s insert here the next image and discuss it in the context of D Days later…

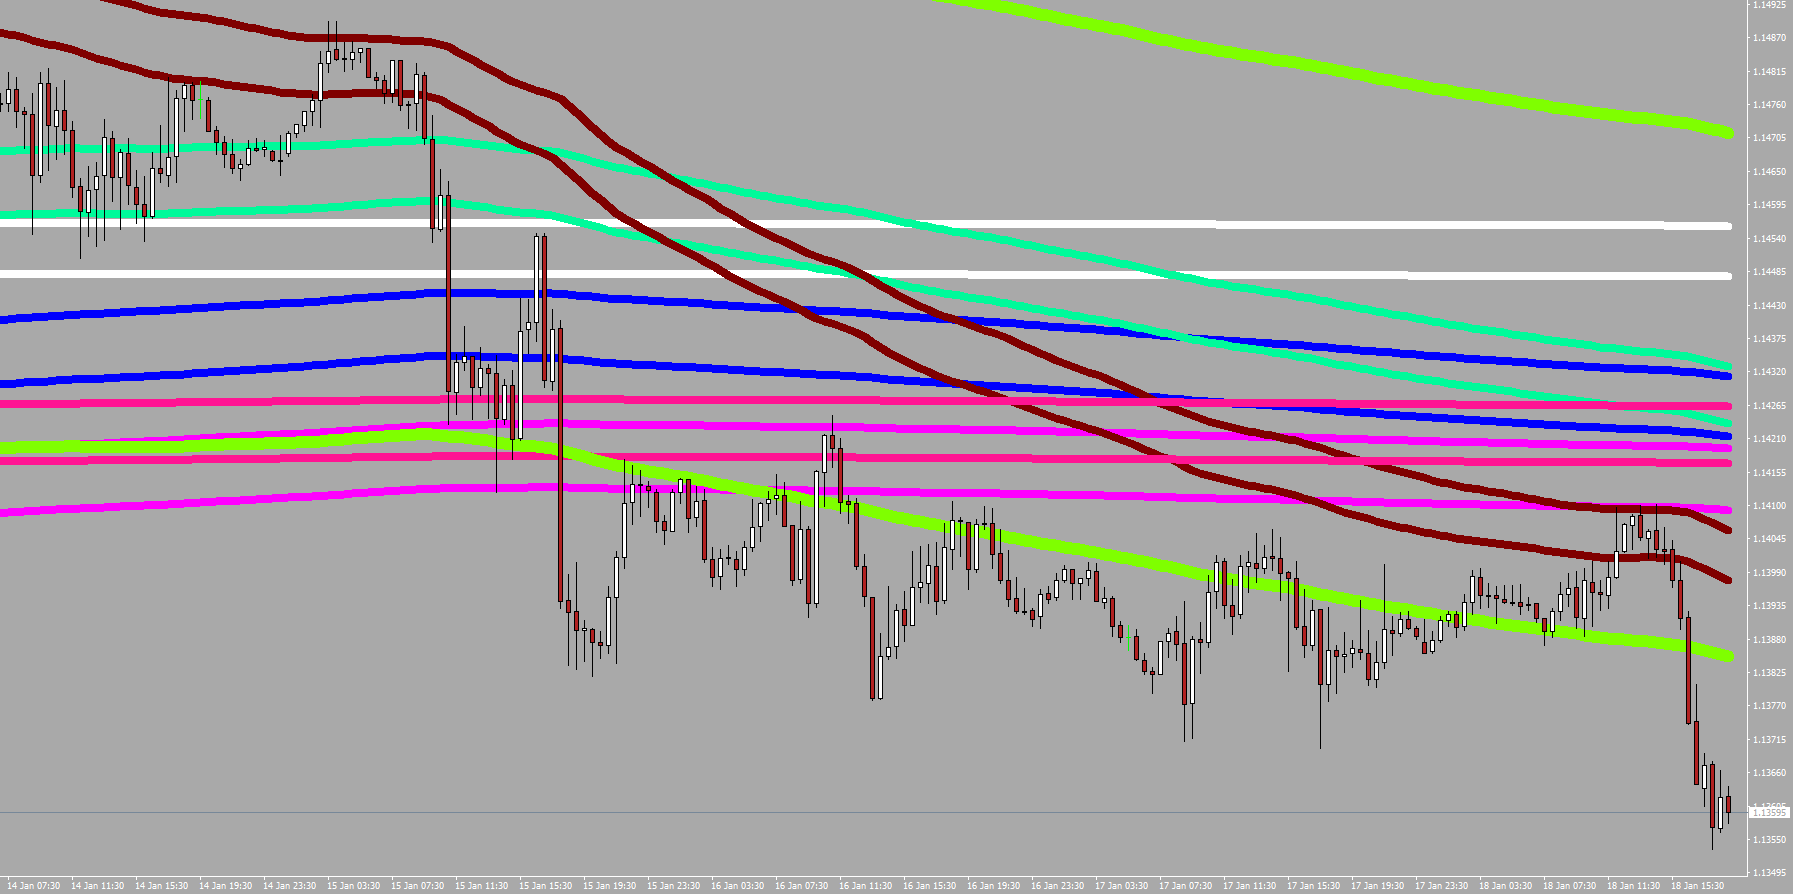
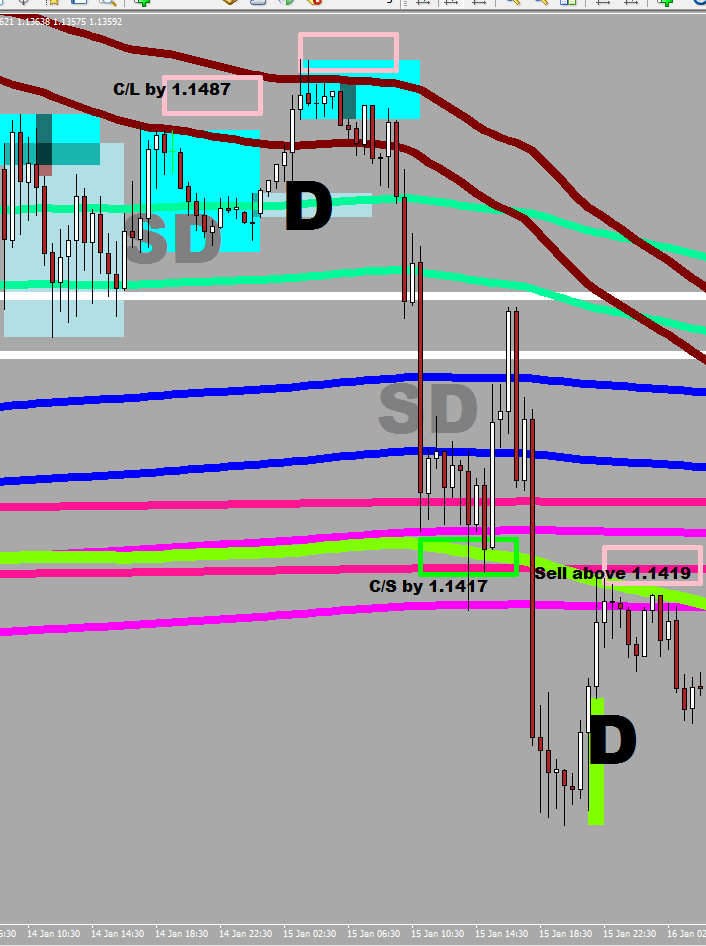
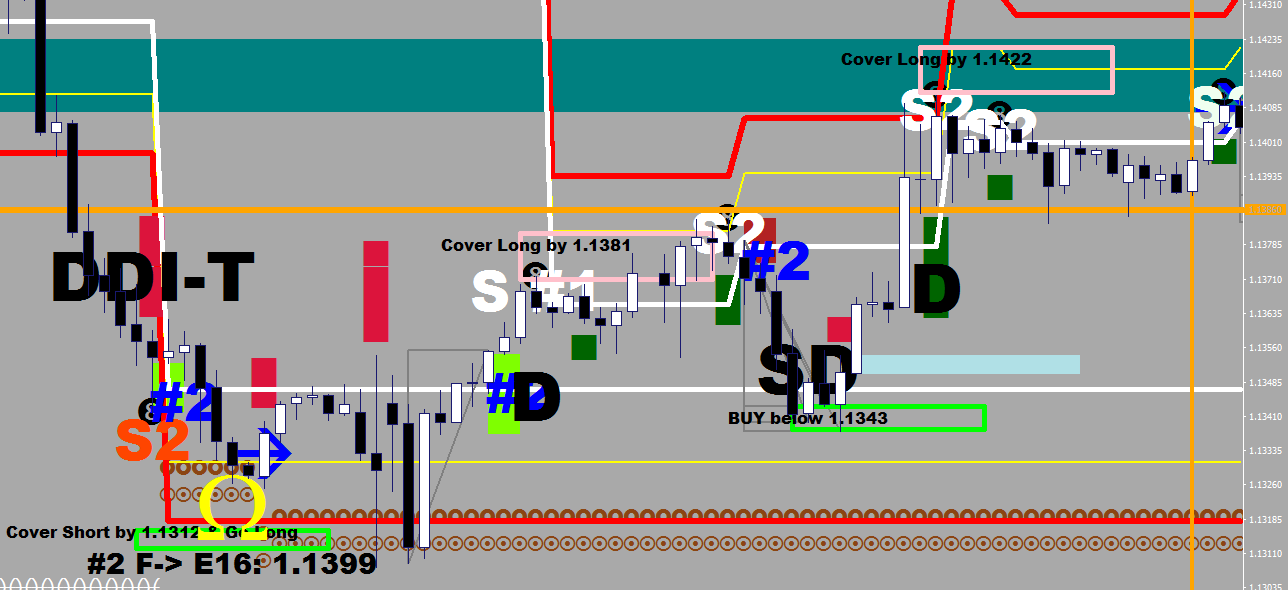
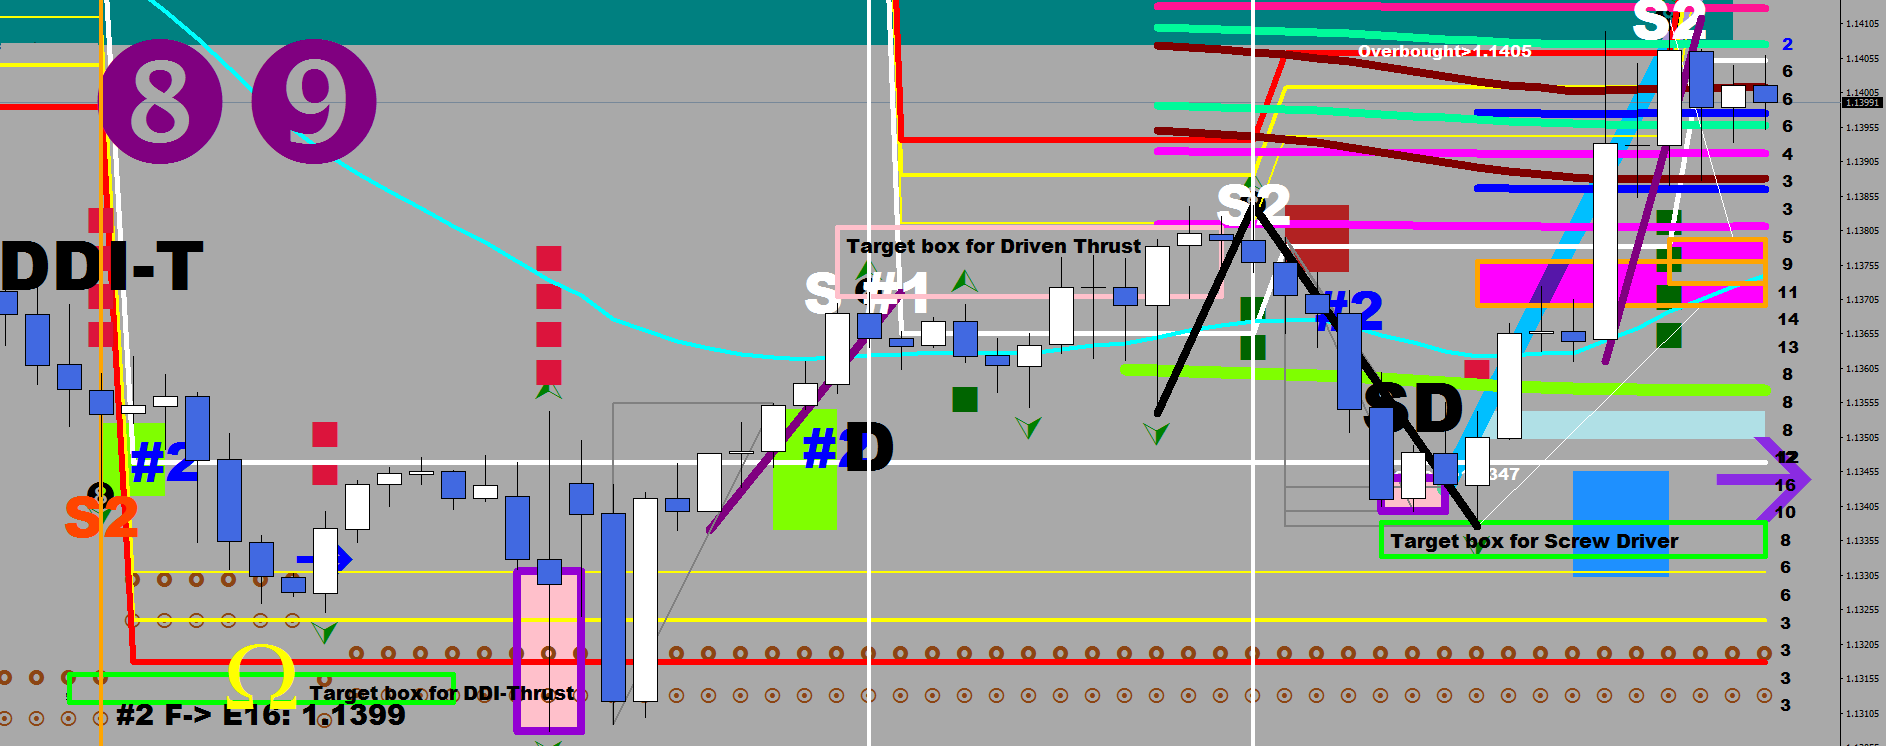
D-Day (Driven Day) #1 to the upside happened upon briefly exceeding Mr. Maroon to the upside. The SD (Screw Drive) got grayed out both to the upside and the downside for being too close to the Mean, the Green River. The close proximity was the reason for them alone not being able to turn back the price.

The second D with its projection box to the upside did not have to turn the direction back down, for it never got turned back up. It was merely a continuation.

I know, double “D”-s can be attractive, and triple D-s, now that sounds confusing. Yet I have 3 more printed since.

The one on the left turned the price back up and had an X, showing no bottom yet – so the stab was expected to happen into the green rectangle.

From then on the direction was up, until today… another D happened on the upside, with another stab – into the projection box, merely 1.5 hours later. Remember the first D I showed you with price slightly exceeding Mr. Maroon? Well, this one did the very same thing.

Finally, the very last D print to the downside… It has its stab distance projection box plotted already. There seems to be limited room for progression right now.

There was a mean reversion in progress that got interrupted forcefully, so better make a mental note of the move being delayed. It would just make it so much more powerful when they let go.

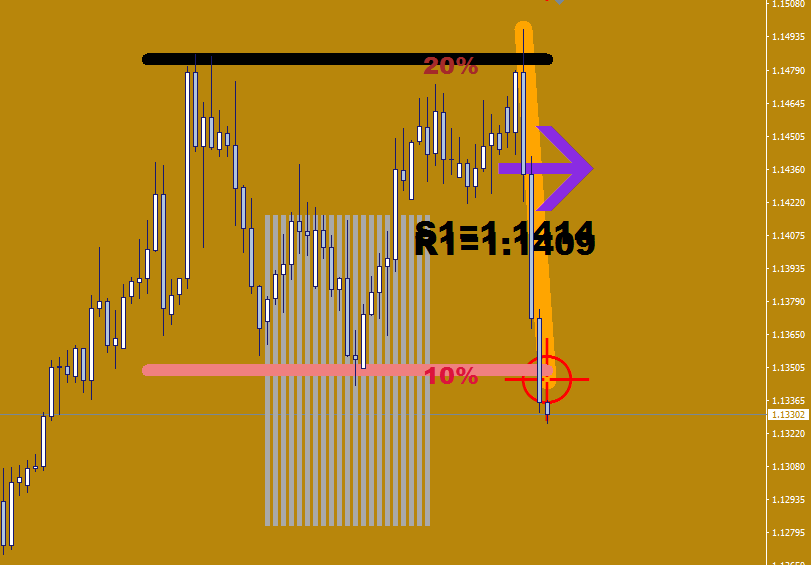
The institution that already bought some at the 10% (deeply oversold) line now has the opportunity to double their bet.

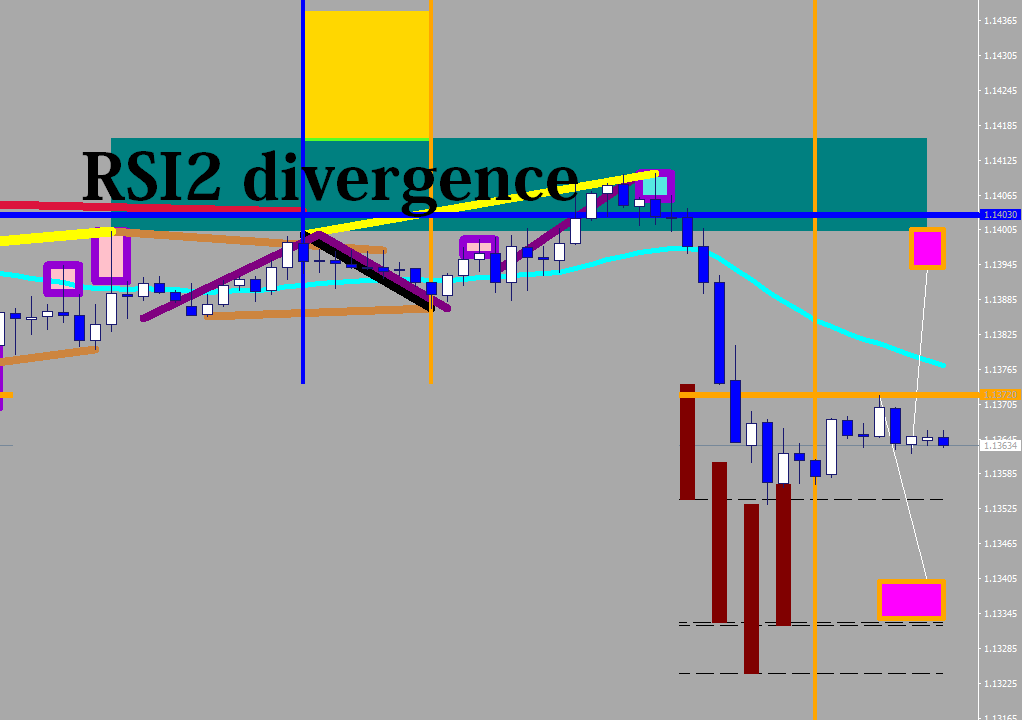
Below: RSI2 divergence as launching pad – for this is rocket science.

First extension filled.

Now, where were them Market Makers at?

Get With the Program pt. 4

First, some actualities.

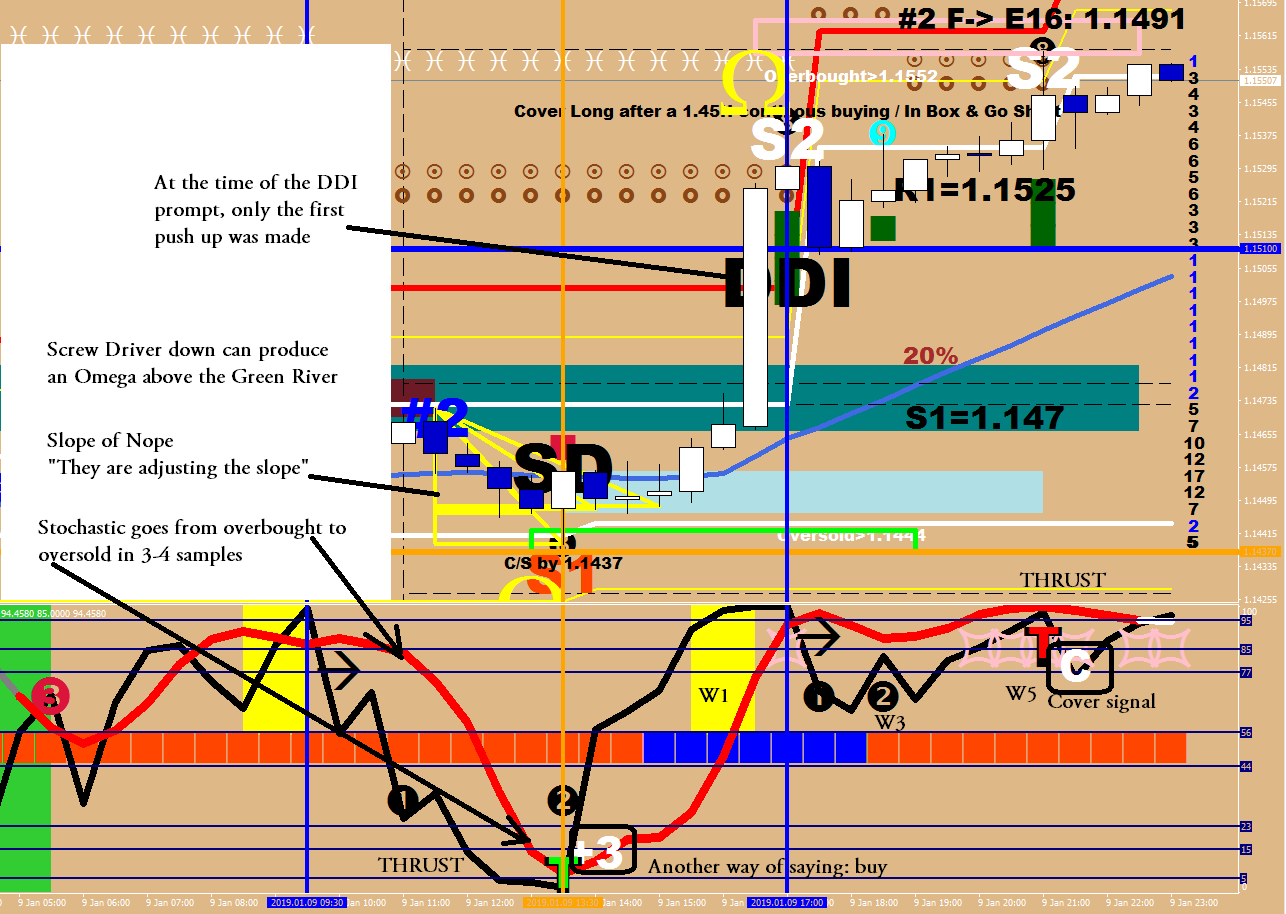
The market printed a D and a DDI to the upside.

The first lesson is: You do not trade what you think, you trade what you see.

And how handy it is that my indicators have visual capabilities way beyond any human being.

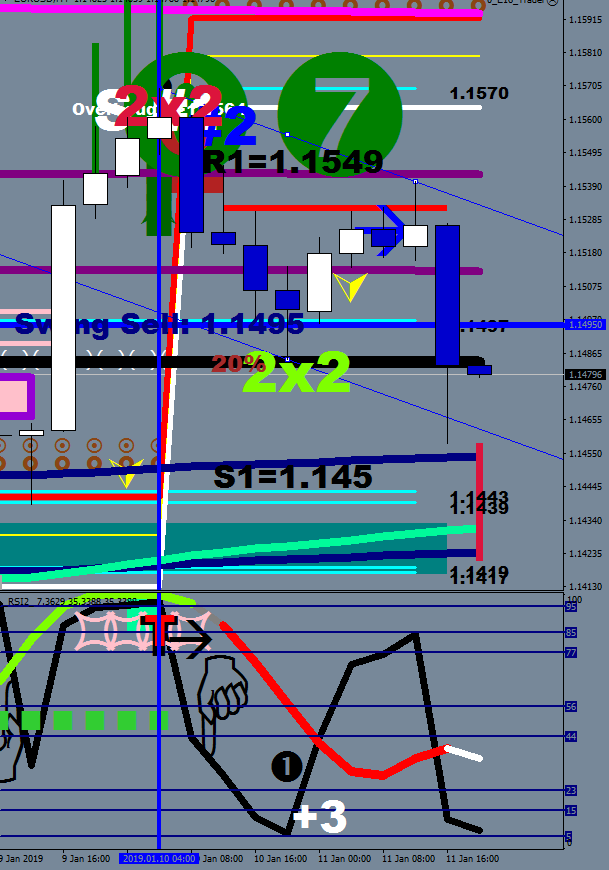
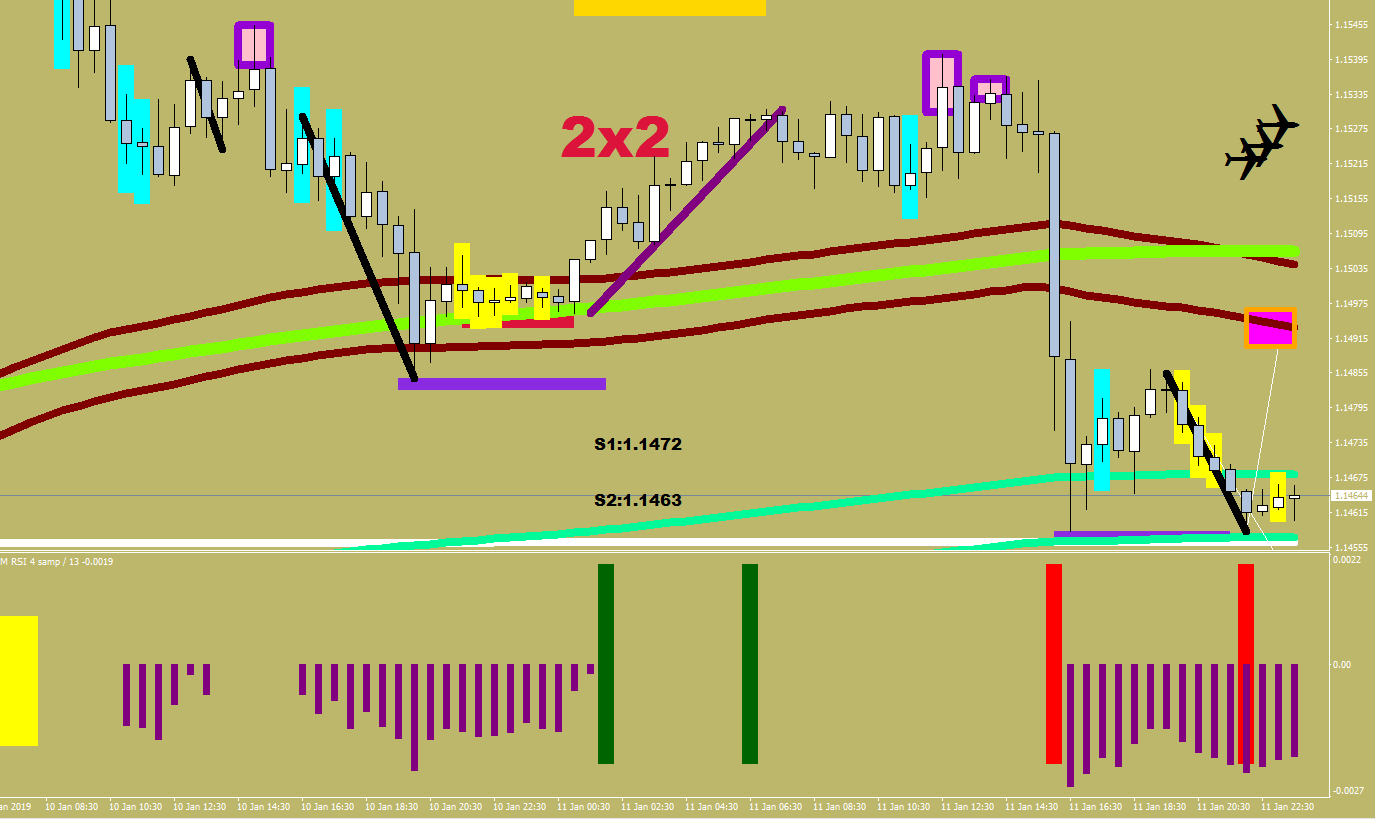
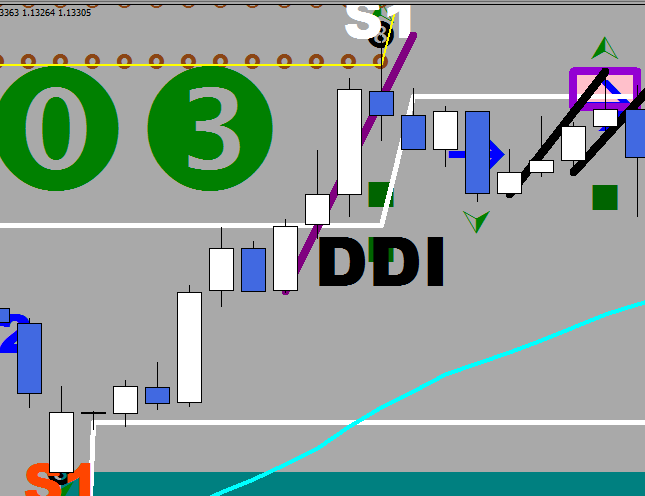
The God Awesome indicator called the swing to the DDI-t high an end line (in purple) and plotted S1 and S2 down below. It also highlighted the sharpies at the very top. The red 2×2 preliminary topping warning was from this indicator as well.

Of course you already knew about the swing buy level being at 1.1462 – thanks to my _RSI2_ plots (see previous post).

The 88 Luftballons indicator called the D, plotted its box, called the DDI, put out the omega signals, showed the cyan backed time out resistance, the D to the downside – with its box, etc.

As a human trader to maximize your potential, you need burn some principles inside of you.

Principle #1: Load Up and Let It Run.

In order to invest in a direction, scaling in is advised inside your shopping area. The maximum, invested size is based on the available equity, and my 88 Luftballon’s stats screen, can provide you with this information. (M.L.=Maximum Lot size based on 1:200 leverage)

The positions would have to be opened without stop losses. Your flash crash protection should be a Ratio Hedger running in the background.

You should set a generous target to an obstacle near to what the market is capable of reaching to on the given day (see my 15-min ATR Targets) routine. The current swing lines are always players.

Upon receiving the any D print (SD, D, DDI, DDI-T), you should adjust the positions to and “other than 0”. This means for instance with the EUR/USD that the longs would be set say 0.1 stop loss and the shorts 2.0

With this move you instruct my Smart Trail Stop to start handling the running positions as “game” which would result in a trail stop being dragged behind by 1/2 fluctuation size (16 pips).

You should also consider closing out some of the positions inside the D-projection boxes.

Between the 2, 2x2s you have a channel looking thing going on. Price is back in the oversold, and this looks like a bull flag.

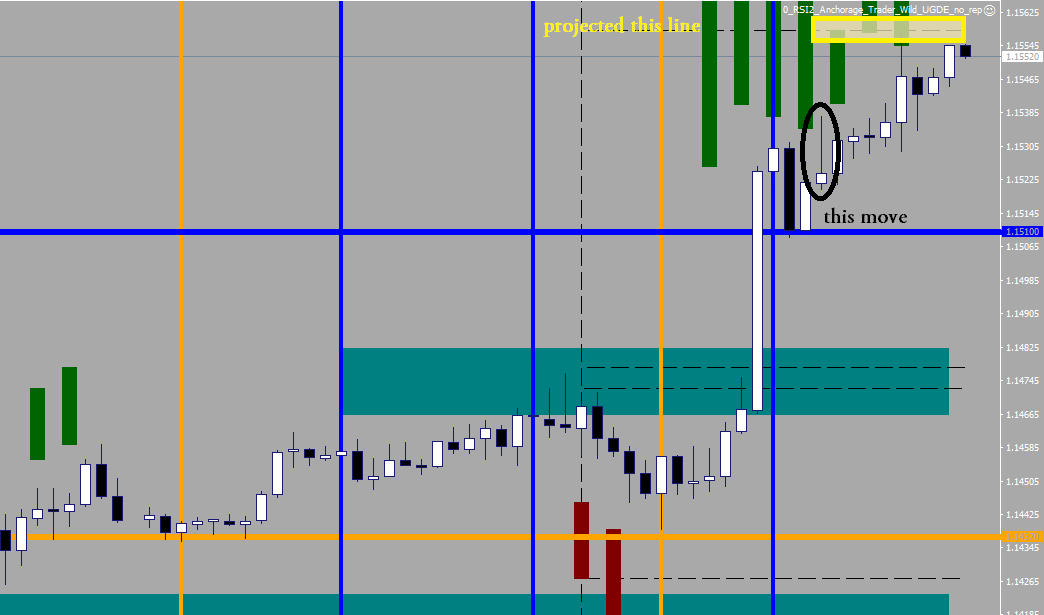
There are certainly things pointing to 1.1416, the lower reversal zone showed by the Comfort Levels 4H indicator, so does the 15M ATR Limit, not to mention my Market Maker Lines DC (plus the Projected Distance line above on the 4H chart).

We have to take it one step at the time. We think about the possibilities, but we do not fight the market. At this point we need a D, any D on the upside to go short again. Until then, don’t short!

The current pullback to the Green River is a mean reversion, and this is way more bullish than bearish.


Get With the Program pt. 3

Two more images for you first, then we’re going to continue with the heavy part.

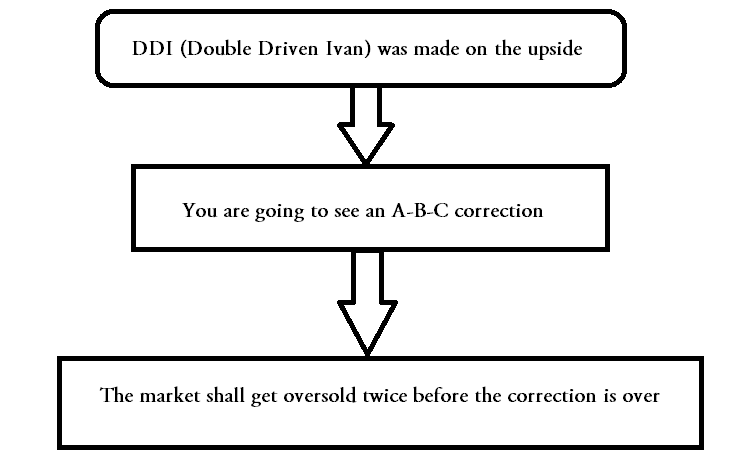
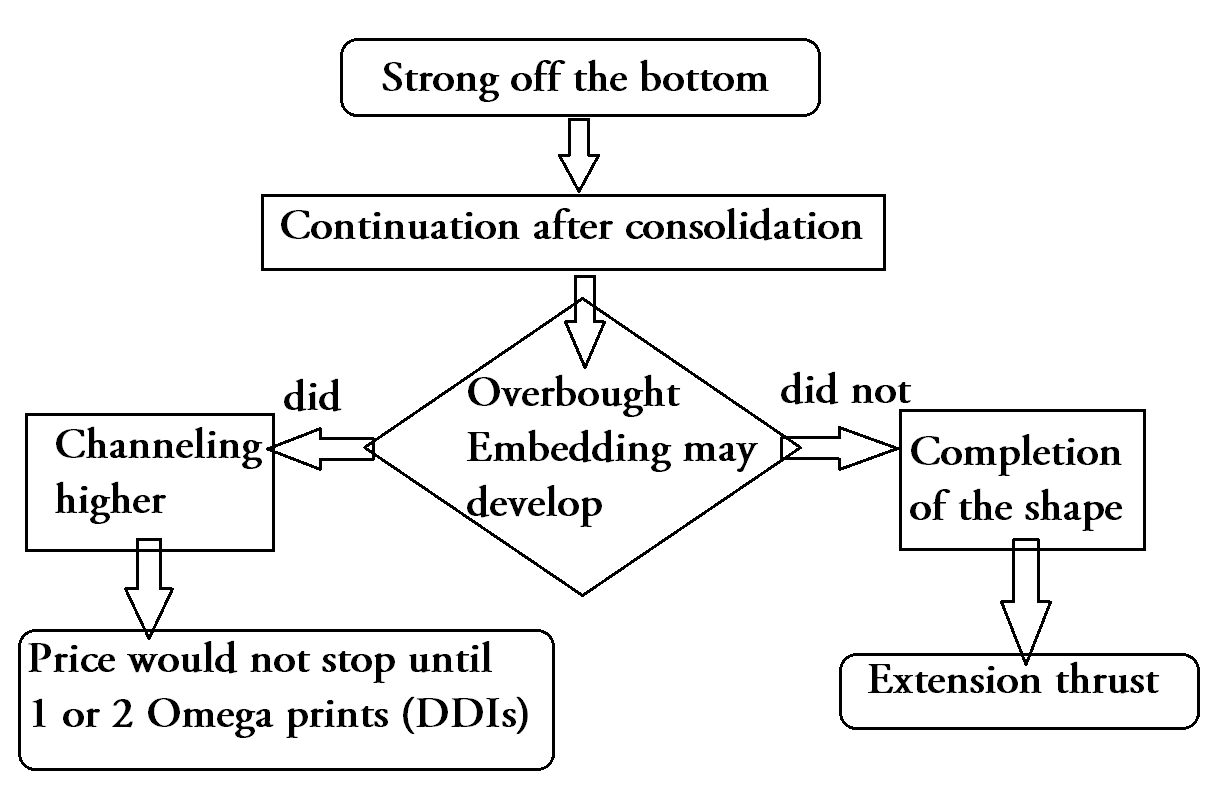
Flow chart piece – easy enough still.

Now, for some fine tuning / sophistication.

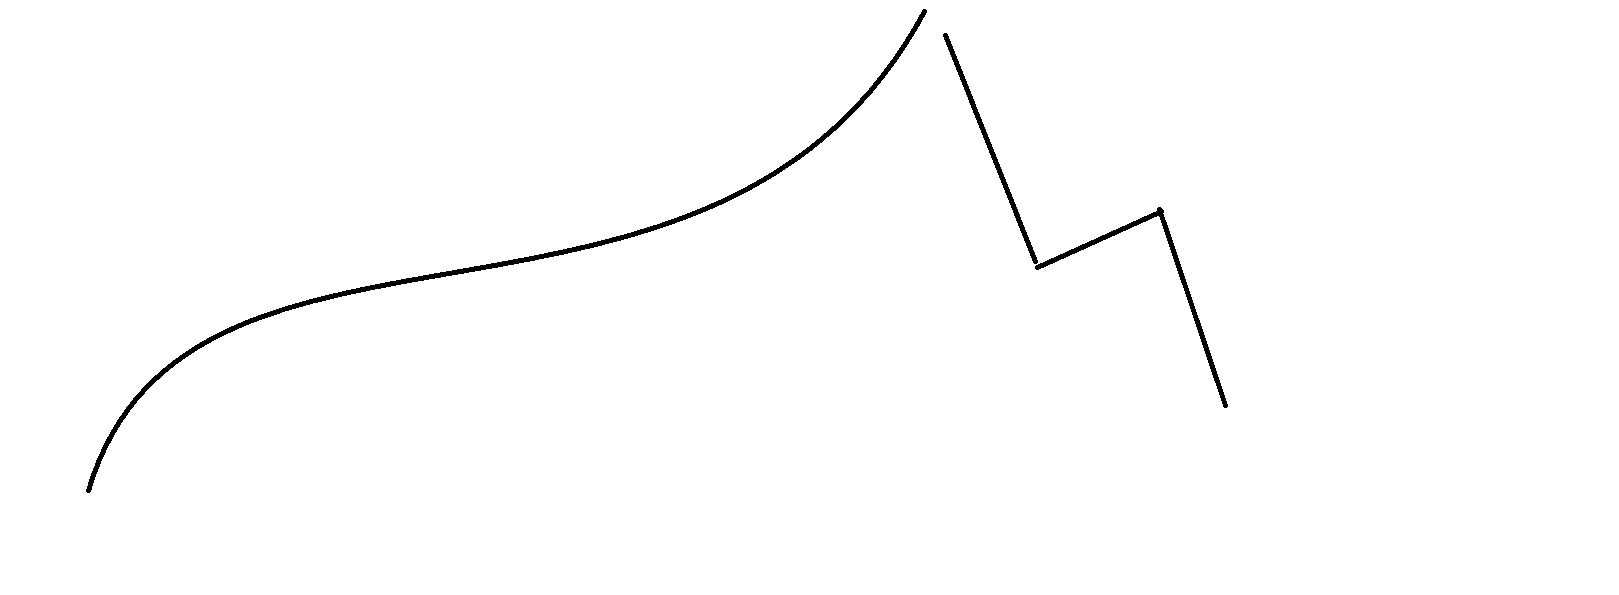
You could read off the images that the 2 bull – 2 bear and the reverse are the tell tales of a sharp turn, or a crazy Ivan move.

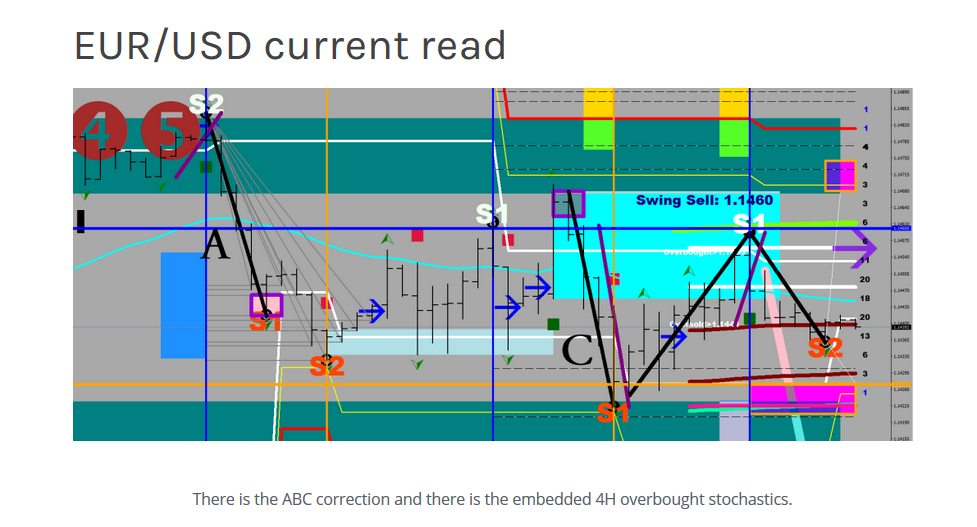
Let’s try to find parallels and differences between the two ABC corrections of late. Our timing device is a 13 and a 44 sample Hull MA, their relationship plotted at the bottom.

This sell-off had the rationale to back test a break out / RSI2 divergence level.

It had impulsive waves at the beginning and at the end mirroring the other’s steepness / speed.

The length of the B wave was about equal to the length of A wave + C wave.

The total correction took about 30 bars = 15 hours.

The rationale was to back test a break out / RSI2 divergence level, but it failed to punch into it.

Impulsive strength selling was present towards the ends of the correction, not from the beginning.

The length of the B wave was less than 1/5th of the length of A wave + C wave.

The total correction took about 30 bars = 15 hours.

(The 2×2 text shows the back to back 2 bear 2 bull candles, that normally preceds a top – here it coincides.)

There is one more clue you can read out of the chart with the help of my 88 Luftballon indicator:

There was overt eagerness in selling, for as soon as the Driven box was plotted, it thrusted into it.

I have yet to include the driven condition as a reversal.

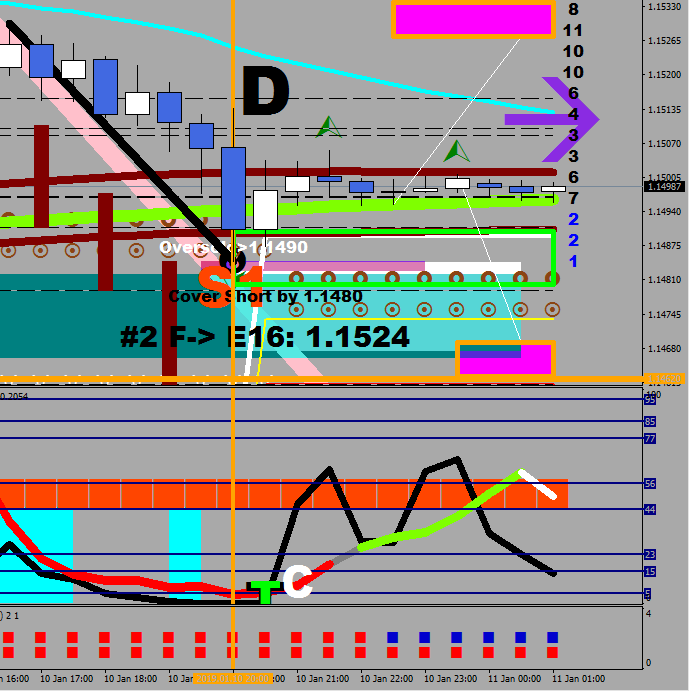
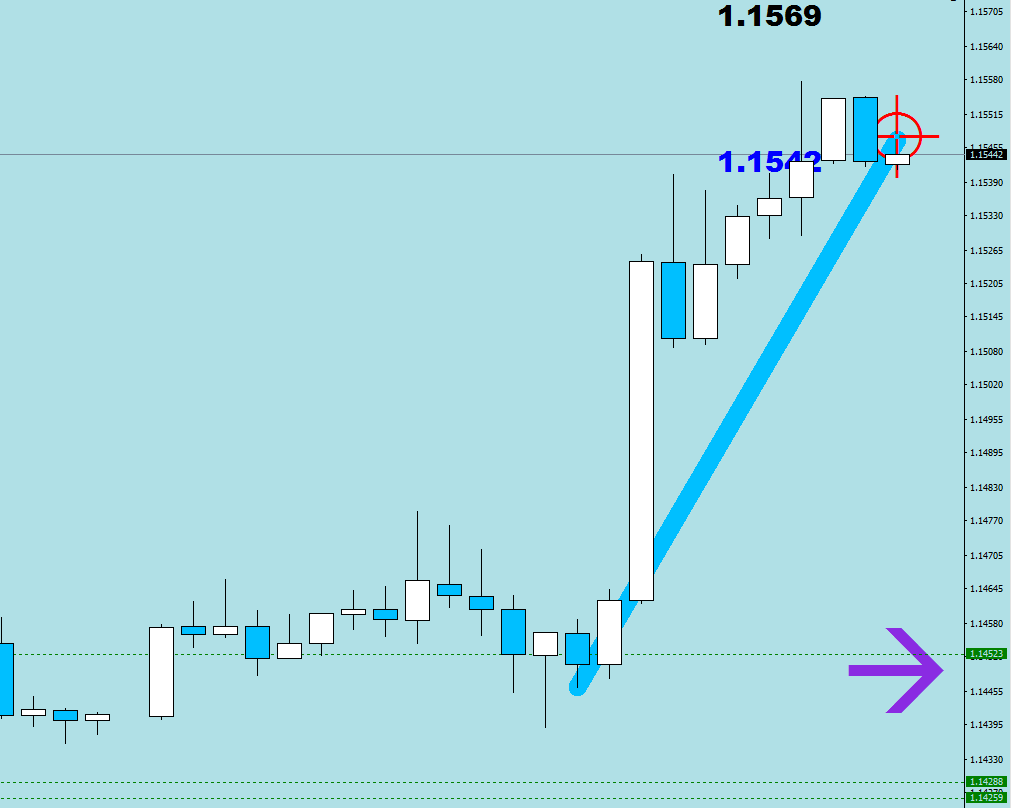
Better. As you can see, one more leg down with terminal length would take price to the Swing Buy level of 1.1462; yet I don’t expect price to reach beyond the teal RSI2 support. From the looks of it this was another shy away from the projected distance line.

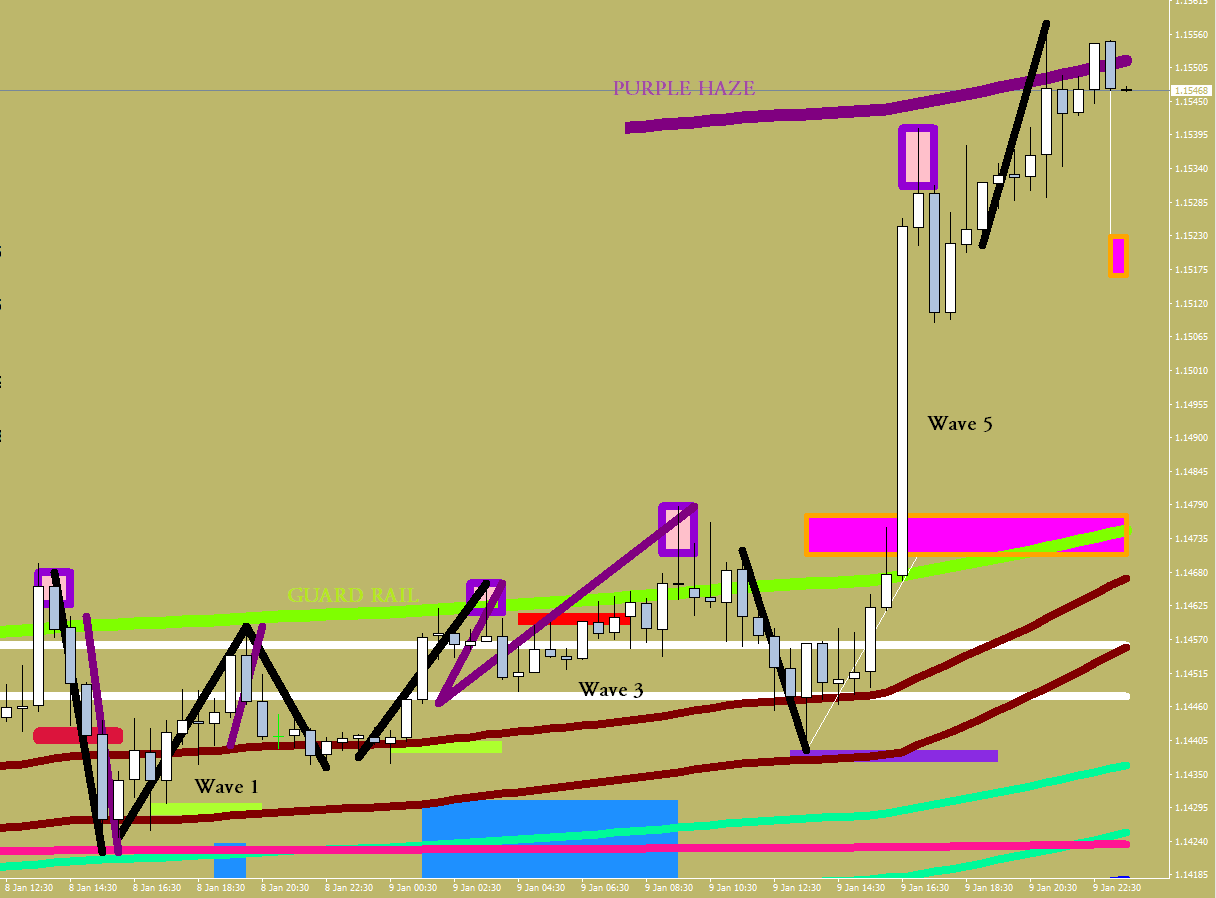
Price just broke the continuation divergence displayed by my God Awesome indicator, and is on the way up to 1.1524. This should be your wave 1 up.

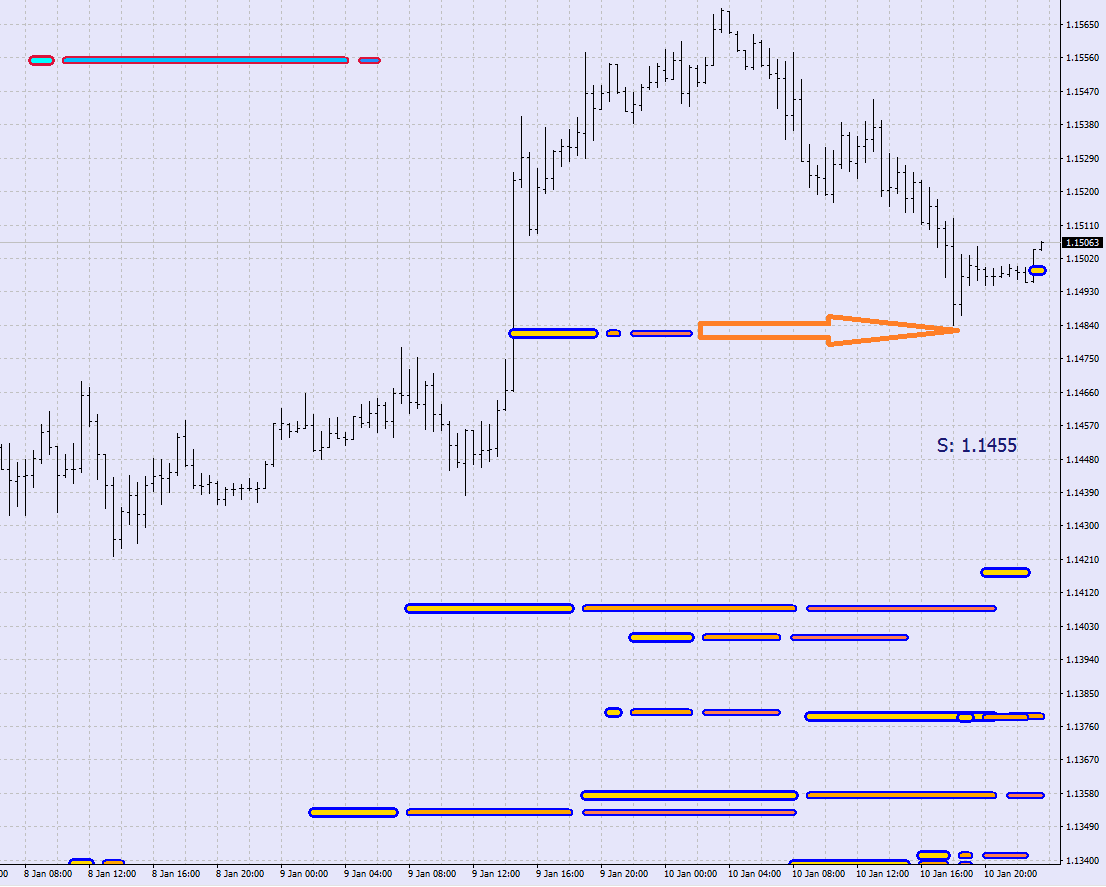
Market Makers had their opportunity to square their shorts.

Get With the Program pt. 2

Today I just brought slides to study from silently.

This was the ATR projection for the day…


There was an article earlier about the Slope of Nope.

Mr. God Awesome was on top of finding terminal length waves (and sharpies), as usual…

In closing, let’s see what my Market Maker lines DC has to say…

Get With the Program pt. 1

To be in picture, you should have a flow chart made up – and helpful indicators don’t hurt either.

Here is your very first entry.

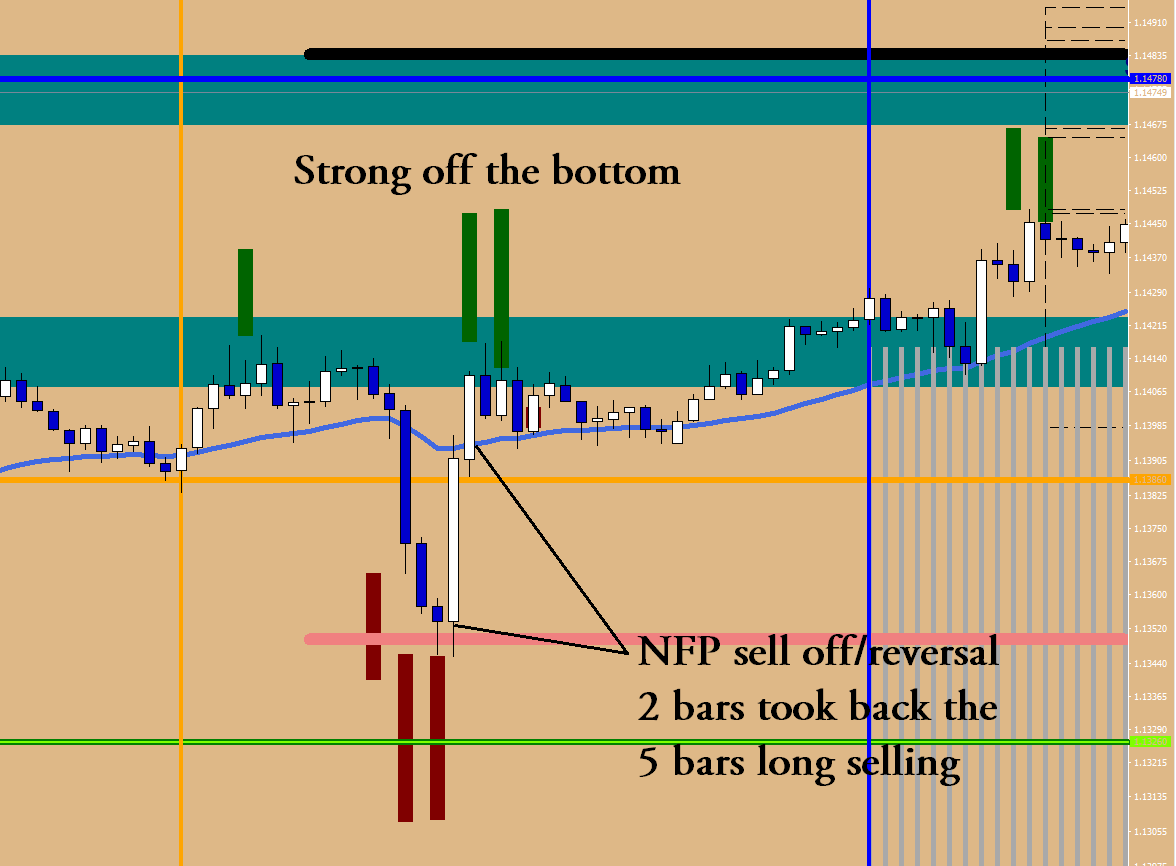
Strong off the bottom. The larger context was that the market made an omega on the 2nd of January due to excessive selling. (This would be displayed by my 88 Luftballons indicator.)
But even if you were not aware any of that, you should still be capable to spot the violent move up that was faster/steeper than the sell off triggered on the NFP Friday. That strong off was the start of the shape.

The Omega was the Alpha of the current move up (multiple hits of the Forest).

The shape covers the scenario where there is no overbought embedding.

It is easiest to have projection values displayed at about 1.5x the length of the initial qualifying move.

I need to start inserting codes in the body for the WordPress new editor does not allow me to upload zips any more.

//Projected_Distance_Lines by Macdulio
#include <stdlib.mqh>
#property copyright "Macdulio" 
#property link      "https://forexfore.blog" 
#property description "Projected Distance Lines Fitted"
#property description ""
#property description "Lines based on 3-hour moves"
#property description "exceeding 1/3 of the last 3-days"
#property description "Average True Range"
#property description ""
#property description "Call them extensions"
#property indicator_chart_window
#property indicator_buffers 15
#property indicator_color1 Black
extern int maxlines = 15; 
extern int displaylength = 25; 
double lines[];
double mid[];
double line1[];
double line2[];
double line3[];
double line4[];
double line5[];
double line6[];
double line7[];
double line8[];
double line9[];
double line10[];
double line11[];
double line12[];
double line13[];
double line14[];
double vbru[];
double line15[];


int init()
  {
   SetIndexBuffer(0,line1);
   SetIndexBuffer(1,line2);
   SetIndexBuffer(2,line3);
   SetIndexBuffer(3,line4);
   SetIndexBuffer(4,line5);  
   SetIndexBuffer(5,line6);
   SetIndexBuffer(6,line7);
   SetIndexBuffer(7,line8);
   SetIndexBuffer(8,line9);
   SetIndexBuffer(9,line10);
   SetIndexBuffer(10,line11);  
   SetIndexBuffer(11,line12);   
   SetIndexBuffer(12,line13);
   SetIndexBuffer(13,line14);
   SetIndexBuffer(14,line15);  
                
   SetIndexStyle(0,DRAW_LINE,1,1,indicator_color1);
   SetIndexStyle(1,DRAW_LINE,1,1,indicator_color1);
   SetIndexArrow(0,140);    
   SetIndexArrow(1,141);    
   SetIndexStyle(2,DRAW_LINE,1,1,indicator_color1);     
   SetIndexStyle(3,DRAW_LINE,1,1,indicator_color1);
   SetIndexStyle(4,DRAW_LINE,1,1,indicator_color1);
   SetIndexStyle(5,DRAW_LINE,1,1,indicator_color1);  
   SetIndexStyle(6,DRAW_LINE,1,1,indicator_color1);
   SetIndexStyle(7,DRAW_LINE,1,1,indicator_color1);
   SetIndexStyle(8,DRAW_LINE,1,1,indicator_color1);     
   SetIndexStyle(9,DRAW_LINE,1,1,indicator_color1);
   SetIndexStyle(10,DRAW_LINE,1,1,indicator_color1);
   SetIndexStyle(11,DRAW_LINE,1,1,indicator_color1);
   SetIndexStyle(12,DRAW_LINE,1,1,indicator_color1);     
   SetIndexStyle(13,DRAW_LINE,1,1,indicator_color1);
   SetIndexStyle(14,DRAW_LINE,1,1,indicator_color1);


   return(0);
  }

int start()
  {

   int      i,pos,c_b=IndicatorCounted();;
  ArrayResize(lines, maxlines);
  ArrayInitialize(lines, 0);
  ArrayResize(line1, 100);
  ArrayInitialize(line1, 0);  
  ArrayResize(line2, 100);
  ArrayInitialize(line2, 0);  
  ArrayResize(line3, 100);
  ArrayInitialize(line3, 0);    
  ArrayResize(line4, 100);
  ArrayInitialize(line4, 0);  
  ArrayResize(line5, 100);
  ArrayInitialize(line5, 0);  
  ArrayResize(line6, 100);
  ArrayInitialize(line6, 0);  
  ArrayResize(line7, 100);
  ArrayInitialize(line7, 0);    
  ArrayResize(line8, 100);
  ArrayInitialize(line8, 0);    
  ArrayResize(line9, 100);
  ArrayInitialize(line9, 0);    
  ArrayResize(line10, 100);
  ArrayInitialize(line10, 0);  
  ArrayResize(line11, 100);
  ArrayInitialize(line11, 0);    
  ArrayResize(line12, 100);
  ArrayInitialize(line12, 0);    
  ArrayResize(line13, 100);
  ArrayInitialize(line13, 0);      
  ArrayResize(line14, 100);
  ArrayInitialize(line14, 0);  
  ArrayResize(line15, 100);
  ArrayInitialize(line15, 0);  
    ArrayResize(vbru, Bars);
   ArrayInitialize(vbru, 0); 
    ArrayResize(mid, Bars);
   ArrayInitialize(mid, 0);     


 pos=0;
 
 double ATRAVG=(iATR(NULL,1440,14,1)+iATR(NULL,1440,14,2)+iATR(NULL,1440,14,3))/3;
  for(i=30; i>=0; i--) {  
              if ((iHigh(NULL,60,i+3)-iLow(NULL,60,i))>ATRAVG/3 ||  (iHigh(NULL,60,i)-iLow(NULL,60,i+3))>ATRAVG/3 ) {
                  if (iHigh(NULL,60,i)>iHigh(NULL,60,i+3)) {vbru[pos]=iHigh(NULL,60,i)+(iHigh(NULL,60,i)-iLow(NULL,60,i+3))*.55; pos=pos+1; }
                  else  {vbru[pos]=iLow(NULL,60,i)-(iHigh(NULL,60,i+3)-iLow(NULL,60,i))*.55; pos=pos+1;                        }
     }
  }       

pos=0;

  for (i=1; i<=250; i++)
   {
        if (vbru[i]>0){  mid[pos]= vbru[i]; pos=pos+1;}
   }


i=0;
   while(i<maxlines && pos>0)        
            {
               if (i==pos) break;
               if (mid[i]!=EMPTY_VALUE) lines[i]=mid[i];
               i++;
            }

   for (i=0; i<=displaylength-1; i++) {
      if (lines[0]>0) line1[i]=lines[0];
      if (lines[1]>0) line2[i]=lines[1];
      if (lines[2]>0) line3[i]=lines[2];
      if (lines[3]>0) line4[i]=lines[3];
      if (lines[4]>0) line5[i]=lines[4];
      if (lines[5]>0) line6[i]=lines[5];
      if (lines[6]>0) line7[i]=lines[6];
      if (lines[7]>0) line8[i]=lines[7];                
      if (lines[8]>0) line9[i]=lines[8];
      if (lines[9]>0) line10[i]=lines[9]; 
      if (lines[10]>0) line11[i]=lines[10];
      if (lines[11]>0) line12[i]=lines[11];
      if (lines[12]>0) line13[i]=lines[12];
      if (lines[13]>0) line14[i]=lines[13];
      if (lines[14]>0) line15[i]=lines[14];
       
}

  return(0);
}

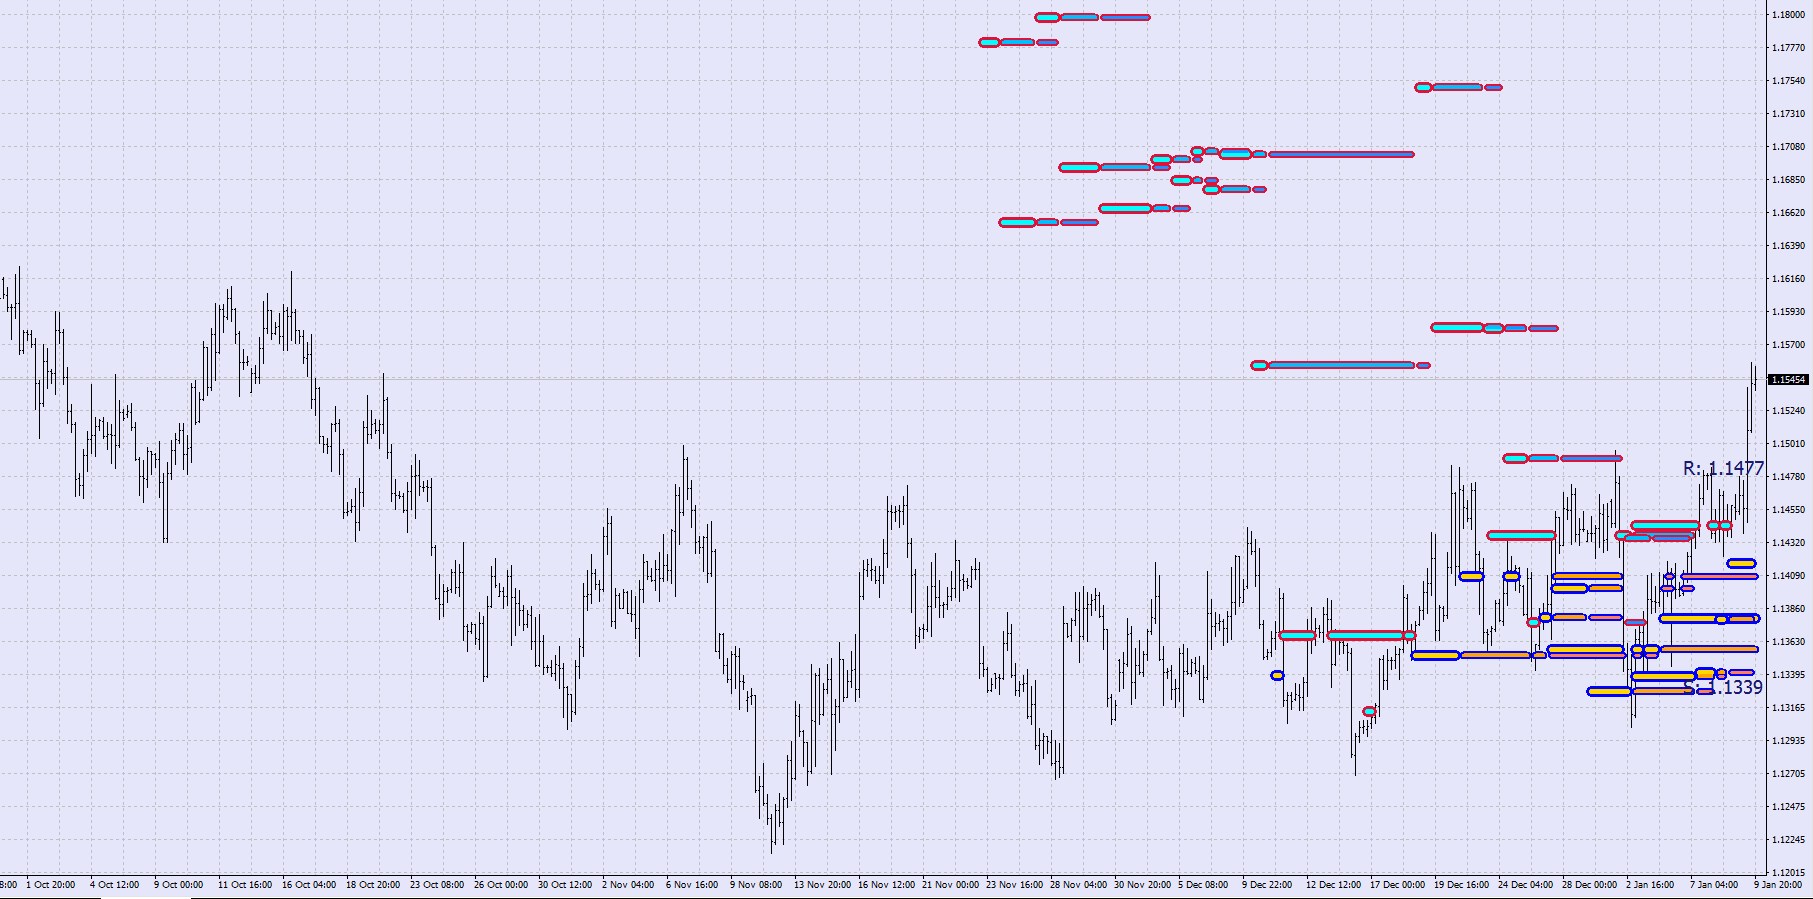
With the above routine you could had had a good idea about where the thrust could had arrived at. (You can also find the upside projection value with numbers on the stats screen of the 88 Luftballons, which derives its values from 4H samples vs the one here, that uses 1H data).

(U: lists the last upside projection value, D: the downside, SAR is the 4h parabolic SAR’s next, guestimated value, DP is the Deep Pink or the 4H LEMA.)

In the “Shape” scenario the overbought readings would remain damaging, and do not turn into nurturing.

Now, the other scenario.

You need to define the environment every time coming into the day. Download the free 15-minute ATR targets for getting the daily ATR limits fitted on the chart.

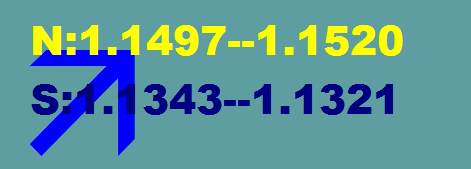
This is a different version, but the same calculation, which is based on the 3-Day Daily Average. N is north, S is south. The closer number is the “overbought”, and the further is the “all out”. Often, the number attained would fall between them. If the “all out” gets exceeded, that may mean a climax / capitulation day. The arrow is merely showing that price is currently above/below the last consolidation mean.

The second very important thing to notice are the (long term) Comfort Levels that I have been citing for quite some time.

The indicator is free, you can find it on the blog.

The purchase of the 10% line points to Institutional buying. The reason was most likely the previous move (that sustained for a while) above the Deep Pink displayed by my LEMA30N indicator (free to download). Such investment would likely have a target at 50% or the very least an additional 25% away from the opening price. 35% is around 1.1680 and 50% is at 1.1890.

Busy image coming up, brace yourself!

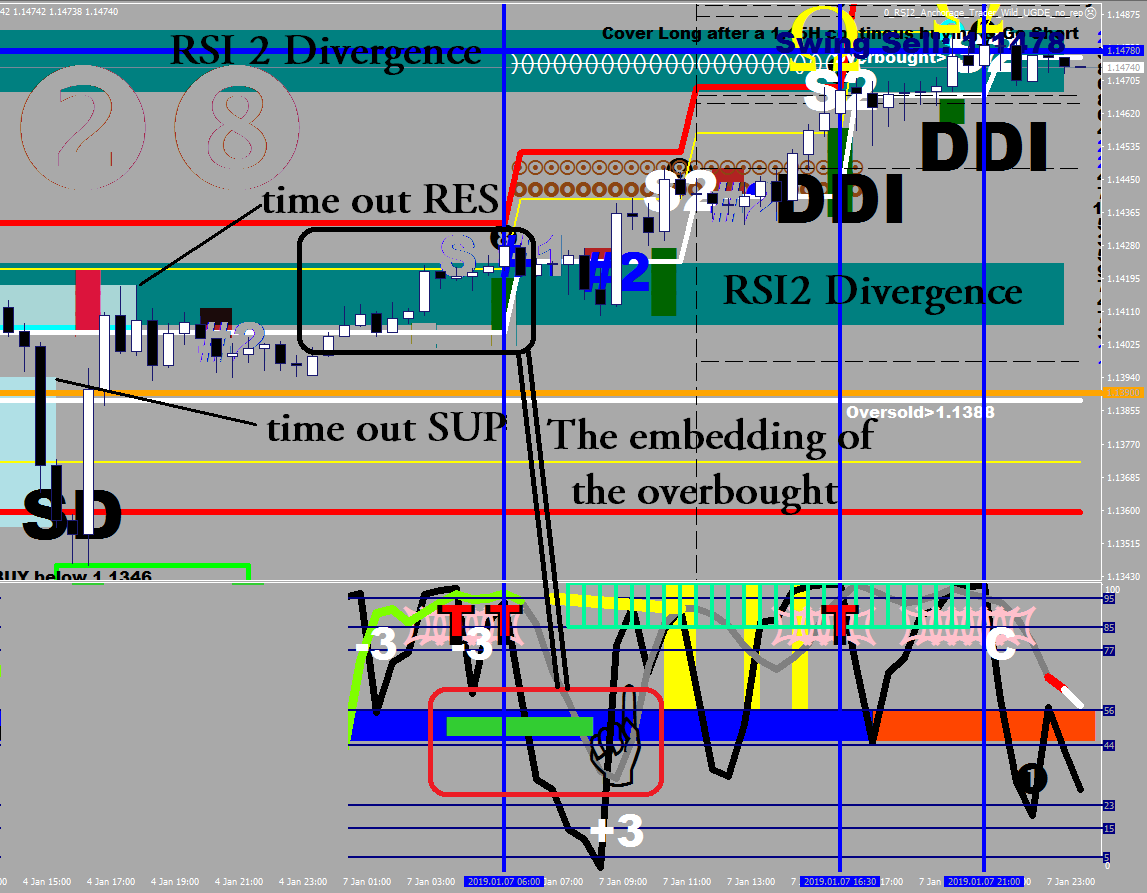
The day ended with a break above the time out support and a consolidation just below the time out resistance. By the time price took out the RSI2 divergence teal field, we had multiple break outs on our hand. Sustaining above the overbought level (white line), after the 4th open, price became embedded, which is one way to describe the trending condition (the indicator on the bottom is my _RSI2_ indicator).


Remember that only excessive / climax buying/selling can permanently reverse the price, and time out stalls, head and shoulders would only have short term effect against the current.

Indicators for sale (ex4 only, no source code)

88 Luftballons – £88 God Awesome V1.5 – £114

_RSI2_ – £55 Market Maker Lines DC – £99

Market Profile Basics

What is the market?

It is an atlas ball, that’s right, it is a snow plow…

The market is also a step down voltage regulator.

Here is what I posted upon seeing the weak structure of the sell-off on the 2nd of January:

Now, where did I get those numbers from? (Not the year, that was somehow not updated by me.)

From the market profile that was displayed by my 88 Luftballons indicator.

(I don’t have a better screen shot for the day, sorry).

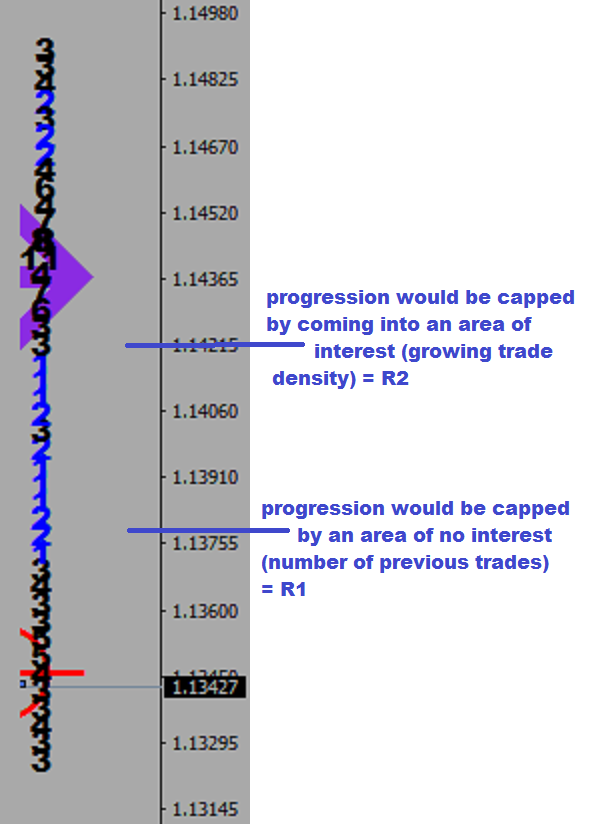
What you need to understand here is that the single prints (ones, twos) are representing the absence of time spent in the area, which comes with lack of interest. People are holding their trapped positions in the blacks, and they cover in the vacuum for a better than break even.

Price would usually penetrate the vacuum a bit, eat up the little amount of orders there, then would turn back.

The step down idea as follows:

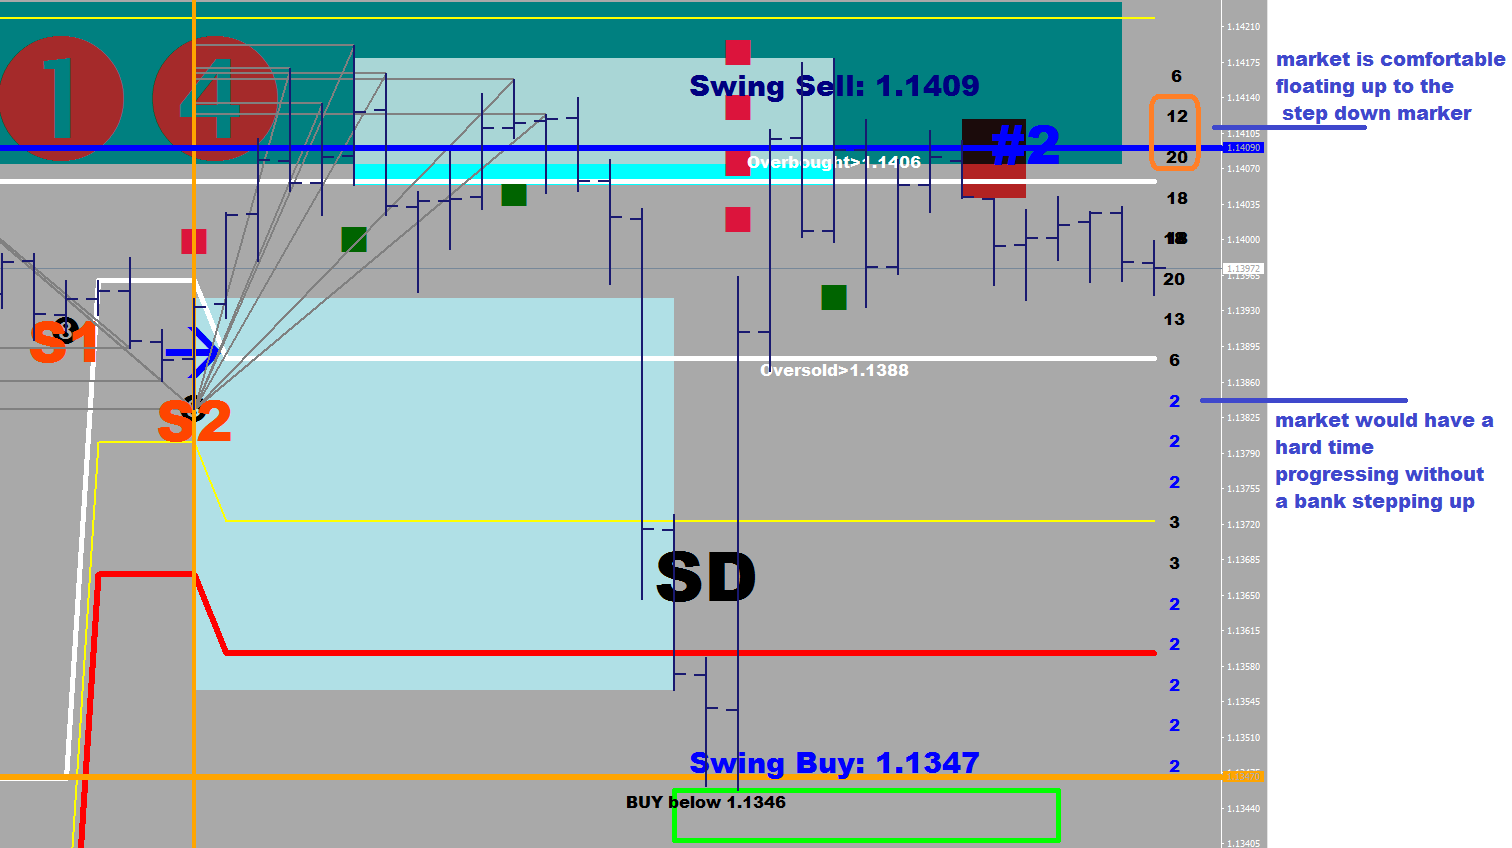
My market profile is displayed on the 30 minute chart. Price can hit another kind of void, the big drop between the step heights. If there is say a 8-10 difference between the numbers, that means that perhaps for close to a length of an entire session (4-5 hours) an are was left out.

Filling in the blue areas is called repair of the structure, for a single prints structure is a weak structure, and is in danger of being re-visited.

Progression in the blue areas is relatively quick because of having not too many orders (but requires continuous buying/selling at market by someone with funds), other than at the step down area, which may cause a reaction first.

Littering the low density space is how the market retraces.

To say something about the future: there is no number above the 6 print, and the upside cannot be considered as finished without an excess (single prints) – that’s another repair to be had.

Market Sports – It Runs

Does the market have a gender?

Perfect timing today; we have just witnessed the soccer / football / consolidation playing both sides yesterday.

A brief gap up – ever so slight – secured the false break on the upside. (Buy the gap fill & go!)

Now, how could you had known that the upside break was doomed?

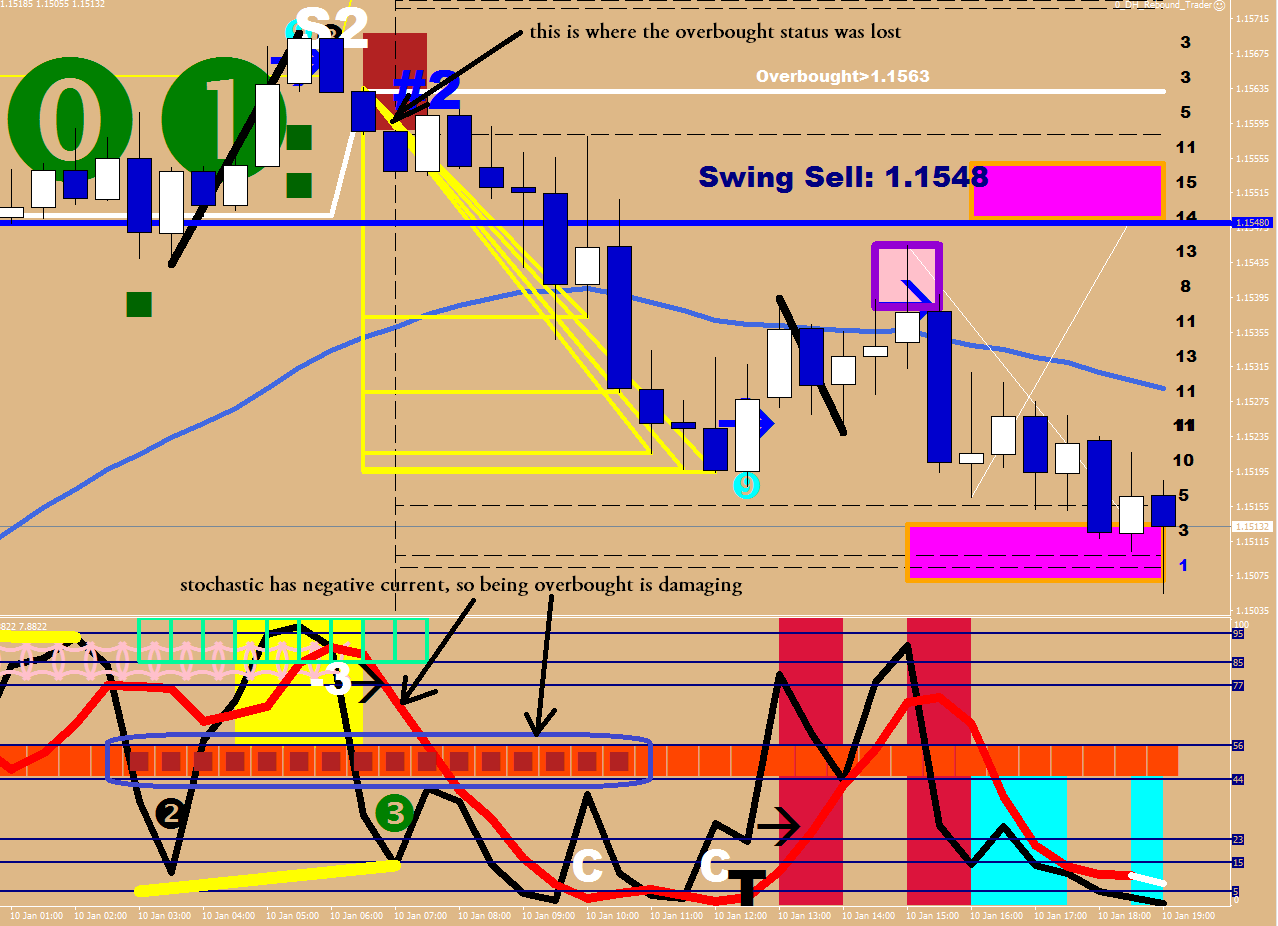
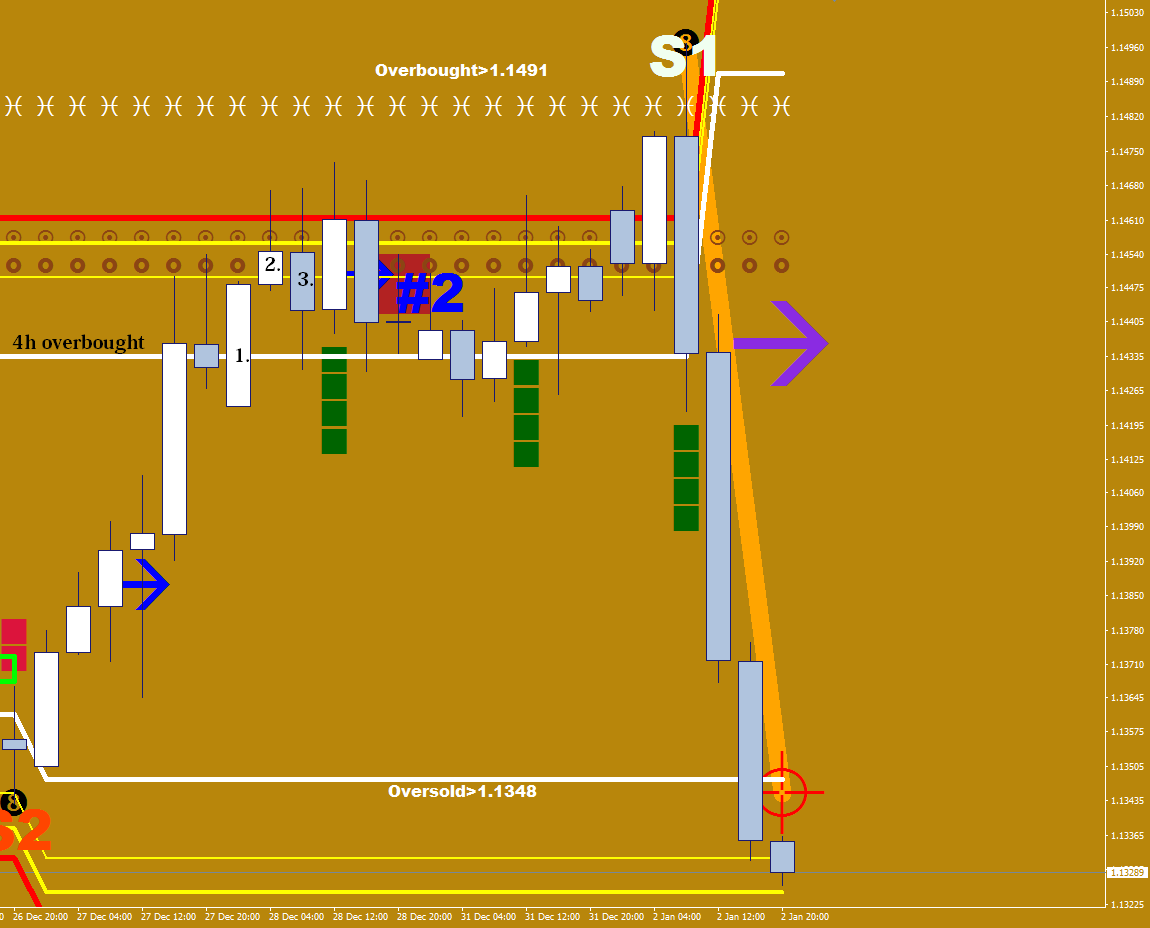
The market was embedded 4H overbought.

After the 3rd close up in the overbought area, the market developed an overbought safety.

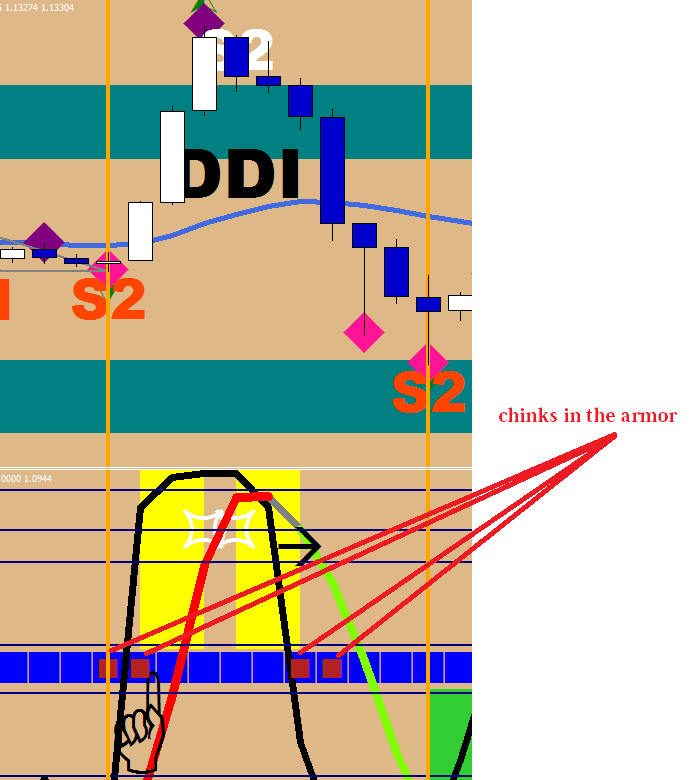
There was 1 close where, the overbought status was briefly lost, but they could save it. Nevertheless, there were chinks showing up in the armor (not a good omen).

But how could you had known if you did not have my _RSI2_ indicator?

For one, you could had downloaded my Comfort Levels 4H for free, to realize that the consolidation was taking place right under the oversold neckline. Not above it.

I kept on mentioning these two numbers on the front page of the blog. The LT (long term) deeply oversold and the LT oversold levels.

The problem with a market that is overbought, that it is not likely to sustain a break, especially not from out of the oversold zone. Granted, the largest and quickest moves come from the zippy commute between the oversold and the overbought necklines – but the consolidation would have to take place in our case above the oversold neckline – which did not happen.

DDI

It stands for Double Driven Ivan (my invention, of course). When the RSI2 starts bending the idle due to a pedal to metal condition, and this persists for at least 1.5 hours or 3 30-minute samples, I call that a drive.

The Double drive is when the Stochastics are also running extra hot (see my Stochastic Bars Mixed – freely downloadable plot and my Wishing on a star article).

The double drive ends up in a taper, a wedge, or a crazy Ivan (same thing). This is why I put the “I” in the title for a reminder.

Please try to figure out what is the common ending of the 3 DDI plots below:


Congratulations, you are not color bind after all, and you may have picked up on the theme of the final burn: the last thrust that is approximately 1.45 hours long. You want to see 3.5 candles alike for the finalé (after a hiccup).

DDI DN

RSI2[i]>5 && RSI2[i+1]<2 && RSI2[i+2]<2 && RSI2[i+3]<2 && ExtMapBuffer2[i+1]==1

---------

DDI UP

RSI2[i]<95 && RSI2[i+1]>98 && RSI2[i+2]>98 && RSI2[i+3]>98 && ExtMapBuffer3[i+1]==1

The DDI plot’s filters above.

You are welcome.

Below: the 3 other members of the Driven family.
Market Sports – Soccer

A consolidation range (aka soccer field) is defined by divergences that outline the perimeter.
When liquidity is low and a consolidation is needed, you should be expecting a consolidation and the soccer play to be contained.

On the last day of the year it isn’t a surprise that most players choose bench warming.

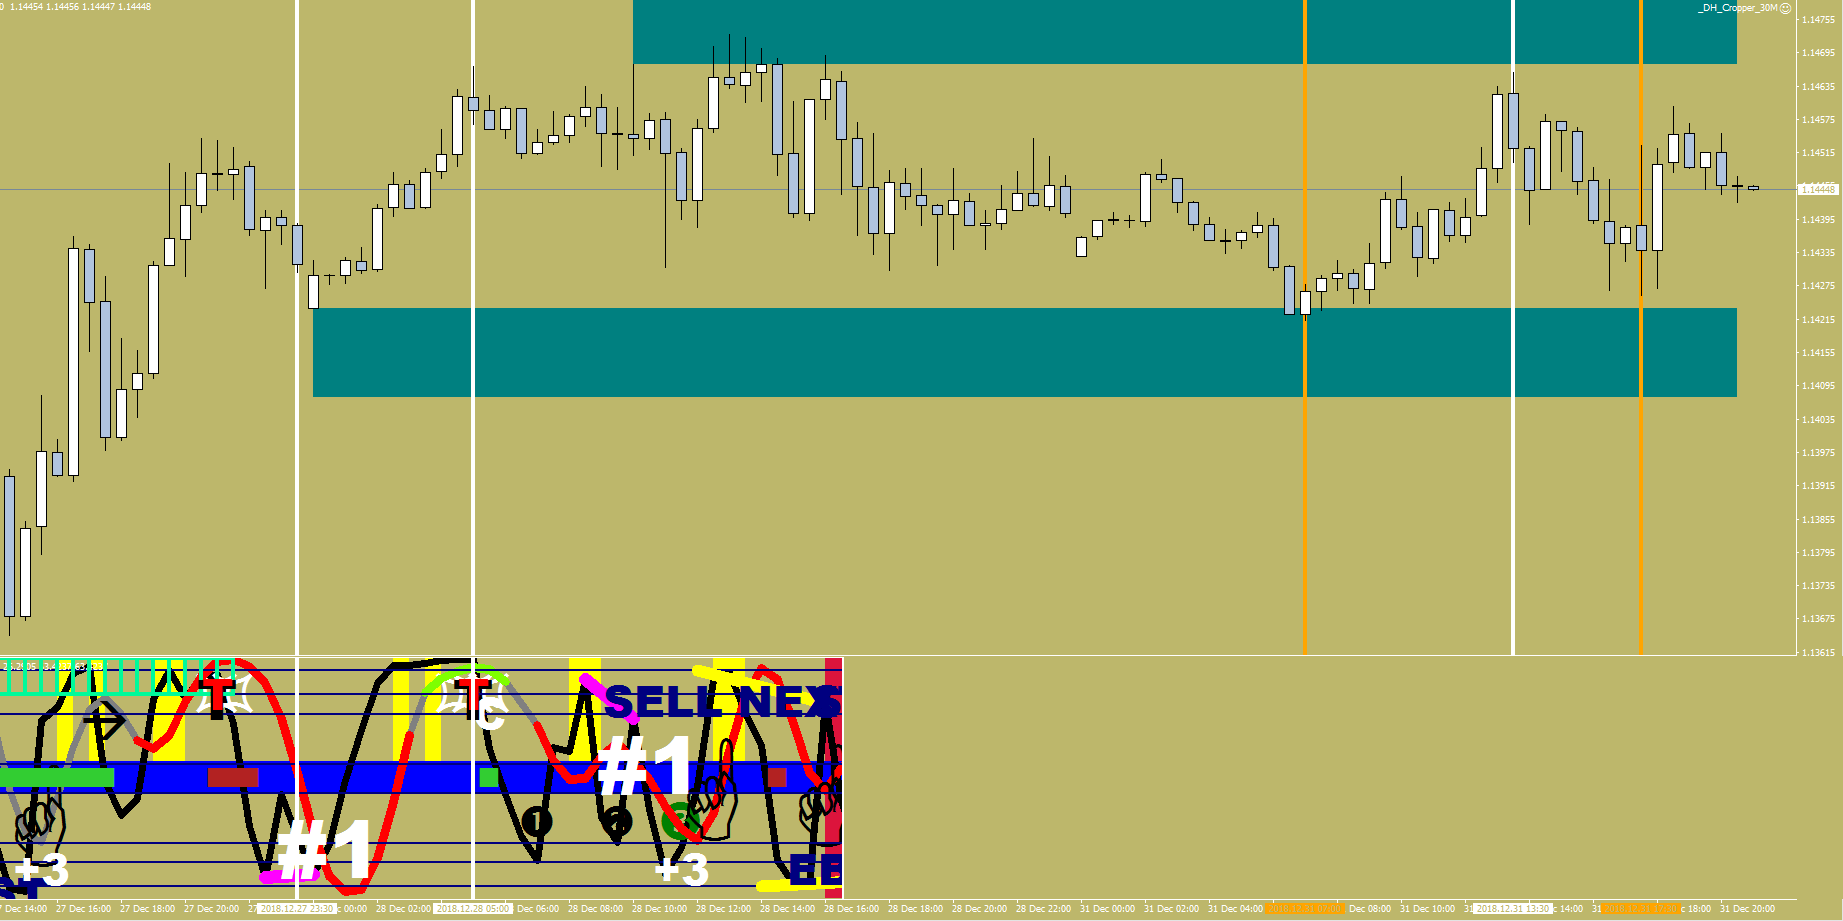
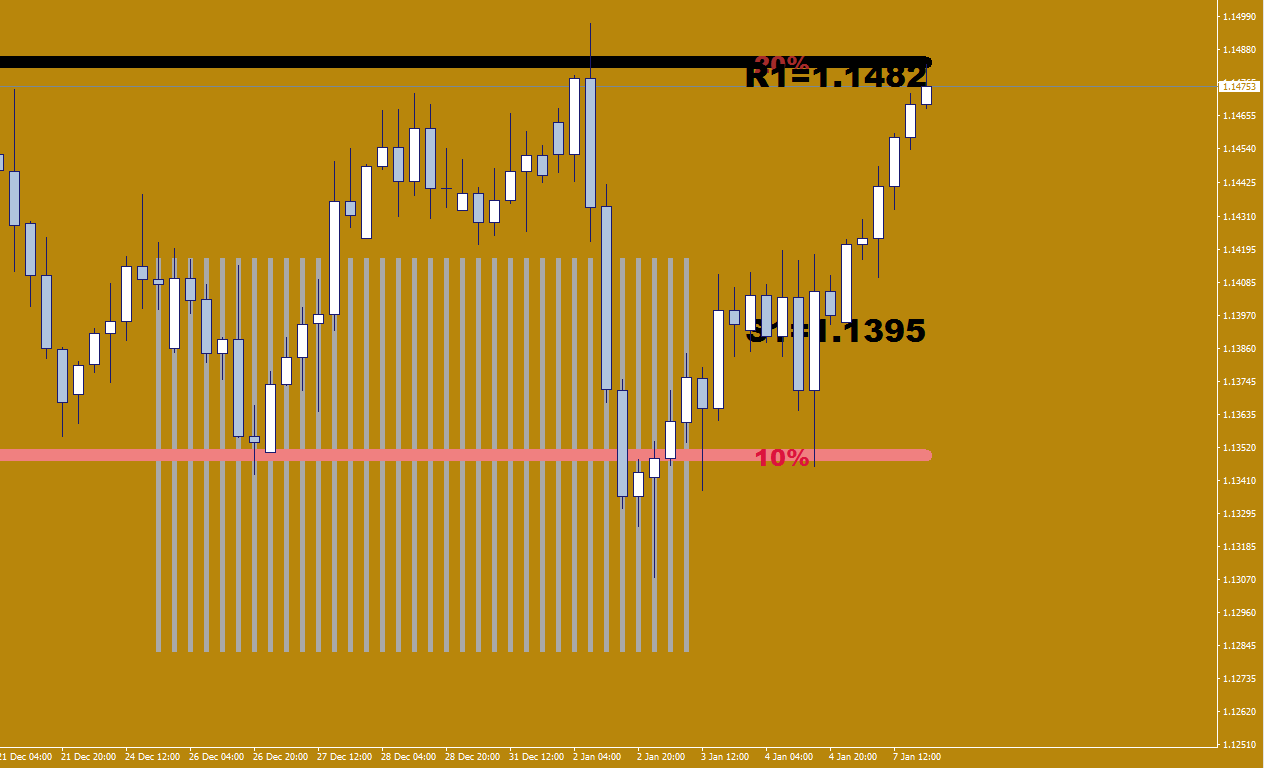
The two RSI divergences on the image above are the magenta dashes and the white “#1” prints point out that these are premium signals. You can also see what happened after they pushed the ball (price) behind the goal line (both on the up and the down side).

To find the last two RSI2 divergences, here is what you do:

  j2=1;
   while (j2<500 ){
    j=j2+3; 
      if (ExtDownFractalsBuffer[j2]==EMPTY_VALUE  && !((RSI2[j2]<RSI2[j2+1] && RSI2[j2]<RSI2[j2-1] )  ||  (RSI2[j2+1]<RSI2[j2] && RSI2[j2+1]<RSI2[j2+2] ))) 
         while (j<j2+11){
               if (iFractals(Symbol(),0,MODE_LOWER,j)
               && ((RSI2[j]<RSI2[j+1] && RSI2[j]<RSI2[j-1])  ||  (RSI2[j+1]<RSI2[j] && RSI2[j+1]<RSI2[j+2] ))
               && ((RSI2[j2]>RSI2[j] && Low[j2]<Low[j])  || (RSI2[j2]>RSI2[j+1] && Low[j2]<Low[j+1])) 
               
               ) break;
         j++;}
    if (iFractals(Symbol(),0,MODE_LOWER,j) && iFractals(Symbol(),0,MODE_LOWER,j2) && (
      (RSI2[j2]>RSI2[j] && Low[j2]<Low[j])   
    
    )) break;
        
          j2++;}  


if (j2<500 && ExtDownFractalsBuffer[j]!=EMPTY_VALUE && ExtDownFractalsBuffer[j2]!=EMPTY_VALUE  ) {LowFractalTime_2=iTime(NULL, 0,j2);    LowFractalTime_1=iTime(NULL, 0,j);    }


 if (j<500 && j<j2+11)   { 
         ObjectCreate("TEAL"+DoubleToStr(j), OBJ_RECTANGLE, 0, Time[j2], Low[j2]-FSize/2*10*Point, Time[1], Low[j2]);
         ObjectSetInteger(0,"TEAL"+DoubleToStr(j),OBJPROP_COLOR,clrTeal);
         ObjectSet("TEAL"+DoubleToStr(j),OBJPROP_WIDTH,8);                   }


 i2=1;
   while (i2<500){
      i=i2+3;
      if (ExtUpFractalsBuffer[i2]==EMPTY_VALUE && ((RSI2[i2]>RSI2[i2+1] && RSI2[i2]>RSI2[i2-1] )  ||  (RSI2[i2+1]>RSI2[i2] && RSI2[i2+1]>RSI2[i2+2] )))     
      //iFractals(Symbol(),0,MODE_UPPER,i2)
      while (i<i2+11 ){
            if (iFractals(Symbol(),0,MODE_UPPER,i)
             &&  ((RSI2[i]>RSI2[i+1] && RSI2[i]>RSI2[i-1])  ||  (RSI2[i+1]>RSI2[i] && RSI2[i+1]>RSI2[i+2] ))
            && ((RSI2[i2]<RSI2[i] && High[i2]>High[i])  || (RSI2[i2]<RSI2[i+1] && High[i2]>High[i+1])) 
            
            ) break;
         i++;}
      if (ExtUpFractalsBuffer[i]!=EMPTY_VALUE  && iFractals(Symbol(),0,MODE_UPPER,i2) && (
                 (RSI2[i2]<RSI2[i] && High[i2]>High[i])   
            ) ) break;
               i2++;}  


if (ExtUpFractalsBuffer[i] && ExtUpFractalsBuffer[i2] &&  i2<500 ) { UpFractalTime_2=iTime(NULL, 0,i2);    UpFractalTime_1=iTime(NULL, 0,i);   }
 
 
if (i<500 && i<i2+11) { 
         ObjectCreate("TEAL"+DoubleToStr(i), OBJ_RECTANGLE, 0, Time[i2], High[i2]+FSize/2*10*Point, Time[1], High[i2]);
         ObjectSetInteger(0,"TEAL"+DoubleToStr(i),OBJPROP_COLOR,clrTeal);
         ObjectSet("TEAL"+DoubleToStr(i),OBJPROP_WIDTH,8);    

Either you insert the above code into your algorithm, or you can purchase an _RSI2_ for a very low cost to do the high light for you.

The #1 signal, that prompts a mean reversion is found / plotted by the 88 Luftballons routine, and for the first time, I share here the Sync classifier part.

string printsup(int i){
   string text=EMPTY_VALUE;
   if (sup[i+1]==0  && sup[i+2]==0  && sup[i+3]==0  && sup[i+4]==0  && sup[i+5]==0 && sup[i+6]==0 && sup[i+7]==0 && sup[i+8]==0 && sup[i+9]==0  &&  sup[i+10]==0  &&  sup[i+11]==0 
      && sup[i+11]==0  && sup[i+12]==0  && sup[i+13]==0  && sup[i+14]==0  && sup[i+15]==0 && sup[i+16]==0 
      && ((count5ups(i-1)==5  ) ||  (count5ups(i)==4 && RSI2[i+1]>95 && RSI2[i-1]<50 ))
   ) text ="S #1";
    
    else if (sup[i+3]==0  && sup[i+4]==0  && sup[i+5]==0 && sup[i+6]==0 && sup[i+7]==0 && sup[i+8]==0 && sup[i+9]==0  &&  sup[i+10]==0  &&  sup[i+11]==0 &&  sup[i+12]==0 &&  sup[i+13]==0 &&  sup[i+14]==0  &&  sup[i+15]==0 &&  sup[i+16]==0) text = "S1";
    else text = "S2";   
   if (text!=EMPTY_VALUE) return(text); 
   else return("");
}

string printsdn(int i){
   string text=EMPTY_VALUE;
    if (sdn[i+1]==0  && sdn[i+2]==0  && sdn[i+3]==0  && sdn[i+4]==0  && sdn[i+5]==0 && sdn[i+6]==0 && sdn[i+7]==0 && sdn[i+8]==0 && sdn[i+9]==0  &&  sdn[i+10]==0  &&  sdn[i+11]==0 
      && sdn[i+11]==0  && sdn[i+12]==0  && sdn[i+13]==0  && sdn[i+14]==0  && sdn[i+15]==0 && sdn[i+16]==0 && sdn[i+17]==0 && sdn[i+18]==0 && sdn[i+19]==0  &&  sdn[i+20]==0  &&  sdn[i+21]==0
      && count5dns(i-1)==5
      && (RSI2[i+1]<5 && RSI2[i+2]<5 && RSI2[i+3]<5 )
   ) text ="X";
   
   else if (sdn[i+1]==0  && sdn[i+2]==0  && sdn[i+3]==0  && sdn[i+4]==0  && sdn[i+5]==0 && sdn[i+6]==0 && sdn[i+7]==0 && sdn[i+8]==0 && sdn[i+9]==0  &&  sdn[i+10]==0  &&  sdn[i+11]==0 
      && sdn[i+11]==0  && sdn[i+12]==0  && sdn[i+13]==0  && sdn[i+14]==0  && sdn[i+15]==0 && sdn[i+16]==0 && sdn[i+17]==0
     && (printsup(i+1)=="S #1"  || printsup(i+2)=="S #1"  || printsup(i+3)=="S #1" || printsup(i+4)=="S #1" || printsup(i+5)=="S #1"  )
    && Close[i]<iMA(symbol,0,414,0,MODE_EMA, PRICE_LOW,i)-FMax*10*Point
   ) text ="S #1";


   else if (sdn[i+1]==0  && sdn[i+2]==0  && sdn[i+3]==0  && sdn[i+4]==0  && sdn[i+5]==0 && sdn[i+6]==0 && sdn[i+7]==0 && sdn[i+8]==0 && sdn[i+9]==0  &&  sdn[i+10]==0  &&  sdn[i+11]==0 
      && sdn[i+11]==0  && sdn[i+12]==0  && sdn[i+13]==0  && sdn[i+14]==0  && sdn[i+15]==0 && sdn[i+16]==0 && sdn[i+17]==0 && sdn[i+18]==0 && sdn[i+19]==0  &&  sdn[i+20]==0  &&  sdn[i+21]==0
      && count5dns(i-1)==5
      && Close[i]<iMA(symbol,0,414,0,MODE_EMA, PRICE_LOW,i)-FMax*10*Point
   ) text ="S #1";
    
    else if (sdn[i+3]==0  && sdn[i+4]==0  && sdn[i+5]==0 && sdn[i+6]==0 && sdn[i+7]==0 && sdn[i+8]==0 && sdn[i+9]==0  &&  sdn[i+10]==0  &&  sdn[i+11]==0 &&  sdn[i+12]==0  &&  sdn[i+13]==0 &&  sdn[i+14]==0  &&  sdn[i+15]==0 ) text = "S1";
    else text = "S2";   
     if (text!=EMPTY_VALUE) return(text); 
   else return("");
}